
Introduction
Atopic dermatitis (AD) is a chronic and refractory skin disease with typical clinical manifestations of repeated itching, skin erythema, dryness, thickening, and swelling [1–3]. About 15–30% of children and 2–10% of adults worldwide are affected by atopic dermatitis [4, 5]. With the maturity of gene sequencing technology, studies have shown that there are abnormally expressed genes in the skin of patients with atopic dermatitis, but the relative importance of each gene is still unclear. Therefore, it is necessary to determine the sensitive and specific biomarkers that affect the progression of atopic dermatitis and clarify the relevant molecular mechanisms to provide a predictive prognosis and develop new targeted treatment strategies.
Gene expression microarrays have been widely applied in atopic dermatitis research and represent an important new tool for use in the identification of disease-related molecules associated with atopic dermatitis. recently, comprehensive analysis of microarray data from multiple centres has become a popular research area. Mining hub genes through bioinformatics analysis is a new method to study the pathogenesis of complex diseases [6, 7]. In this study, we downloaded 3 gene datasets (GSE121212, GSE5667, and GSE120721) from the GEO database, and screened and compared them. Differentially expressed genes (DEGs) were identified by comparing the diseased skin lesions of patients with atopic dermatitis vs. normal skin of healthy patients in each dataset. A series of analyses of these differentially expressed genes, including GO enrichment, KEGG pathway analysis, PPI network analysis, and cell test, predicted 9 hub genes and related pathways.
Material and methods
Data source
The original datasets of GSE121212 [8], GSE5667 [9, 10], and GSE120721 [11] were downloaded from the National Centre of Biotechnology Information (NCBI)-GEO database (https://www.ncbi.nlm.nih.gov/geo/), which includes a large number of tumour and non-tumour sequencing and microarray-based datasets. We compared lesions from AD patients with normal patients’ skin.
Identification of DEGs
The differentially expressed genes(DEGs)of GSE5667, GSE120721 were performed by default setting of the GEO2R tool (https://www.ncbi.nlm.nih.gov/geo/geo2r/), an online analytic tool provided by the GEO database,was employed to perform differential expression analysis. Firstly, enter GSE5667 and GSE120721 in the GEO accession box respectively. Secondly, we divided samples in each above dataset into two groups, namely skin lesional AD group (AD) and skin normal health group (Nor). Then, differential expression analysis was done between “AD” group and “Nor” group. Because GEO2R could not analyze GSE121212, we used the “DESeq2” package of R software to analyze the differential expression for GSE121212 in the same grouping method. DEGs that with |log2 FC| > 1 and p < 0.05 were considered statistically significant were visualized using the “Pheatmap” package of R software. Scatter charts were plotted using GraphPad Prism 7.0.
GO and KEGG pathway analyses
We used the “ClusterProfiler-GOplot and ggplot2” R package to analyse and visualize the GO and KEGG pathway enrichment of the obtained DEGs [12, 13] (p-value < 0.05 and FDR < 0.01 were considered statistically significant). For GO analyses, enriched biological processes (BPs), molecular functions (MFs), and cellular components (CCs) were assessed.
Protein-protein interaction (PPI) network and hub gene analyses
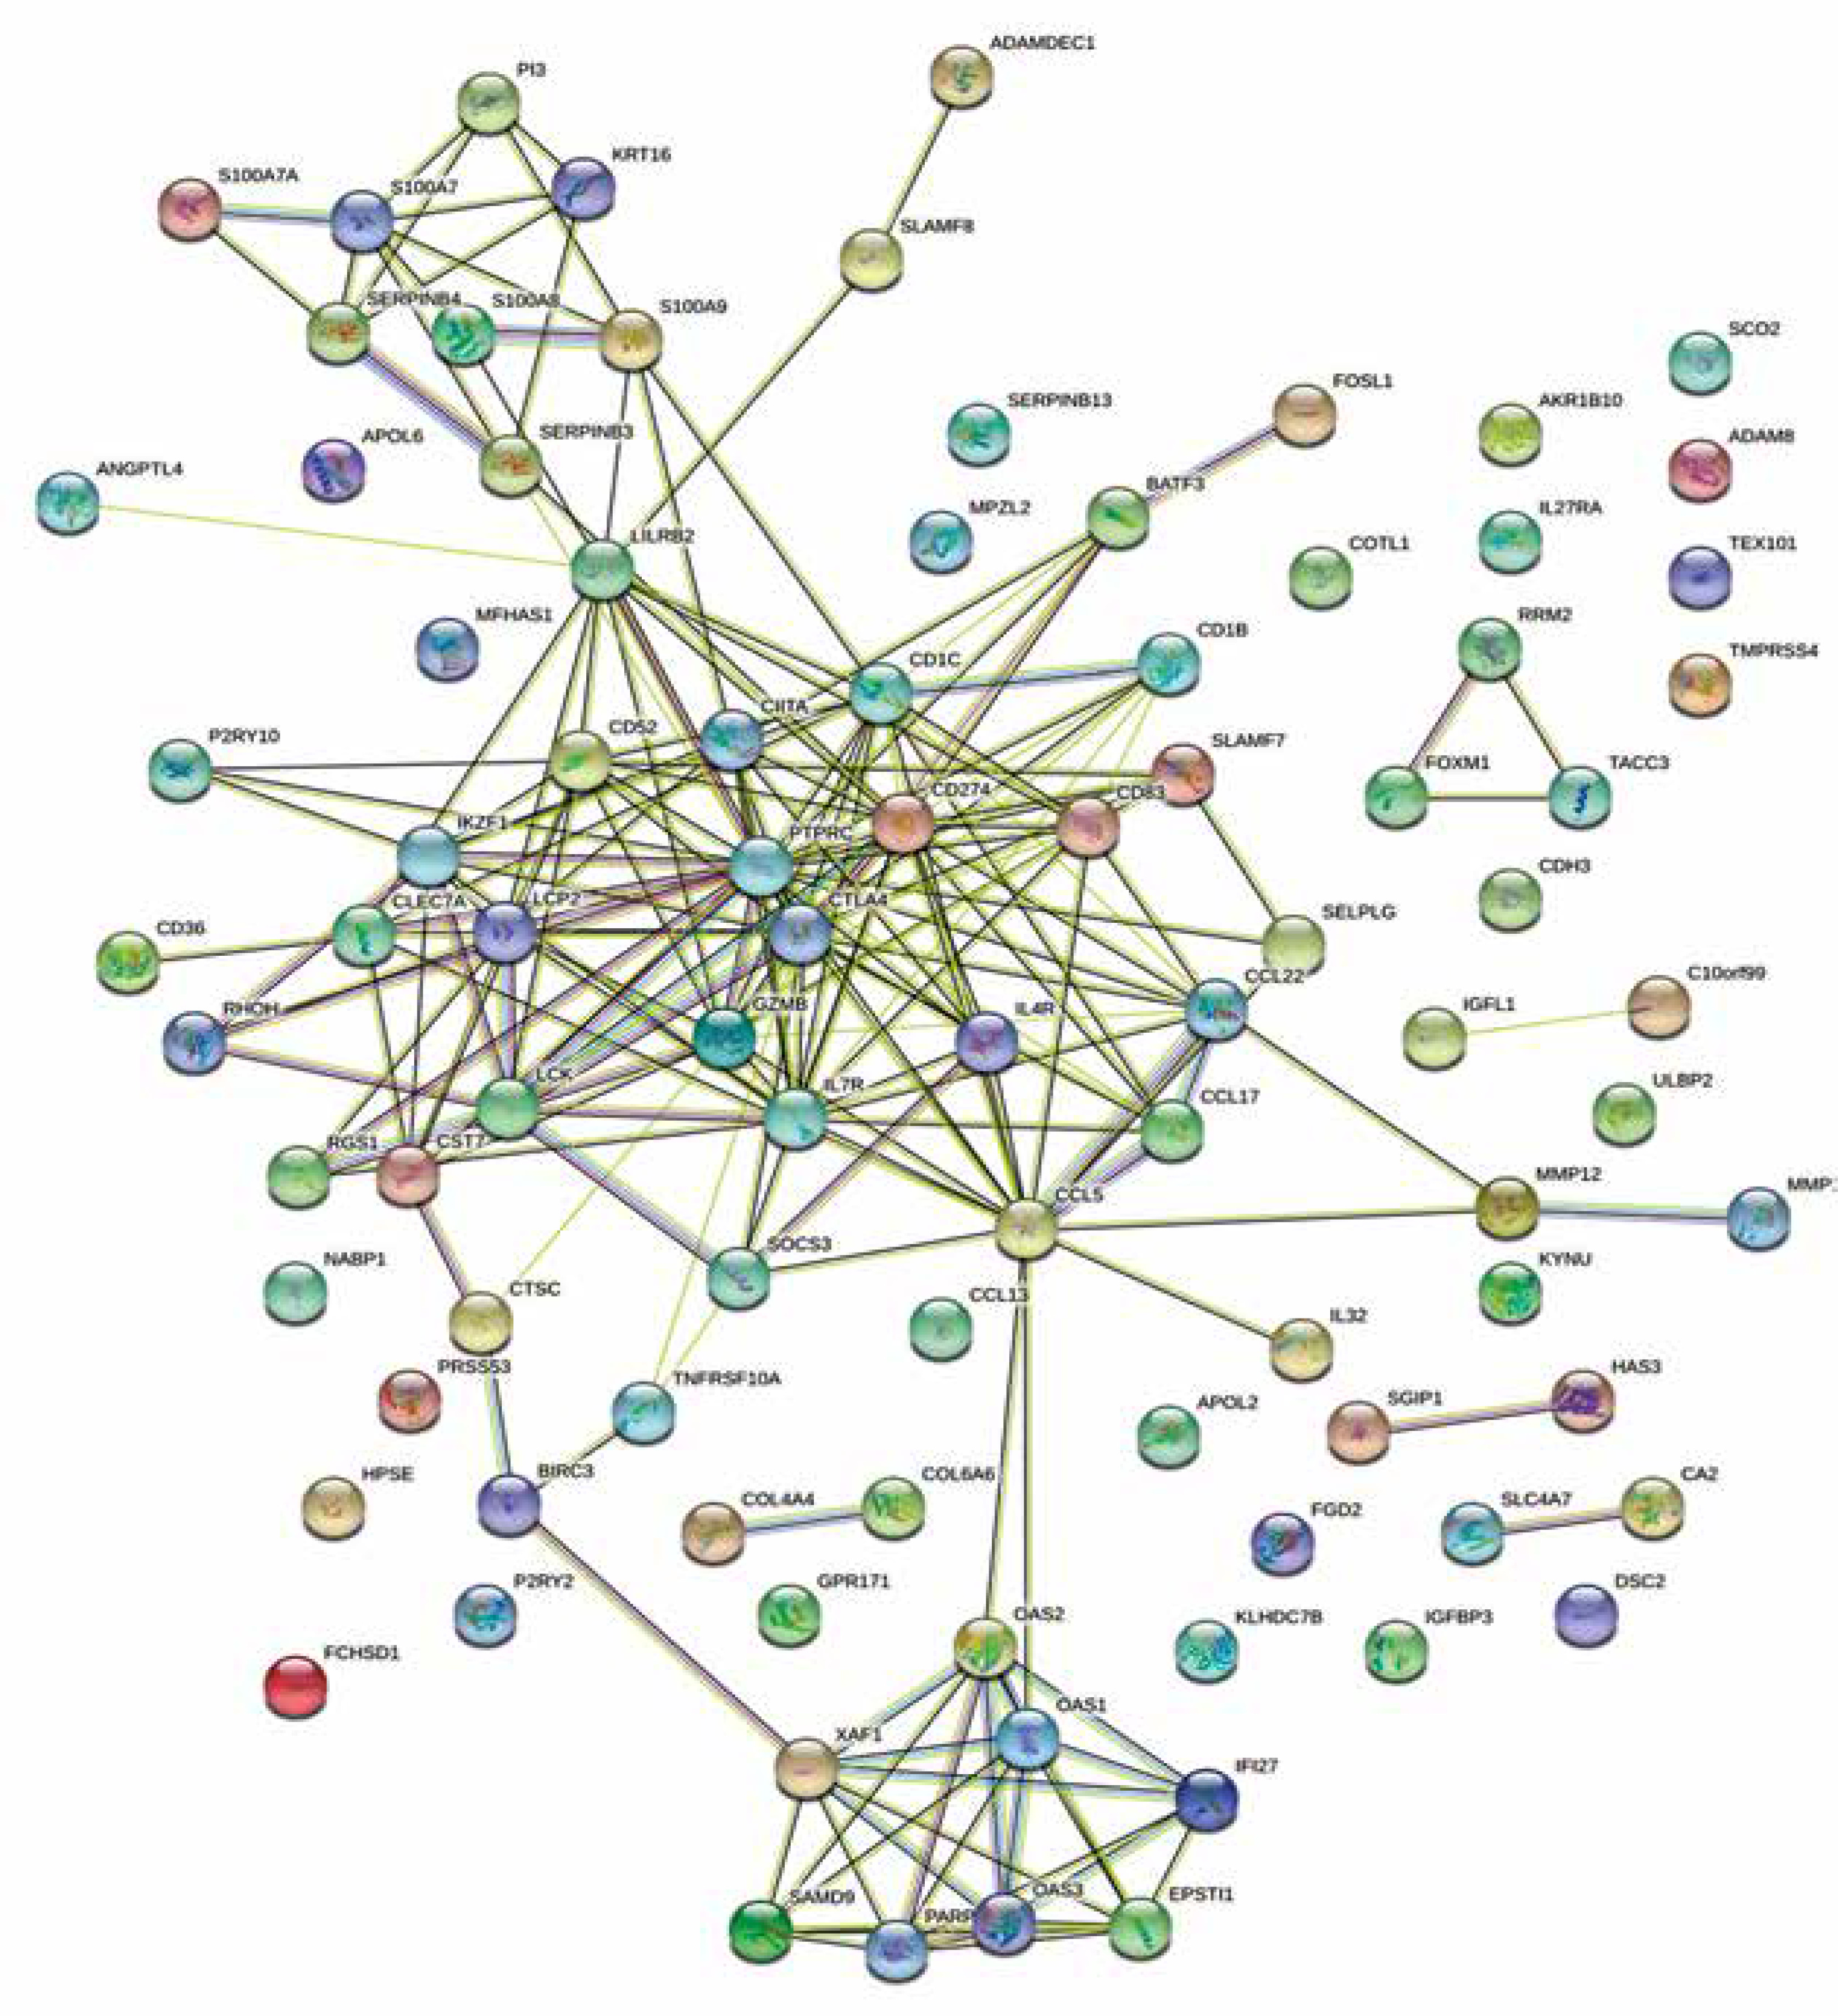
To understand interactions among DEGs, the Search Tool for the Retrieval of Interacting Genes (STRING) [14] (https://string-db.org) constructed PPI networks by importing upregulated DEGs. Cytoscape (v 3.8.2) was used to visualize the network, while the cyto-Hubba plugin was used to rank genes within this network based upon their score. Hub genes, which were considered to be involved in playing pivotal regulatory roles in the PPI network, were those with the top 9 highest score values.
Results
Identification of DEGs
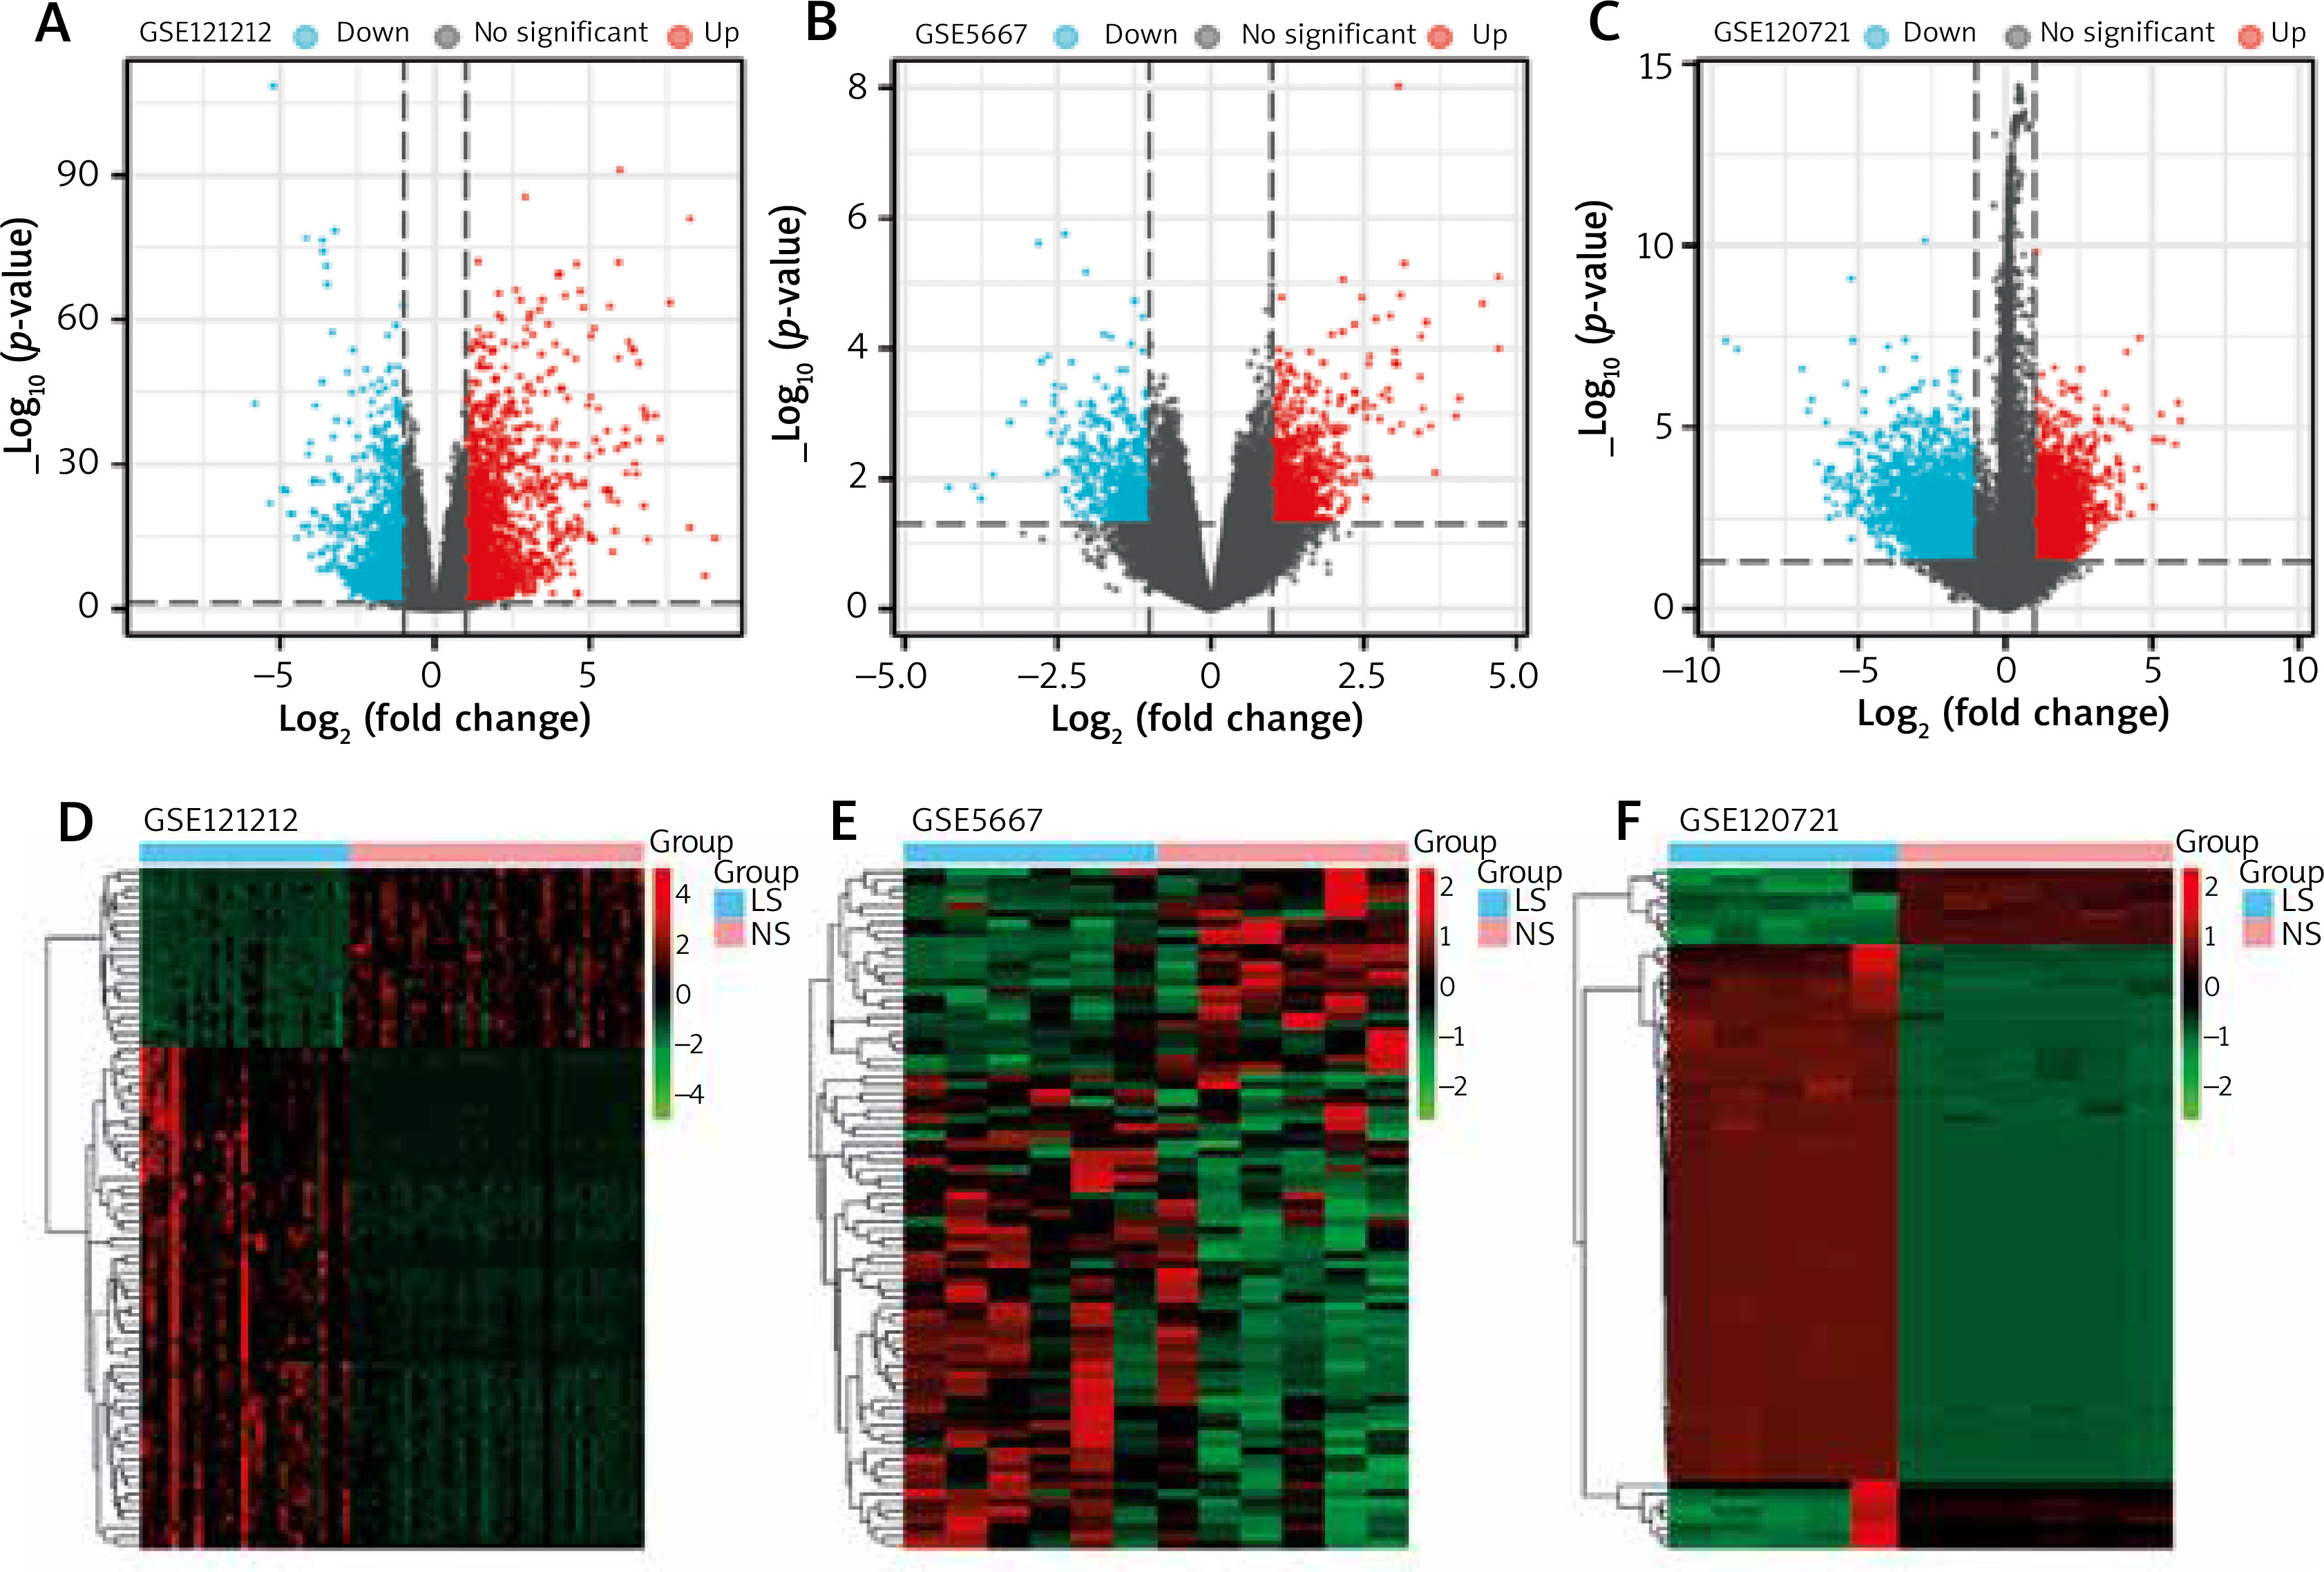
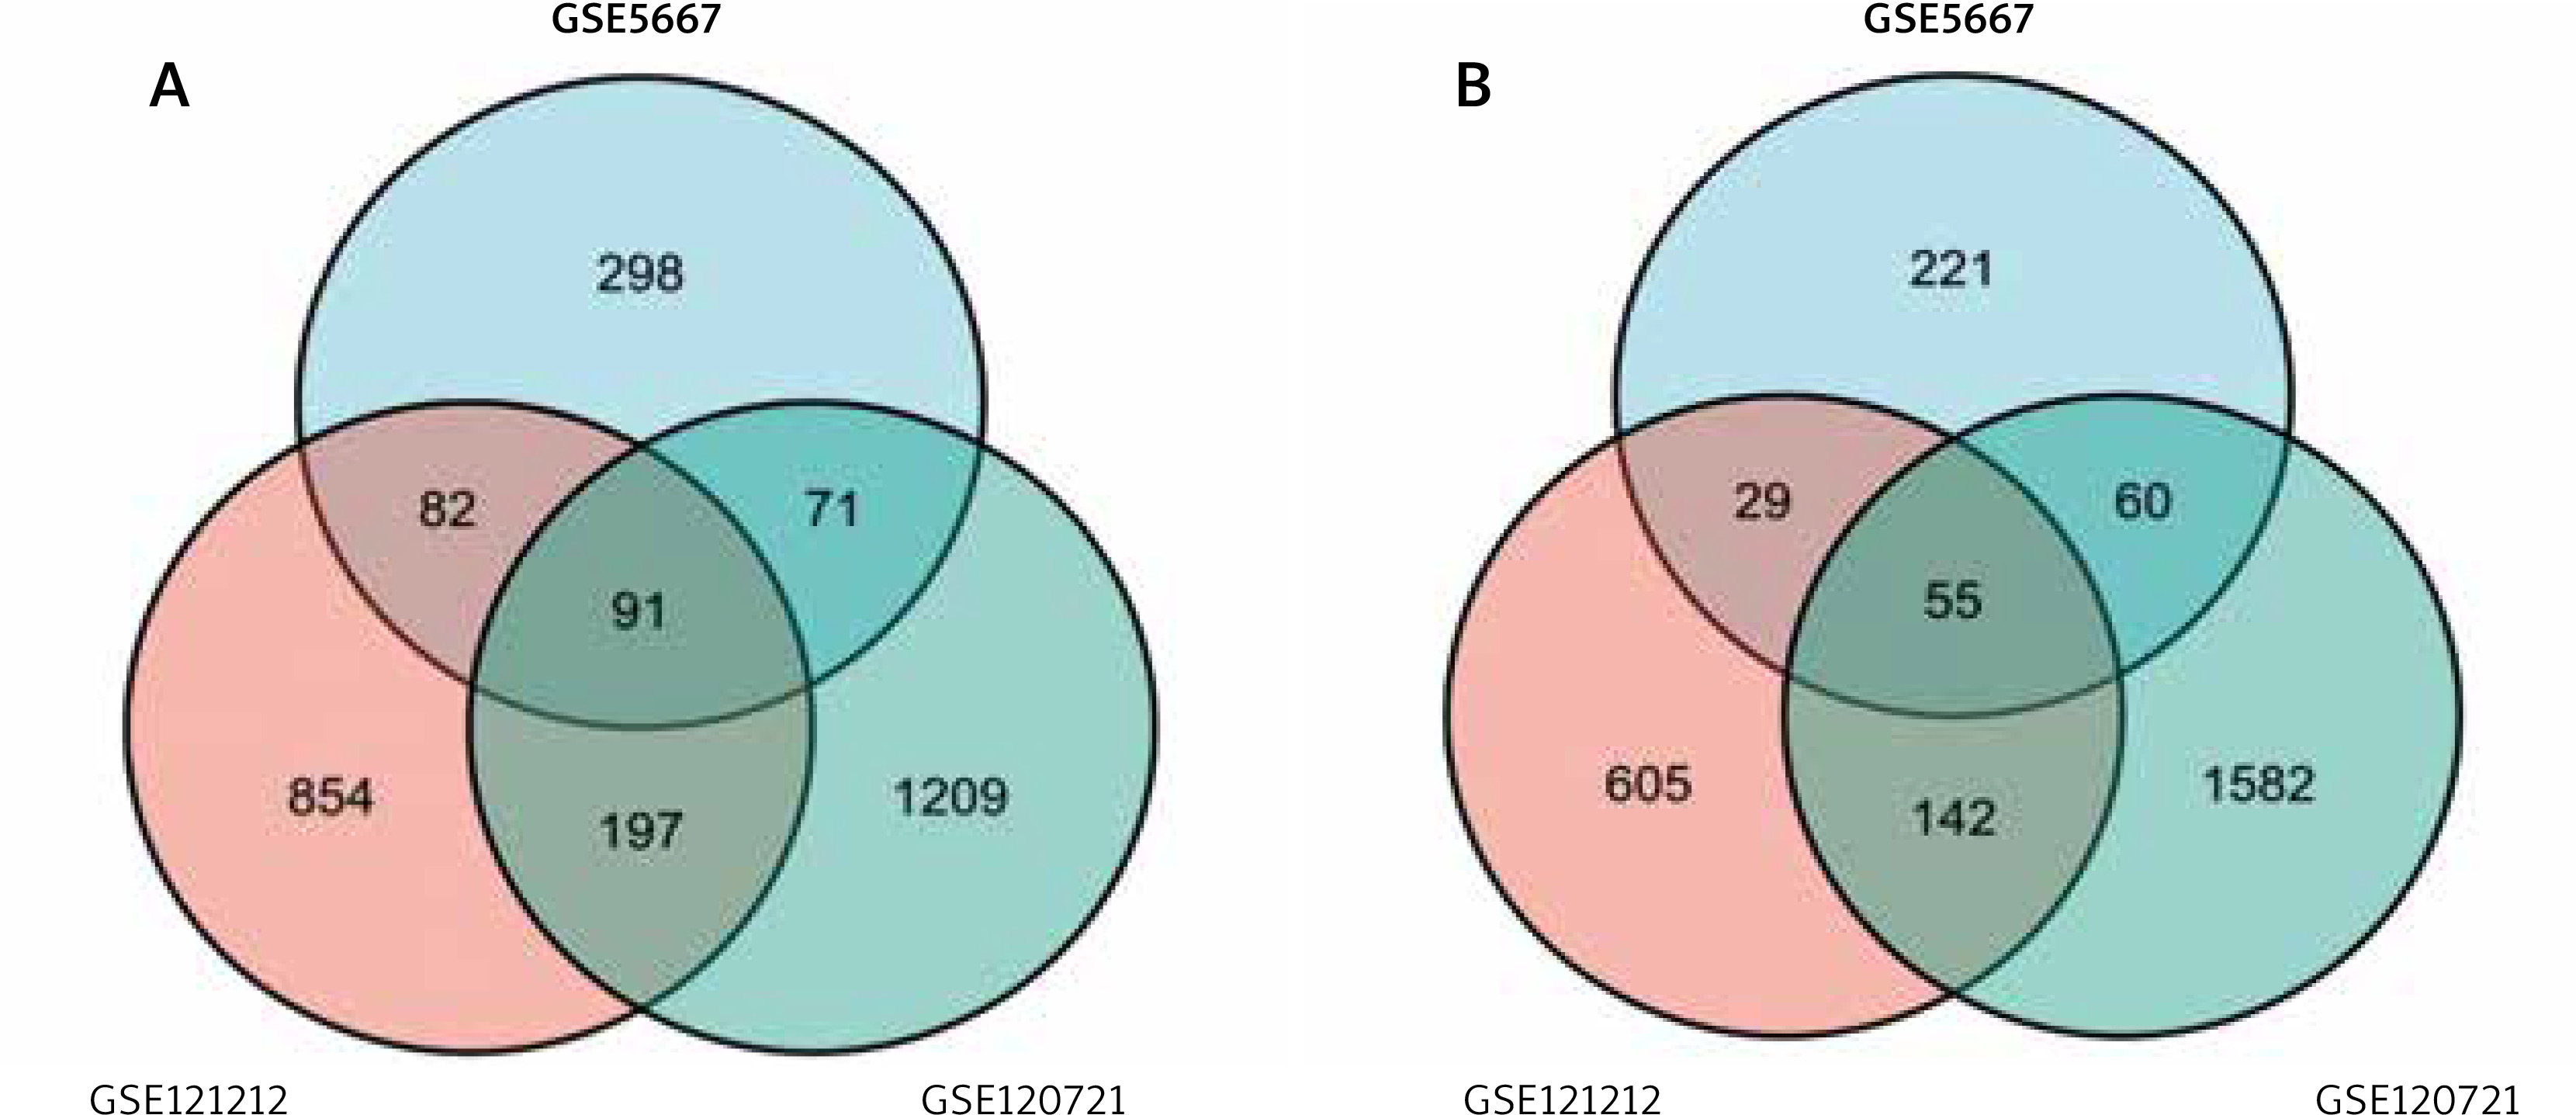
The GSE121212, GSE5667, and GSE120721 gene expression datasets were downloaded from the GEO datasets obtained from the GEO database. In total, 4231 DEGs were identified in the GSE121212 dataset (1884 upregulated, 2347 downregulated), 1381 were identified in the GSE5667 dataset (811 upregulated, 570 downregulated), and 5020 were identified in the GSE120721 dataset (2395 upregulated, 2625 downregulated). The top 100 DEGs with the highest p-values are presented in Figure 1. Ninety-one upregulated DEGs and 55 downregulated DEGs were shared between these 3 datasets, as identified through Venn diagram analyses (Figure 2, Table 1).
Table 1
Common upregulated/downregulated DEGs identified among GSE121212, GSE5667, and GSE120721
Figure 1
Differentially expressed genes (DEGs) in the 3 datasets. A–C – The upregulated DEGs (red dots) and downregulated DEGs (blue dots) of each dataset were identified with the use of criteria of p < 0.05 and |log2FC| > 1. D–F – Expression heatmaps of the top 100 DEGs in the 3 datasets, as determined based upon p-values
GO and KEGG pathway analyses
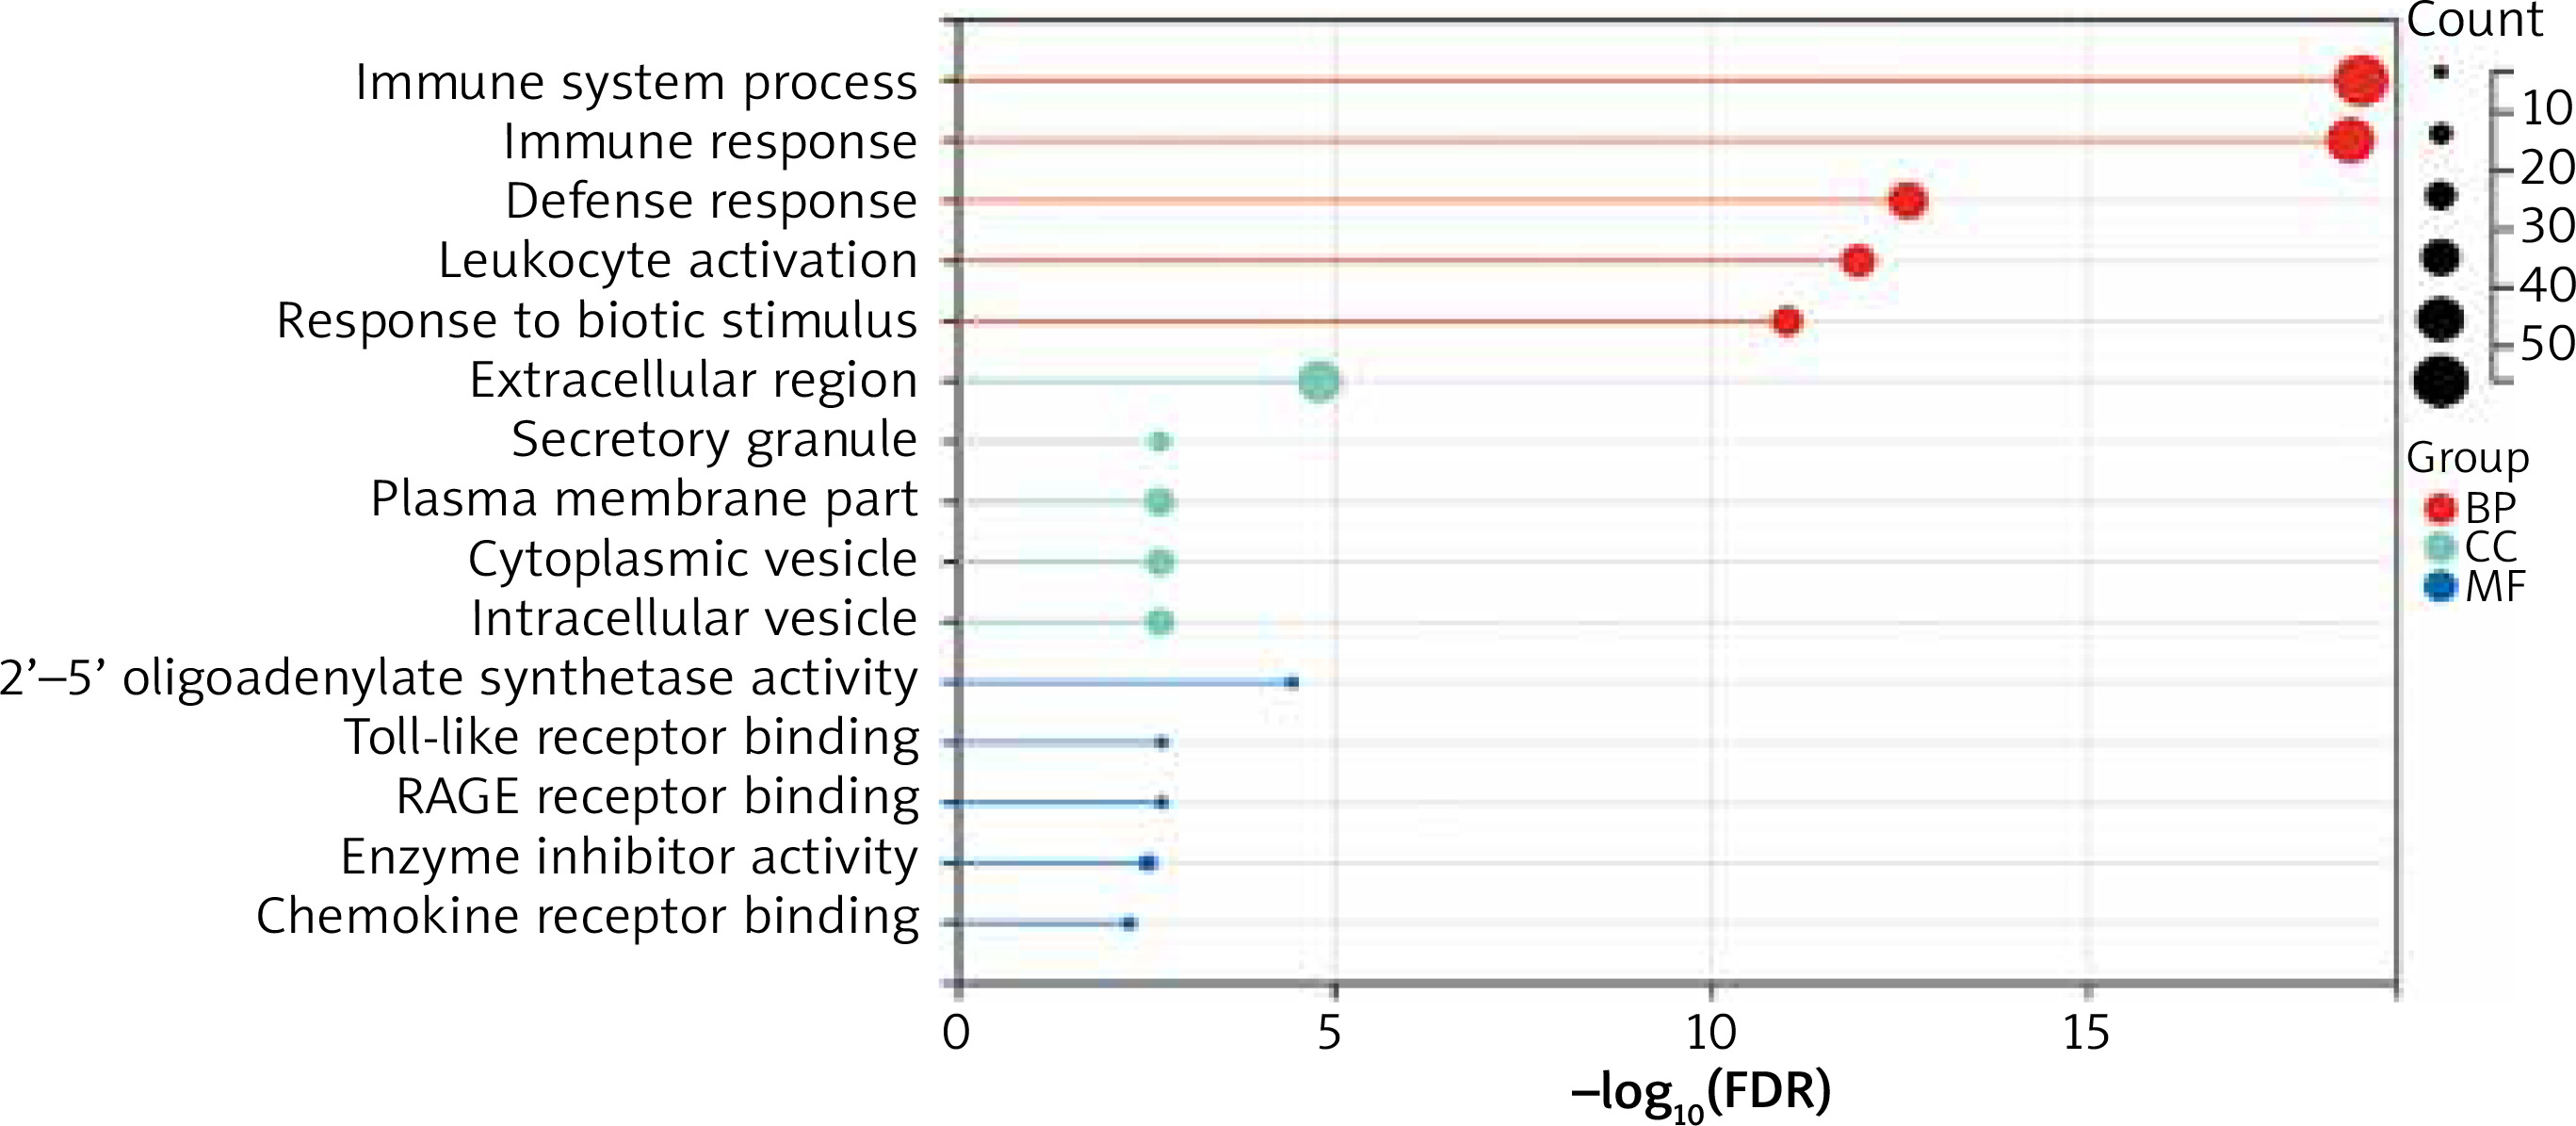
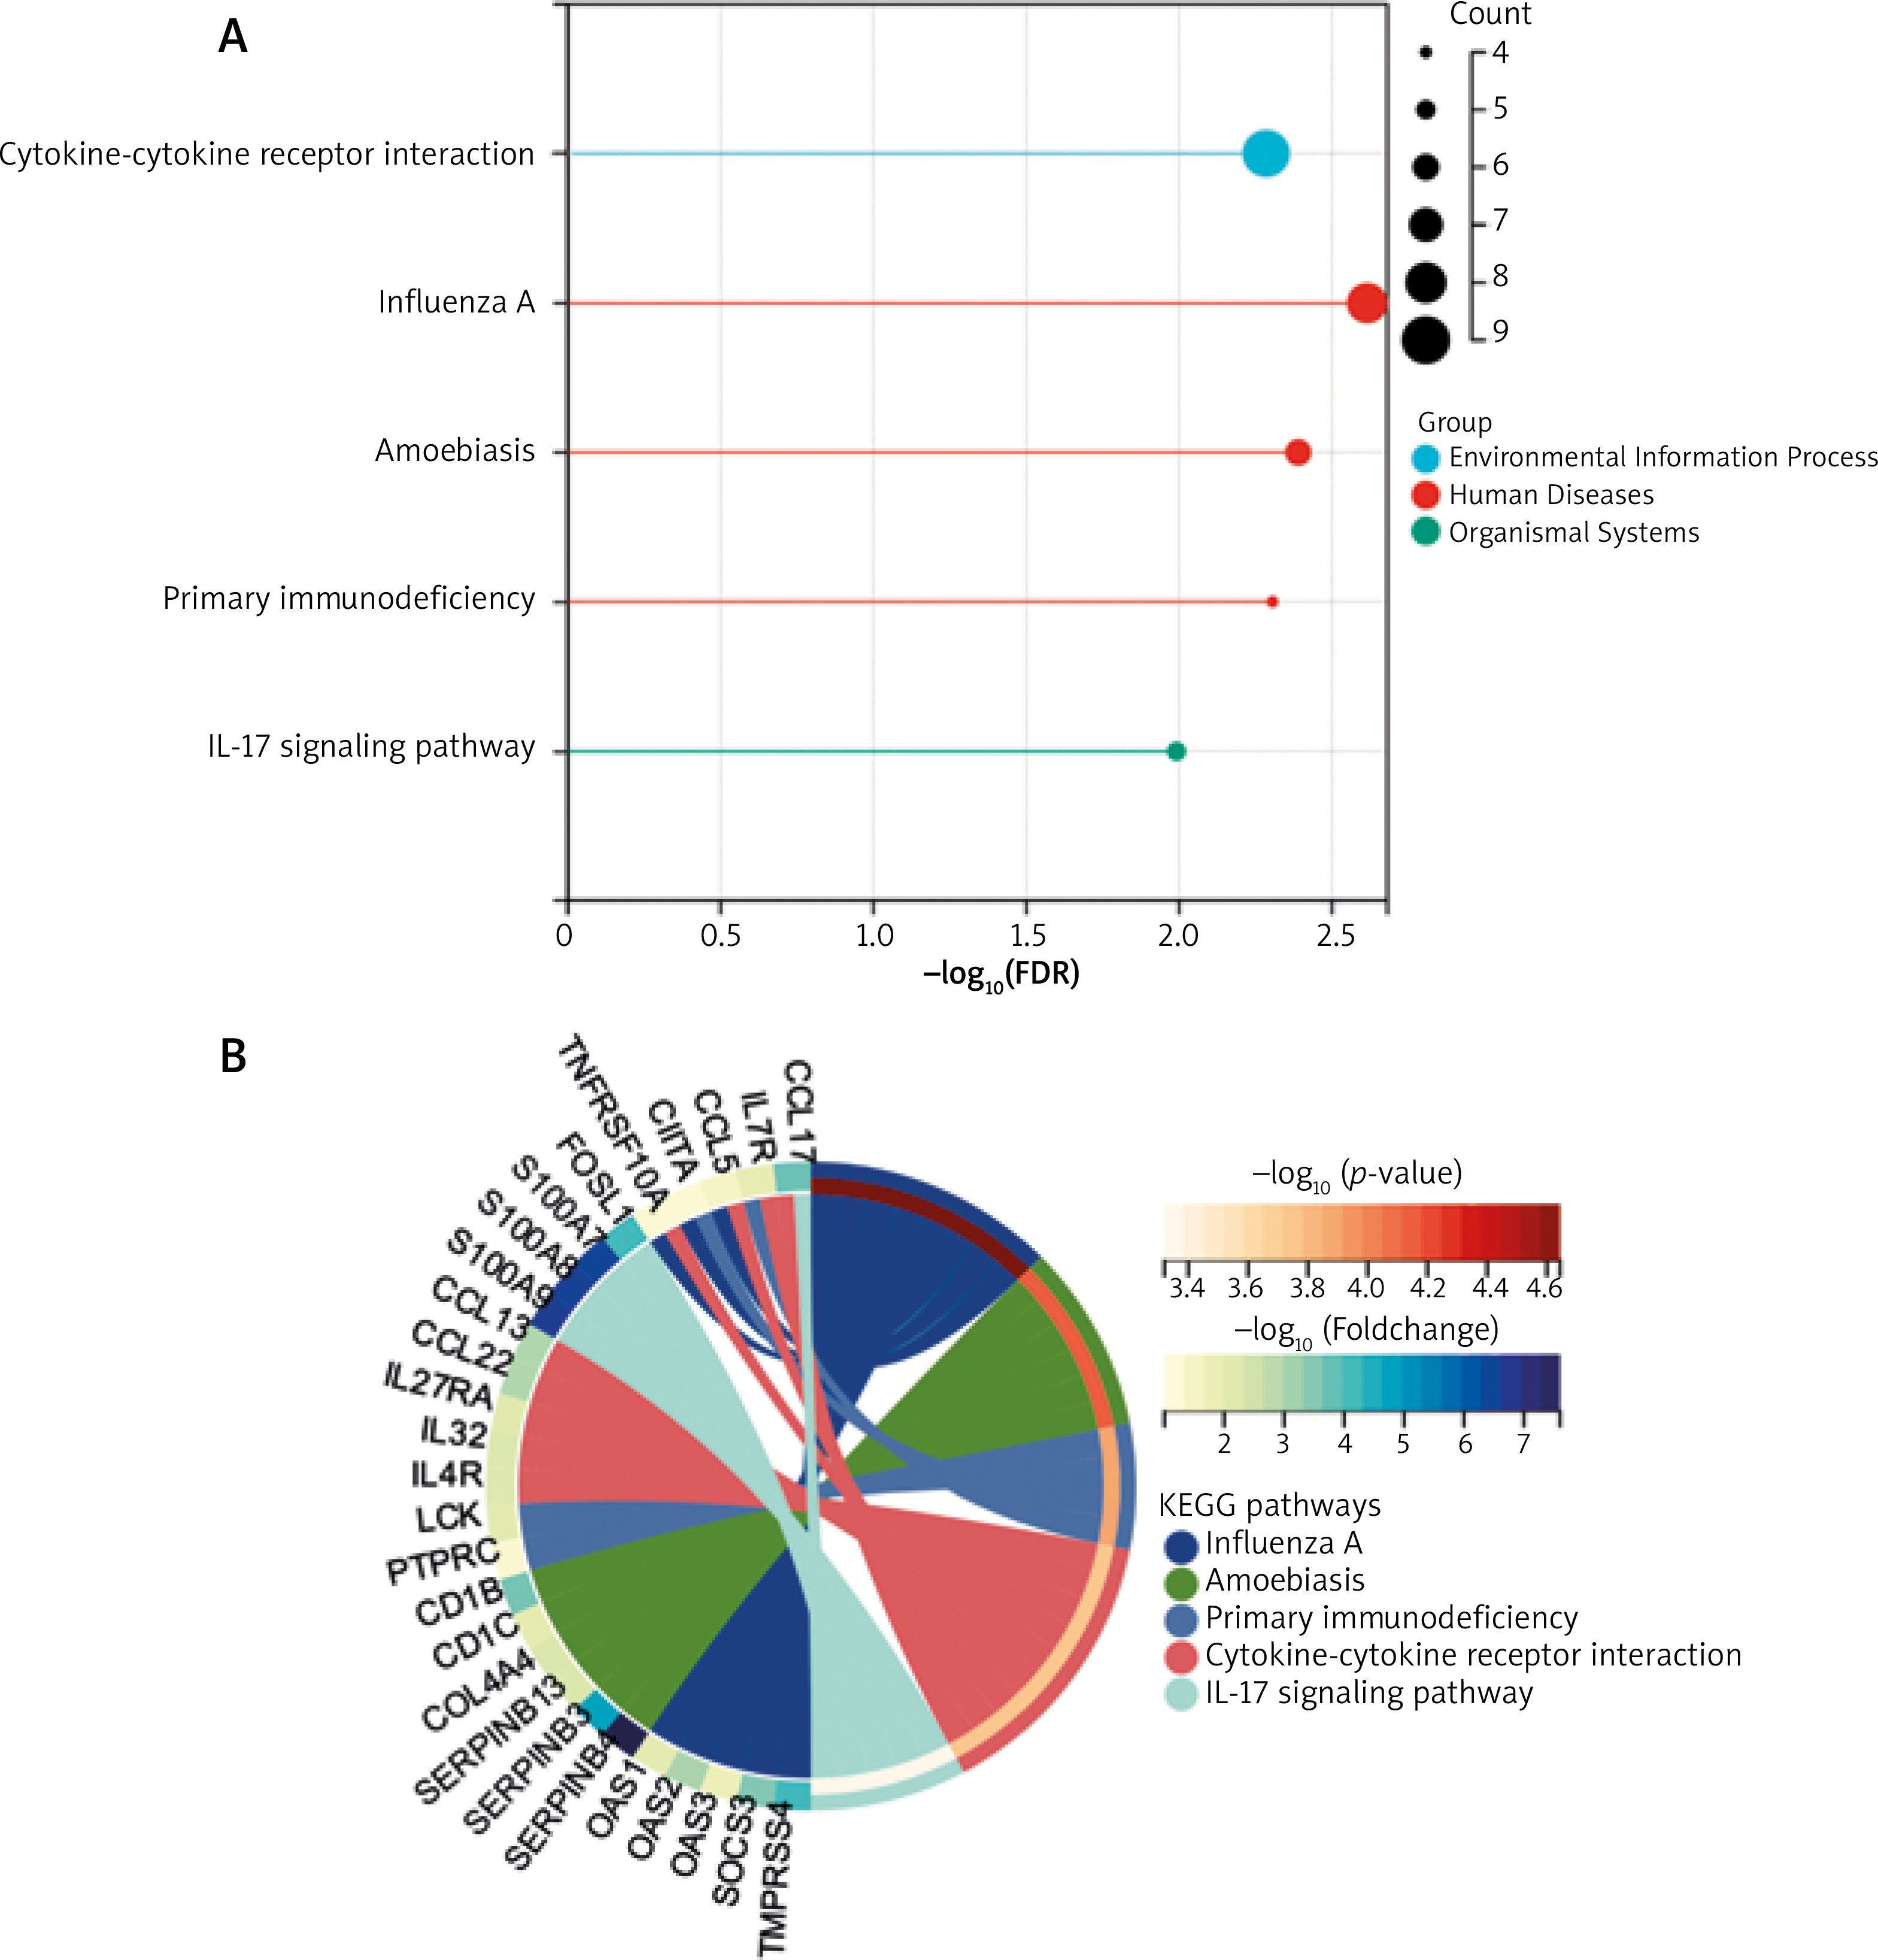
GO analyses revealed these DEGs to be enriched in biological processes including immune system process, immune response, defence response, leukocyte activation, response to biotic stimulus, molecular functions including 2’–5’-oligoadenylate synthetase activity, Toll-like receptor binding, RAGE receptor binding, enzyme inhibitor activity, chemokine receptor binding and cellular components including the extracellular region, secretory granule, plasma membrane part, cytoplasmic vesicle, and intracellular vesicle. These DEGs were also enriched in KEGG pathways, including influenza A, amoebiasis, primary immunodeficiency, cytokine-cytokine receptor interaction, and IL-17 signalling pathway (Table 2, Figure 3). Enrichment results of these analyses are compiled in Figure 4.
Table 2
GO and KEGG pathway enrichment analyses for module genes. The top 5 terms were selected based upon p-value rankings when > 5 terms were enriched for a given category
PPI Network Construction and Hub Gene Identification
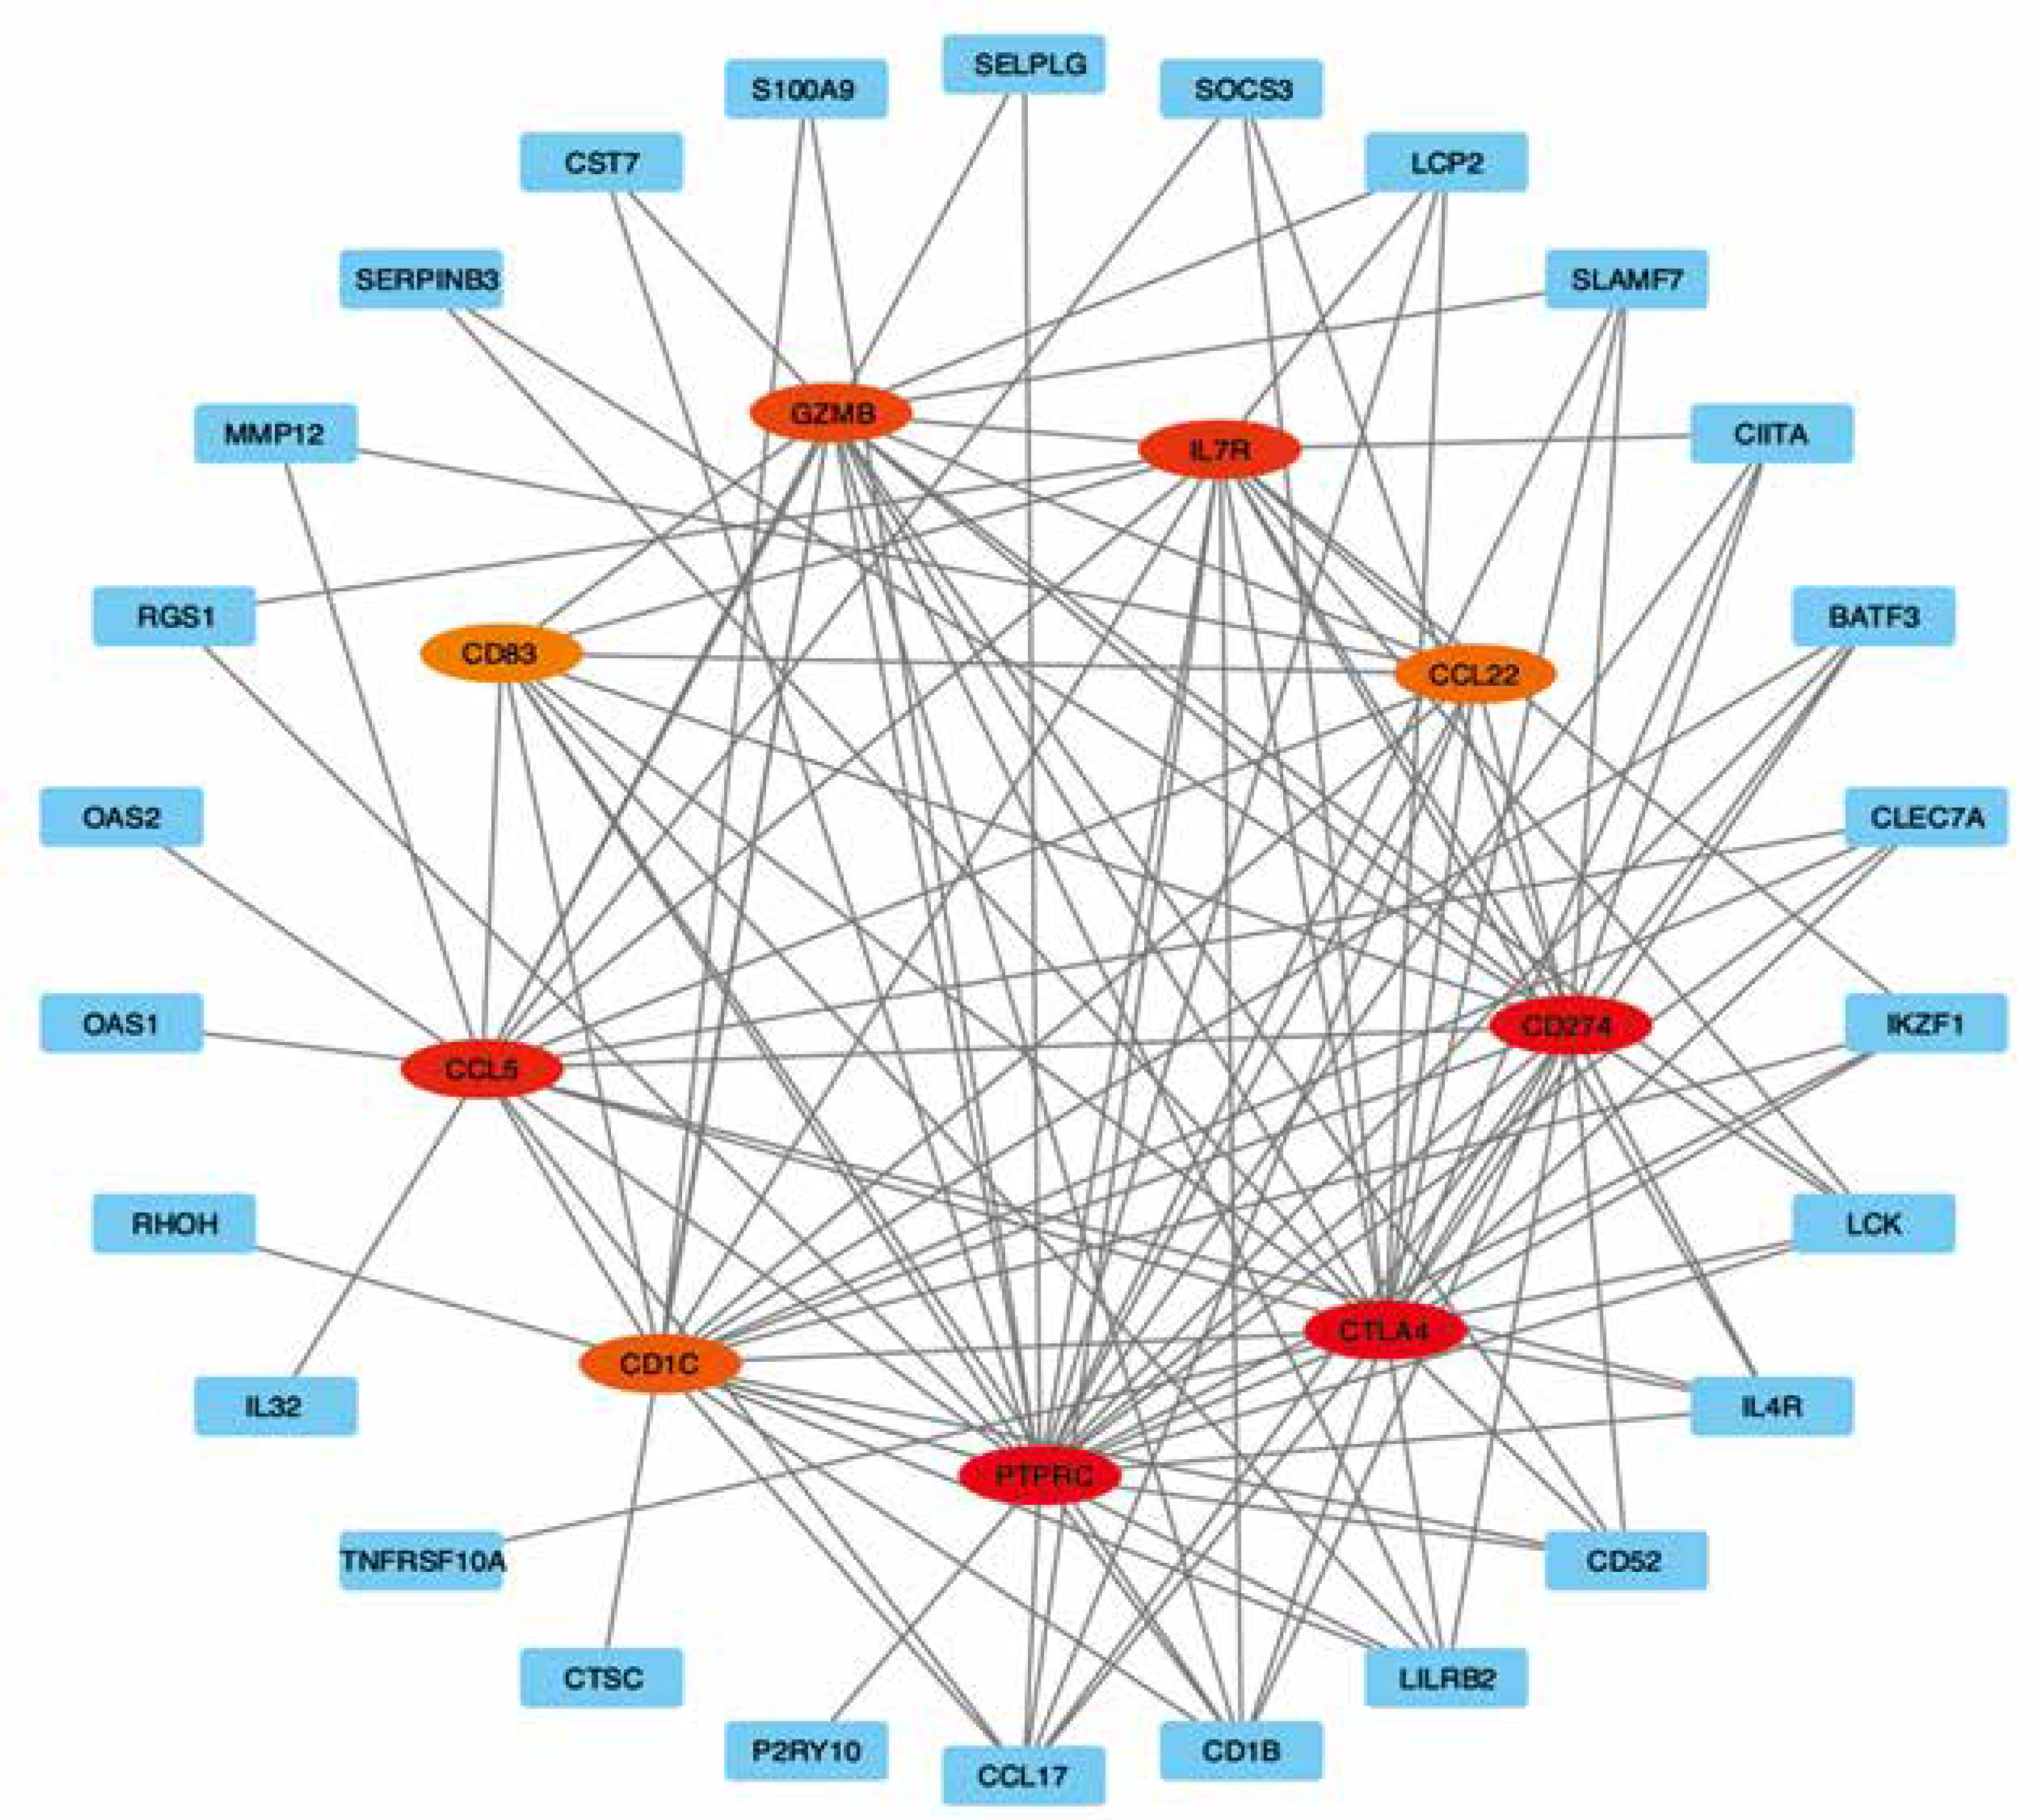
The STRING database was used to construct a DEG PPI network (Figure 5), and the top 9 hub genes with the highest score values were determined by using cytoHubba from Cytoscape v. 3.8.2. These hub genes were PTPRC-CTLA4-CD274-CD1C-IL7R-GZMB-CCL5-CD83, and CCL22 (Table 3, Figure 6).
Table 3
MCC of the top 9 genes in the top module
Discussion
Atopic dermatitis (AD) is an immune-mediated chronic pruritus and inflammatory skin disease. Recurrence and remission usually occur alternately during the disease. The incidence rate of atopic dermatitis (AD) is increasing year by year. In addition to the negative impact on physical and mental health, the cost of AD also brings a huge burden to individuals and society [15]. Although dozens of medications are available for relief of the symptoms of this disease, no cure for AD currently exists. Therefore, identification of key molecules that play key roles in the pathogenesis of the disease for potential development of therapeutic targets represents an important area of investigation.
In this study, through the analysis of 3 AD-related datasets, 143 DEGs were screened, including 91 up-regulated genes and 55 down-regulated genes. Because phenotypic changes in AD patients are mostly related to gene up-regulation, this study focused on further analysis of up-regulated genes. In our GO enrichment results, upregulated genes were mainly concentrated in biological processes, including immune system process, immune response, defence response, leukocyte activation, response to biotic stimulus are the enrichment results of top 5. The results from our KEGG pathway analysis revealed that a high enrichment in viral infection and inflammatory response pathways were present in upregulated genes. These pathways were divided into 3 groups: environmental information processes, human diseases, and organismal systems.
AD is a heterogeneous disease [16–19], which is categorized as extrinsic type or intrinsic type based on an increased or normal level of serum IgE, respectively, without considering the age or gender of the patients. Most AD patients (about 80%) are exogenous or allergic. It is characterized by high serum IgE levels and the presence of specific IgE related to environmental and food allergies. Exogenous AD with skin dysfunction is related to filaggrin mutation-and external irritation or allergens can be transcutaneously sensitized due to skin dysfunction, resulting in increased serum IgE. Thus, extrinsic AD is a prototype of skin damage-induced Th2-type dermatitis. Patients with extrinsic AD have age of onset dependence-related risks, such as food allergies, allergic rhinitis, and allergic asthma [20]. About 20% of AD cases classified as endogenous or non-allergic are characterized by normal IgE levels or lack of allergen-specific IgE [21]. On the contrary, Th2 cells are highly activated by external stimuli such as metal ions or haptens (small molecules capable of binding to proteins and changing their immunogenicity).
Atopic dermatitis is currently mainly driven by three main pathological factors: disruption of the skin barrier, altered Th2 cell response, and pruritus [15]. The biological functions of the top 5 highly related genes obtained by GO enrichment and the KEGG pathway are also consistent with the 3 main pathological factors of AD.
The PPi network was constructed by the STRING database, and the Cytoscape software calculated the hub genes. With these analyses, 9 top hub genes, included PTPRC, CTLA4, CD274, CD1C, IL7R, GZMB, CCL5, CD83, and CCL22, were identified.
PTPRC is a member of the protein tyrosine phosphatase (PTP) family. PTPs are known to be signalling molecules that regulate a variety of cellular processes including cell growth, differentiation, mitosis, and oncogenic transformation. This gene encodes CD45 and functions as a signalling gatekeeper in T-cells. Tt is reported that this gene is associated with infection and immune deficiencies [22]. PTPRC and COMMD10 of coding and splicing variants are involved in memory T cell differentiation, and genetic variation controlling T helper cell subsets with crucial roles in protection against infection and susceptibility to autoimmune disease [23]. Unfortunately, studies on PTPRC in AD are still very limited. This situation reminds us that PTPRC may be a key gene in the pathogenesis of psoriasis, which has long been neglected and deserves intensive study.
CTLA4 plays an essential role in the function of the regulatory T cells that control Th1 and Th2 immune responses. Borrego et al. reported the polymorphisms of CTLA4 are also associated with severe asthma [24], and the most severe AD cases are related to bronchial obstruction, so this gene may be a marker of moderate to severe AD.
The immunosuppressive performance of CD274 has been reported in many malignant tumour diseases, and related drugs have also been developed as immunotherapy targets. However, in skin-related diseases, Tanaka et al. reported that PD-L1 (CD274) plays predominant roles in Th1 and Th17 type immunity, whereas PD-L2 is involved in Th2-type immunity [25]. One study indicated that progression from acute to chronic AD lesions was associated with intensification along a progression of inflammatory mediators rather than distinct immunological mechanisms [26]. In AD patients, Th2-mediated responses are more prominent in the acute phase, whereas Th1-mediated responses are more prominent in chronic AD disease [27]. In our study, the CD274 score ranked high, echoing the previous reports, so we can conduct further studies on this gene in AD to understand its functional mechanism.
CD1C is the subgroup of CD1, which is structurally and functionally similar to MHC class I and II molecules, usually as a marker of the Th2-promoting subtype (mDC2). There is no report to directly verify the direct mechanism of CD1C in AD patients [28].
IL7R plays a role in AD by encoding a heterodimeric receptor complex composed of IL7Ra and TSLP [29]. Berna et al. sequenced TSLP and IL7R in AD patients and confirmed both genes are up-regulation, meanwhile, they had conducted NGS of the TSLP and IL7R, founding that IL7R variants may modulate the effect of TSLP variants which are associated with more persistent AD [30], which is consistent with our hub gene prediction [30].
GZMB encodes granzyme B, which has a pro-apoptotic effect. New research shows that the protease plays extracellular roles involving the proteolytic cleavage of extracellular matrix, cell adhesion proteins, and basement membrane proteins. Kamata et al. [31] reported GZMB was significantly higher in AD patients than in healthy controls. Correlation analyses showed that GZMB positively correlated with serum levels of GRP, an itch-related peptide, and dermatitis severity markers such as thymus and activation-regulated chemokine in patients with AD.They considered that GZMB may reflect the degree of dermatitis and pruritus in AD patients.
CD83 can encode a single-pass type I membrane protein and member of the immunoglobulin superfamily of receptors. The protein binds to dendritic cells and inhibits their maturation in a soluble form. He et al. construct a transcriptome of tape strips from lesional and nonlesional, the skin of adults with moderate-to-severe AD and psoriasis studies confirmed the overexpression of CD83, which is consistent with our screening results [32]. However, there is currently less research on the mechanism of CD83 in AD, encourages further study of therapeutics targeting this gene in AD [32].
CCL22 and CCL5 are both motif chemokine mRNAs and chemokines form a superfamily of secreted proteins involved in immunoregulatory and inflammatory processes. Studies have shown that by testing the human peripheral blood mononuclear cells (PBMCs) of AD patients and healthy controls, CCL22 and the expression of CCL5 increased in the AD group [33].
Study limitations: Because of the molecular complexity of atopic dermatitis, the present study could not provide sufficient information on the systematic functions of the 9 identified hub genes in the pathogenesis of atopic dermatitis. Further extensive studies on this issue are warranted in the future.


