Introduction
Residency training programs are expected to provide residents with exposure to research opportunities [1]. Reported benefits of resident exposure to research include increased satisfaction with training [2, 3], increased lifelong learning and analytical skills [4, 5], improved patient care [6], and increased likelihood of pursuing academic careers [7–9]. Furthermore, these residents are more likely to choose careers in research [4], which may be important because of the predicted shortage of clinician-investigators in the United States [10].
Despite these benefits, many barriers to resident research have been identified. These include lack of resident and faculty time for research [11–13], availability of mentors [14, 15], absence of research curricula [14, 15], paucity of funding for research [14, 16], and lack of perceived value of research to residents [17]. In addition, interventions to increase research take a significant amount of time to show benefits; residents acquiring research skills may not see success before leaving residency. For more than 50 years [18], United States GME programs have attempted to navigate these challenges and with the transition to the Accreditation Council on Graduate Medical Education’s (ACGME) Next Accreditation System, they are now being measured on their effectiveness to stimulate resident research. This shift requires residencies to enumerate their department’s annual publication outcomes, but programs were given the latitude to develop their own process to achieve those outcomes [19].
In order to determine what programmatic interventions lead to improvement in resident research production, we performed a systematic review of the literature to identify and compare published studies of programmatic interventions in residency training which included number of publications as an outcome of their study. Our intention was to both quantify published interventions in GME and to compare effectiveness in order to allow others to develop or update their resident research programs.
Material and methods
This systematic review was conducted according to PRISMA guidelines [20]. We sought to answer two questions: (1) what interventions have been performed in GME to increase resident scholarly activity, and (2) how do outcomes compare across interventions?
Broad inclusion criteria were used to capture any reported interventions at the GME level intended to improve resident scholarly activity. English-language studies were included that described any interventions on Graduate Medical Education trainees whose outcomes included peer-reviewed publications, so interventions could be compared across programs. We created a standard measure to quantify publications across programs (“publication effectiveness”), which we defined as publications/year. All published works in peer-reviewed journals, including letters, case reports, case series, meta-analyses or randomized trials but not abstracts or presentations were counted in the numerator. Publication rates were averaged across the length of time of the study. Studies without an intervention or not reporting program-level publication outcomes, cross-sectional studies that did not report outcomes over time, and studies of podiatry and pharmacy programs were all excluded.
Study identification
A research librarian (A.S.) designed a search strategy (Appendix 1) to search MEDLINE, EMBASE, CINAHL, EMBASE, PsychExtra, and ERIC databases, and from hand search of reference lists of identified publications for synonyms of resident physicians (e.g. medical resident, Graduate Medical Education) and scholarly activity (e.g. publishing, authorship, scholarly activity, journal article). No beginning date was selected, and the search was last performed December 17, 2015. Additional studies were sought from hand searches of authors’ reference lists.
Study selection
Two authors (A.D., R.Z.) independently screened all titles and abstracts for inclusion. In the event of a disagreement or insufficient information in the abstract, the full text was reviewed independently and in duplicate. Conflicts were resolved by consensus and a third reviewer (R.A.). The full protocol can be accessed at http://readinghospital.libguides.com/ld.php?content_id=20513770.
Data extraction
A data extraction table was developed by iterative testing. Data were extracted independently by two authors in duplicate for all variables and conflicts resolved by consensus. The authors abstracted information on type of residency program, number of publications, and years of study. Interventions were coded for analysis into the following 11 categories, and unadjusted intra-class correlation coefficients (ICC) were calculated. Categories were: research director (ICC, 0.91) protected time (ICC, 1.0), research requirement (ICC, 0.86), research mentor (0.71), research curriculum (0.86), research assistant (ICC, 0.85), biostatistics support (ICC, 0.85), information technology support (ICC, 0.86), research funds (ICC, 0.91), pay-for-performance (ICC, 0.88), and research symposium (ICC, 0.95). Risk of bias was independently assessed by two authors using tools developed by the Cochrane Collaboration (ACROBAT-NRSI) [21]. Risks of bias were categorized as due to confounding (ICC, 1.0), selection (ICC, 1.0), measurement (ICC, 0.98), departure from intended interventions (ICC, 0.95), missing data (ICC, 0.99), measurement of outcomes (ICC, 0.94), bias in selection of reported outcomes (ICC, 0.96), and overall risk (ICC, 0.91) as compared to an ideal randomized controlled trial, and were judged to be low, moderate, serious or critical risk.
Data synthesis
No studies were performed using randomized, controlled designs; therefore no meta-analysis was performed. Chi-square (χ2) analyses were performed to compare frequency of interventions between the top ten programs (the 10 programs with the highest rates of publications/year) and all other programs in the study. Effectiveness of individual interventions was analyzed by comparing means of primary outcome among programs with or without that intervention by Mann-Whitney U tests (since data were non-parametric). Pearson correlations were taken to measure the primary outcome against total number of interventions, total curricular hours and total protected research time respectively. SPSS software, version 17.0 (Chicago, IL) was used for analyses.
Results
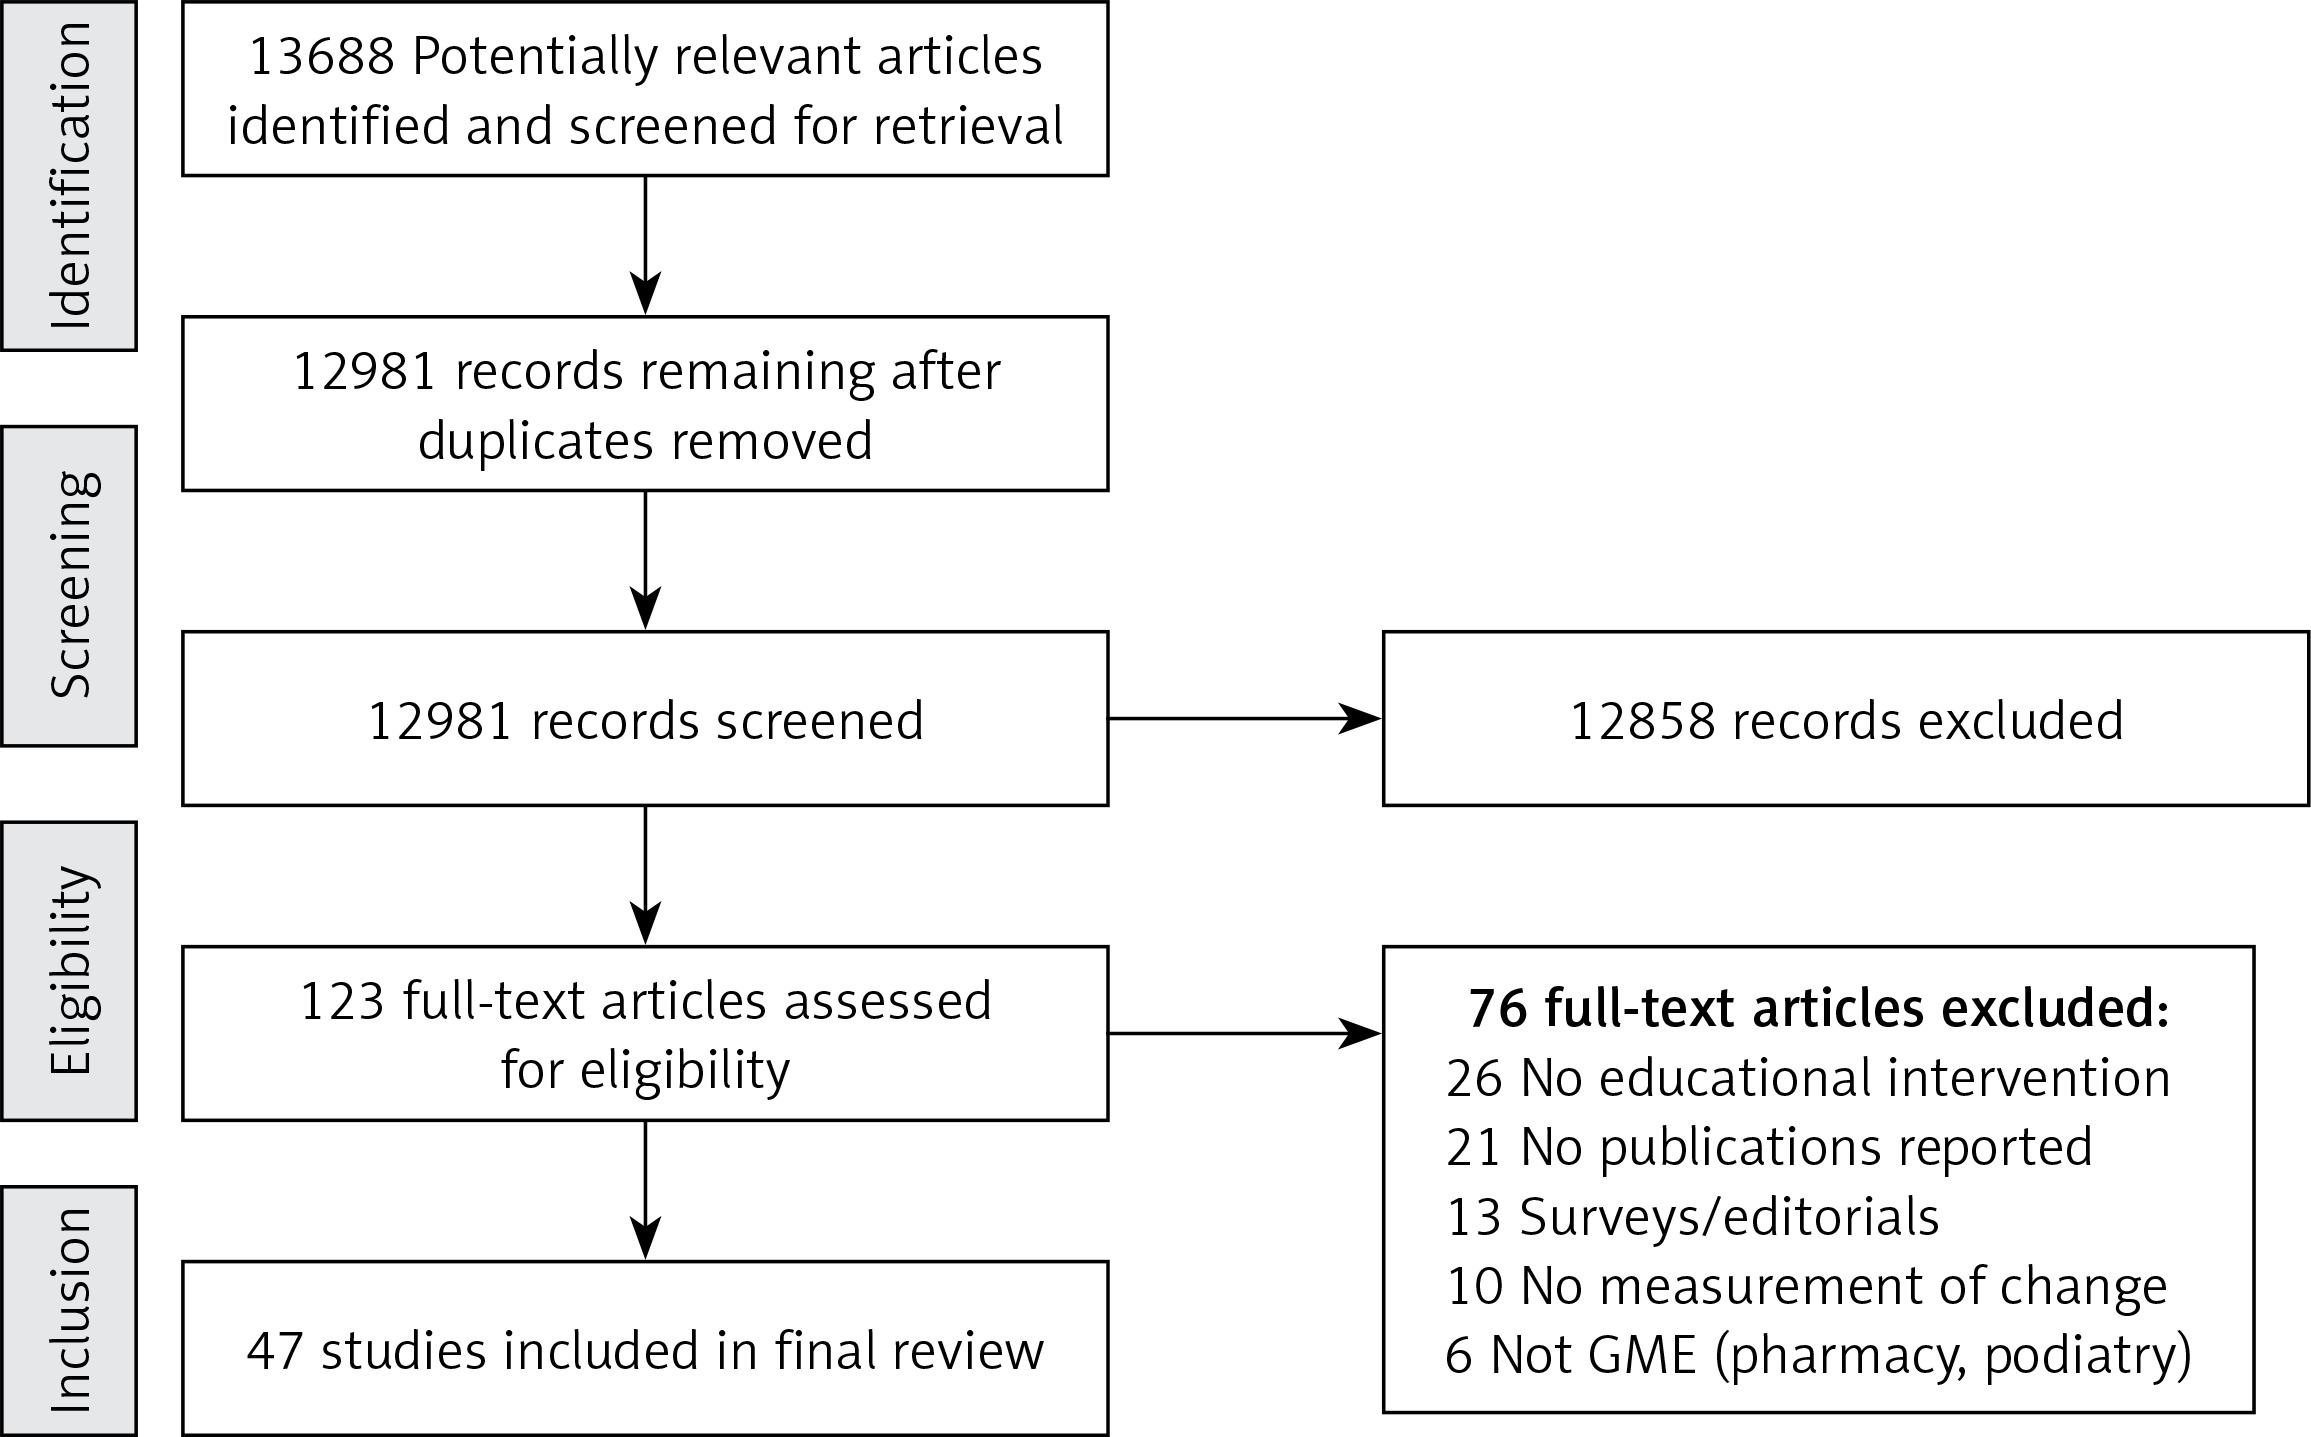
We identified 13,688 potentially relevant articles from our initial search, of which 707 were found to be duplicates. From these, we found 123 records requiring full-text review. Thirteen authors were contacted for more information, with 9 responding. Forty-seven articles were included in our final synthesis (Figure 1). Interventions were studied over an average of 5.9 years (range: 1–19) (Table I). Internal Medicine was the most common residency specialty (n = 14), followed by Family Medicine (n = 7) and General Surgery (n = 6) (Table I). Publication effectiveness ranged from 0 to 68.1 publications/year.
Table I
Records arranged in descending order by most to fewest publications per year
[i] GME – Graduate Medical Education, Res – Resident; #Pub – total number of publications, RD – Research Director, Prot. time – Protected Time, Req – Research Requirement, Ment – Research Mentor, Curr – Curriculum, RA – Research Assistant, BS – Biostatistical Support, IT – Information Technology Support, Fund – Research Fund Available, P4P – Pay for Performance Fund, Cele – Celebrate Accomplishments, FM – Family Medicine, IM – Internal Medicine, Anes – Anesthesia, Peds – Pediatrics, GS – General Surgery, GI – Gastrointestinal Disease Fellowship, ER – Emergency Medicine, Psy – Psychiatry, ENT – Otorhinolaryngology, Neur – Neurology, Orth – Orthopedic Surgery, OB – Obstetrics and Gynecology. *Calculated protected work days per year, assuming 8 h per work day, 40 h per work week, 20 work days per block or month, and 50 work weeks per year.
Research director
Eighteen records described appointing a research director (RD). Four programs described protected time for the RD, which ranged from 0.1 to 0.25 full-time equivalents (FTE). Of the 18 programs, ten appointed the RD from within the faculty, five hired from outside the faculty (four Ph.D. scientists, one postdoctoral associate) [22–26], two appointed a resident as the RD [27, 28], and one could not be determined. The RD duties included approval and oversight of research projects, granting elective time to trainees, editing abstracts and manuscripts, and assisting with Internal Review Board (IRB) submissions and grant applications.
Protected time
Twenty-four records described protected time for resident research. Allotted time varied from 0.5 to 76.25 work days per year (mean: 25.8 days), assuming 8 h per work day, 40 h per work week, 20 work days per block or month, and 50 work weeks per year. Of the records that described allocation of days, fourteen programs did so in consecutive days or block format [13, 27, 29–40], while six programs intermixed research time into clinical time throughout the year [41–46]. Six programs provided protected time contingent on the approval of a research proposal [27, 36, 39, 46–48]. A non-significant correlation was seen between amount of time granted and primary outcome (r = 0.18, p = 0.39).
Research requirement
Thirty records described a research requirement for residents, and of them 11 tied this requirement to graduation [13, 25, 29, 31, 34, 40, 46, 49–52]. Three programs described creation of a scoring system for measurement of completion of required scholarly activity [29, 49, 51]. Most interventions with a stated research requirement stipulated that residents at least present a poster or abstract at a departmental research day or scientific meeting (which were not captured in this study’s primary outcome), while 4 required submission of a manuscript to a peer-reviewed journal [25, 31, 34, 52]. One study from the Royal Thai College of Obstetricians and Gynecologists required all trainees in the country to submit a publication to a peer reviewed journal in order to complete training [52].
Research mentor
Thirty records described appointing research mentors. Six programs appointed mentors based on research expertise [35, 40, 41, 46, 53, 54]. Most programs assigned the mentor to the resident, while five programs required the resident to choose a mentor [35, 40, 50, 55, 56]. The resident-mentor relationship and reporting structure were generally not described. Two programs required at-least-monthly meetings of the resident and mentor [41, 42]. One record described a financial incentive for faculty based on effective mentorship [57].
Curricula
Thirty records described research curricula. Of those described, the allotted didactic teaching time of research-related topics varied from 7.5 to 75 hours per year (average: 23 h). When described, the most commonly taught topics, in descending order of frequency, were research methods (n = 14), scientific writing (n = 7), and biostatistics (n = 6). Other taught topics included literature searching, IRB structure, and research ethics. Four programs redesigned a regularly occurring journal club to focus on critical appraisal of the literature [23, 29, 31, 55, 57].
Research assistant
Eight records described the addition of a research assistant. Four of them utilized a research assistant to assist with completion and submission of abstracts, manuscripts, grant applications, and IRB submissions [35, 57–59]. Two programs utilized a registered nurse to obtain informed consent for studies and provided continuity among resident research studies [23, 36].
Biostatistician
Six records described the availability of a biostatistician for resident research initiatives. Three records provided funding through the department [29, 40, 44], and two through university affiliation [41, 48].
IT support
Three records identified the use of information technology support. Specific details of these interventions were not well described. One program invested in an information technology program that included a simulation laboratory to develop surgical techniques and to complete anatomical research [35].
Research fund availability
Seventeen records described the availability of a research fund for residents. Six programs described internal funding and program-sponsored grants to support research-related expenses [23, 31, 35, 44, 56, 57], and one obtained NIH R25 grant funding [46]. Thirteen described funds to cover travel expenses for residents to present findings at national meetings [23, 27, 31, 32, 35, 41, 44, 47, 48, 50, 56–58].
Pay-for-performance incentives
Three records described pay-for-performance incentives. Two described incentive pay based on production of any scholarly activity [29, 30], and one placed discretionary funds at risk pending compliance with a research requirement [54].
Celebration of accomplishments
Seventeen records described celebration of research accomplishments. Thirteen programs described an annual resident research day or grand rounds to present research findings [13, 24, 27, 39, 40, 45, 50, 57–62]. Ten programs awarded top performers in research, either by judging presentations or singular recognition for year-long efforts [13, 23, 27, 31, 39, 40, 45, 55, 59, 60]. Three programs displayed research publically, by displaying in the department [29], announcing in a newsletter [28], or listing on the resident website [62]. Three programs participated in regional research symposia [31, 39, 58].
Comparison of effectiveness of interventions
There was no significant difference in mean primary outcome for any single intervention (Table II). Total number of interventions was not significantly associated with primary outcome (r = 0.20, p = 0.18). When comparing top ten programs to the others, the presence of a research director was statistically more likely when compared to the others (70% vs. 30%, p = 0.02), while a defined curriculum was more common but not statistically significant (90% vs. 57%, p = 0.052) (Table III). No other single intervention was significantly more present in the top ten programs when compared to the others.
Table II
Relationship between individual interventions and primary outcome (publications/year)
Table III
Comparison of top ten publishing programs to other published programs
Risk of bias assessment
Studies were retrospective cohort studies that nearly uniformly were not able to control for prior resident research skills or the degree and depth of exposure to individual interventions. These limitations made overall risk of bias (as compared to a randomized controlled trial) to be at least serious for all records. Eleven were judged to be at critical risk for bias, often due to methods of collecting and reporting publication outcomes. No sensitivity analyses were performed as the studies were of similar quality levels.
Discussion
Our study identified scholarly activity interventions across a wide range of graduate medical education programs. We identified curricular interventions, mentoring programs and research requirements as the most common interventions described. We identified that appointment of a research director to lead research efforts and development of a formal curriculum appeared to be factors that were more prevalent in the most successful programs, confirming calls from prior authors for emphasis on these leadership elements [14, 15, 17]. A recent systematic review found that research tracks, protected time, research directors, and curriculum had a positive effect on scholarly activity. However, these authors included cross-sectional studies (which we excluded, since effects of interventions could not be followed over time). Those authors also defined their scholarly activity outcomes more broadly than we did, by including any participation in research (including abstracts) as a positive finding [63]. As our intent was to deliberately compare effectiveness among interventions, we limited our scope to records that explicitly defined their publication effectiveness. Similar to their work, we were unable to isolate the effect of any single intervention as nearly all studies used concurrent interventions that may have confounded their effectiveness.
As few of the programmatic interventions we characterized contained control groups other than historical controls, the interventions were likely confounded by the prior research skills of the participating residents, the interest and quality of the faculty, and the quality of the curricular instruction. Absolute differences in publication rates before and after interventions may have also been helpful to ascertain the impacts of interventions, but very few records included pre-intervention data, so historical comparisons across programs were not possible. Most interventions were multi-modal, so the independent impact of any one intervention was difficult to independently ascertain. Because we were not able to control for either program size or number of exposed residents, interventions in larger programs may have appeared more efficacious than those in smaller programs, even if similar in quality; larger programs may also have had more resources to create more interventions to stimulate research, making program size an unmeasured confounder in interpretation of our results. The actual amount of individual resident exposure to curricula and mentoring at the level of the individual program was unquantified in most records. Publications could not be independently verified in our study, as we relied on what the authors reported; there is the potential for one publication with many authors to have been counted more than once in those publications, potentially inflating the impact of the interventions. Publication bias may have limited the number of records with interventions that were not successful in increasing publication rates. Given that interventions to increase publication rates take a long time to bear fruit, the timeframes of many of the studies may have been too short to ascertain the full benefits of their interventions.
In conclusion, an understanding of research methods is believed to be important to residents in training, for better patient care, lifelong learning and career satisfaction [2–5]. Training programs should regularly evaluate their effectiveness in teaching these skills. Leadership in research may be a key factor in improving resident research, as evidenced by the higher prevalence of research directors and defined curricula in top publishing programs. Publication effectiveness appears to be an important metric for programs to demonstrate effectiveness of teaching programs to the ACGME [19]. As interventions that work at one location may not work in another, tracking effectiveness of interventions using standard measures such as publication efficiency over time is important for both individual programs and the field of education in general, and should be tracked to advance this field of study.