
Introduction
Recently, esthetic medicine has been gaining momentum worldwide, inter alia due to the development of minimally invasive nonsurgical facial rejuvenation techniques. This stimulated research on novel algorithms to facilitate selection of an optimal treatment for a given patient. Specialists in esthetic medicine have already realized that as in other medical disciplines, also the outcomes in their patients are influenced not only by the skills and experience of the operator and availability of state-of-the-art medical devices, but also by some individually specific intrinsic factors related to the skin condition. To identify such factors, subjective, qualitative or semi-quantitative methods used previously for the evaluation of facial skin condition need to be replaced by a fully objective quantitative method. Aside from the qualification for esthetic treatment, such a method should also be suitable for the evaluation of its outcomes, since the time sequence of changes within facial tissues subjected to the rejuvenation procedures is mostly unknown, aside from sparse evidence from histological and cadaveric studies [1–6].
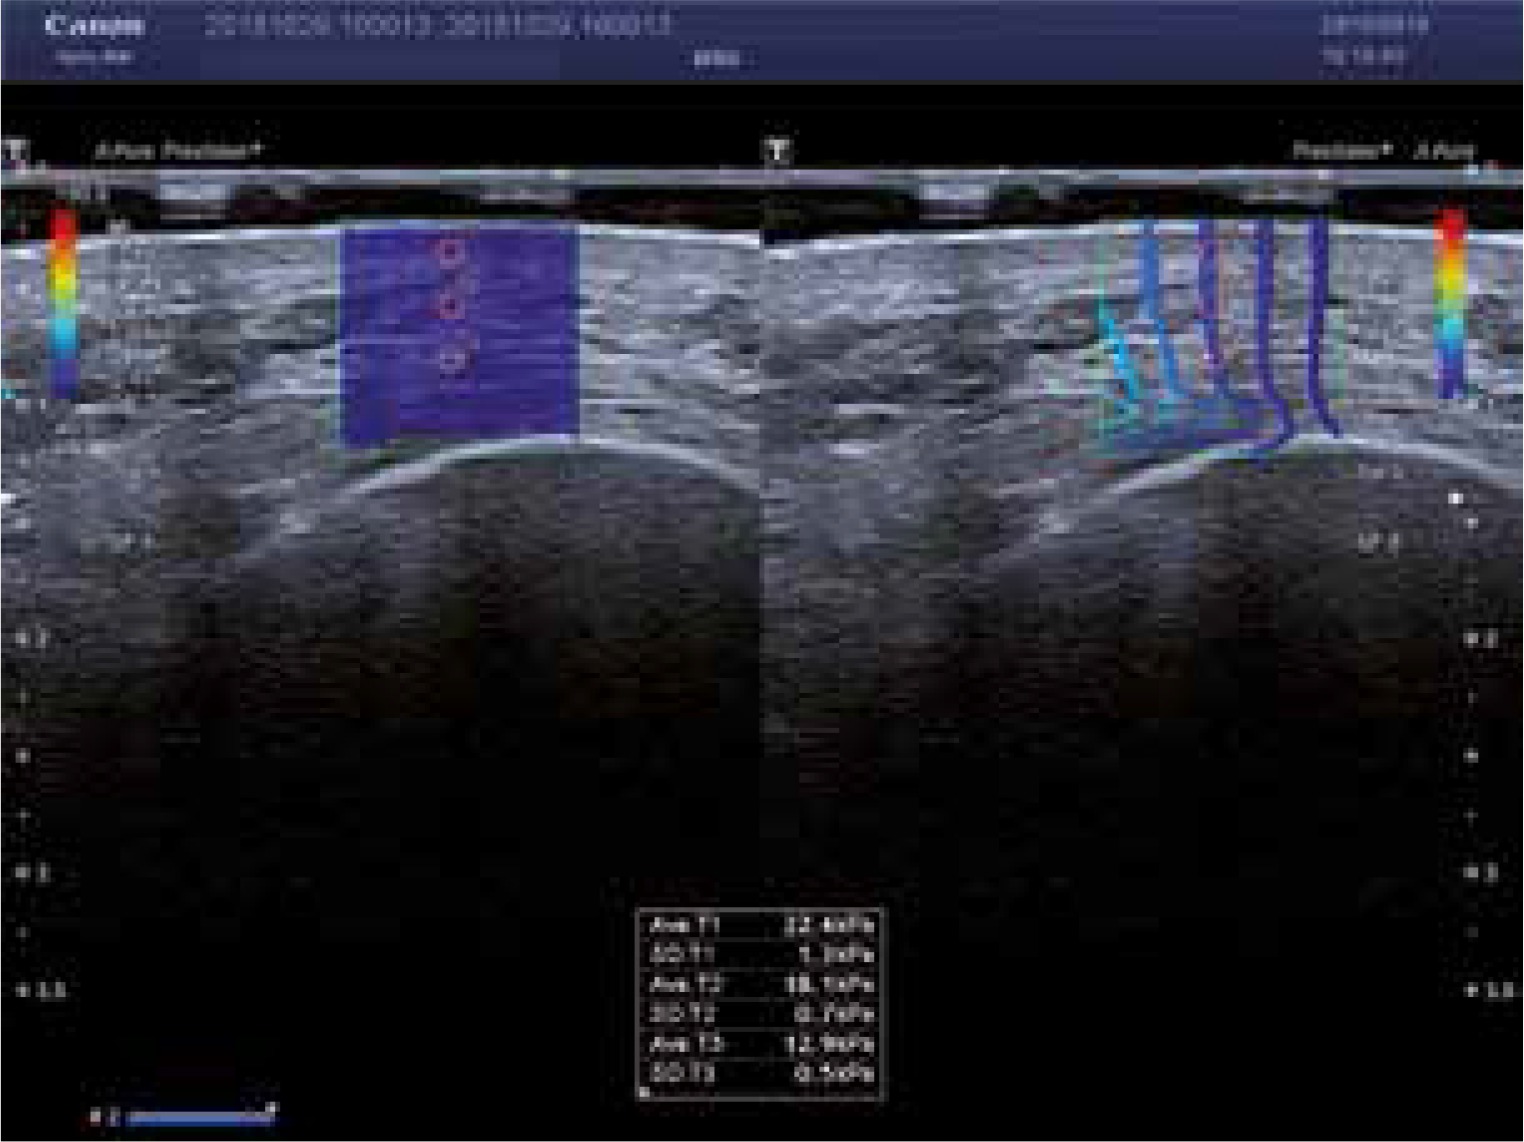
In our opinion, a potential candidate for an objective quantitative method to evaluate facial skin condition is elastography, a sonographic technique used to estimate tissue strain. Elastography, first implemented in clinical practice in the 1990s [7], measures the deformability of tissues caused by an external force, typically compression with an ultrasonographic transducer (strain elastography – SE), or the velocity of shear wave propagation within the tissue (shear wave elastography – SWE) (Figure 1). Depending on the method, the digitally transformed result of elastography is expressed as a semiquantitative (strain of the tissue of interest in relation to the strain of an adjacent reference tissue, in SE) or quantitative parameter (absolute tissue strain in kPa, in SWE) [8, 9]. Both published evidence [10] and our previous, still unpublished experience suggest that it is SWE which may provide more accurate estimates of facial skin elasticity.
Aim
Therefore, the aim of this study was to determine intra-rater reproducibility of SWE in the evaluation of facial skin in patients qualified for minimally invasive nonsurgical facial rejuvenation treatment.
Material and methods
The study, conducted in April 2017 at the University Department of Plastic Surgery and at a private plastic surgery and esthetic medicine clinic in Warsaw, included all consecutive female patients qualified for high-intensity focused ultrasound (HIFU) facial treatment (ULTRAFORMER III). Only patients aged at least 18 years at the time of enrollment were included in the study. Women with visible scars or other skin lesions on the face, present or past history of connective tissue diseases, other autoimmune disorders, diseases of the skin and subcutaneous tissue and/or peripheral blood vessels, allergy or atopy, surgery or trauma involving the face were non-eligible for the study.
The study procedures were carried out in accordance with the Declaration of Helsinki. The protocol of the study was approved by the Local Bioethics Committee at the Medical Center of Postgraduate Education in Warsaw, and written informed consent was sought from all the subjects.
Prior to the laser treatment, all participants were subjected to ultrasonographic examination and elastography of the skin in the right and left suborbital region and right and left cheek. Each region was examined separately, with the patient in a supine position. Sonographic scans were obtained with a Toshiba iAplio 900 ultrasonograph with a 5–18 MHz transducer. During examination, the face was covered with a hydrogel pad and a thick layer of gel. The transducer was placed perpendicularly to the skin, and transverse scans were obtained. Upon visualization of the area of interest, the thickness of the dermis, subcutaneous tissue and superficial muscular aponeurotic system (SMAS) in millimeters was measured. Then, SWE was performed, after stabilizing the elastographic image. The region of interest (ROI) was placed in the center of the screen, to cover approximately 80% of the examined structure. Three measurements were taken for each ROI and the average result was recorded. Then, the measurement procedure was repeated twice by the same examiner (LP), so eventually three average values for each parameter were recorded. The reference value for the elasticity modulus was set at 100 kPa.
Statistical analysis
Normal distribution of the study variables was verified with the Shapiro-Wilk test, and their statistical characteristics were presented as arithmetic means and standard deviations (SDs). Intra-rater reproducibility of elastographic parameters was determined based on intraclass coefficient (ICC) values. Intergroup comparisons were carried out with Student’s t-test for independent variables and one-way ANOVA. All calculations were made with the Statistica 10 package (StatSoft, United States) with the threshold of statistical significance set at p ≤ 0.05.
Results
The study included 57 women between 40 and 67 years of age (mean: 51.5 ±7.3 years), among them 28 (49.1%) patients aged 50 years or younger and 29 (50.9%) older than 51 years. Mean body mass index (BMI) of the study participants was 25.1 ±3.5 kg/m2 (range: 19–34 kg/m2); the study group included 23 (40.3%) women with normal body weight (BMI < 25 kg/m2) and 34 (59.7%) with overweight (BMI ≥ 25 kg/m2).
Elastographic parameters of facial skin obtained during three consecutive measurements are presented in Table 1, along with their ICC values. Intra-observer reproducibility for all measurements exceeded 0.9, with the ICC values for specific regions and layers varying between 90% (dermis in the right suborbital region) and 97.5% (SMAS of the right cheek). The ICC values for 9 out of 12 parameters exceeded 0.95. Aside from the dermis in the right suborbital region, at least 0.95 intra-rater reproducibility was not achieved for the dermis (ICC = 0.948) and subcutaneous tissue (ICC = 0.925) of the left cheek.
Table 1
Statistical characteristics of ultrasonographically measured thickness of various skin layers and their elastographic parameters determined on three consecutive measurements, along with ICC values for intra-observer reproducibility
No statistically significant differences were found in ICC values for elastographic parameters of the skin on the right and left side of the face (0.953 ±0.001 vs. 0.953 ±0.001, p = 0.992), and in the suborbital regions and cheeks (0.952 ±0.001 vs. 0.954 ±0.001, p = 0.944). Moreover, no significant differences were observed in the ICC values for the SWE parameters of various skin layers: dermis, subcutaneous tissue and SMAS (0.945 ±0.001 vs. 0.953 ±.001 vs. 0.961 ±0.001, p = 0.597).
When the study subjects were stratified according to their age (up to 50 years and older), younger women presented with significantly higher values of elastographic parameters for all examined regions, except for the dermis and SMAS of the left cheek (Table 2). Despite this, no statistically significant differences were observed in the ICC values for younger and older women (0.945 ±0.01 vs. 0.935 ±0.001, p = 0.340).
Table 2
Statistical characteristics of elastographic parameters of various skin layers determined in three consecutive measurements, separately for women aged ≤ 50 years and older, along with ICC values for intra-observer reproducibility and p-values for intergroup comparisons
Women with normal body weight and overweight did not differ significantly in terms of their elastographic parameters of facial skin. (Table 3) However, comparative analysis of ICC values for these two groups demonstrated nearly significantly higher intra-observer reproducibility of the elastographic parameters in women with normal body weight (0.968 ±0.001 vs. 0.942 ±0.001, p = 0.069).
Table 3
Statistical characteristics of elastographic parameters of various skin layers determined in three consecutive measurements, separately for women with BMI < 25 kg/m2 and ≥ 25 kg/m2, along with ICC values for intra-observer reproducibility and p-values for intergroup comparisons
Discussion
Theoretically, as a soft tissue, skin constitutes a perfect candidate for elastographic examination. However, in practical terms, determination of skin strain by means of elastography faces numerous challenges. First, owing to the close proximity of the ultrasonographic transducer to the skin during the examination [11], the signal from deeper lying tissues may override the signal of skin detection. This applies in particular to the underlying tissues with higher values of Young’s modulus, such as muscles and bones [12]. Their close proximity to the skin may result in a decrease in signal-to-noise ratio and lower reproducibility of elastographic parameters. Recently, also the thickness of subcutaneous fat has been identified as a significant contributor to lower repeatability and reproducibility of elastographic measurements [13]. Other factors that may potentially contribute to lower accuracy of elastographic measurements include low thickness of the skin, its multilayered structure and variable orientation of collagen fibers [11, 14–16]. Skin, with an average thickness of only 1 mm, is composed of three layers with different elasticity: epidermis, dermis and subcutaneous tissue. The low thickness and considerable structural heterogeneity of the skin may significantly hinder selection of a representative ROI for elastographic examination [13, 17]. Some of the abovementioned limitations had been already overcome due to the use of high-frequency ultrasonographic transducers suitable for the examination of superficially located ROIs with small diameters [10, 18, 19]. However, aside from a few studies involving healthy volunteers and patients with various systemic or local conditions [10, 13, 15, 20], little is known about the intra- and inter-observer reproducibility of SWE parameters for the skin, and to the best of our knowledge, this problem has never been addressed with regards to facial elastography.
This study showed that elastographic parameters of the skin in all examined anatomical areas were highly reproducible, with ICC values for intra-observer reproducibility of at least 0.9. Previous studies demonstrated that SWE provides highly reproducible results for soft tissues with high values of noise-to-signal ratio (for review, see: [8]). Based on those data it was suggested that also elastographic parameters of the skin should be highly reliable [11]. Nevertheless, the number of published studies analyzing elastographic parameters of normal skin is limited, and available data on the reproducibility of SWE measurements in this tissue are even more sparse. Xiang et al. used SWE to determine the elasticity of finger, forearm, chest (sternum) and abdomen skin in 40 healthy volunteers. Intra-observer reproducibility for all the measurements, expressed as ICC, amounted to 0.885, with region-specific values varying from 0.665 and 0.677 for forearm and abdomen skin, to 0.853 and 0.914 for longitudinal and transverse cross-sections of finger skin [10]. Sun et al. determined intra-observer reproducibility for SWE parameters of the skin in the abdomen and anterior and lateral tibia region in 30 healthy volunteers; the ICC values obtained in that study ranged between 0.20 and 0.98. Another source of information about the reliability of SWE in the evaluation of skin elasticity originates from a study of 14 patients with post-irradiation neck fibrosis and 16 controls, conducted by Liu et al. Intra-observer reproducibility for this group, determined as ICC, was in the range 0.84–0.95.
As shown above, published data about the intra-observer reproducibility of elastographic measurements of the skin vary considerably, and the ICC values for SWE parameters seem to be to a large degree region-specific. However, even the ICC values for the skin in the same anatomical region may differ substantially. For example, Xiang et al. and Sun et al. reported completely different ICCs for the elastographic parameters of the abdomen skin, 0.677 and 0.98, respectively. According to Sun et al., high intra-observer reproducibility of elastographic parameters for the abdomen skin documented in their study might be associated with greater thickness of subcutaneous adipose tissue in that region. In their opinion, the thicker layer of relatively homogeneous and isotropic adipose tissue may provide a better signal-to-noise ratio, a key parameter determining the reliability of elastographic measurements. Based on the analysis of reproducibility for the SWE measurements of the tibial region skin, Sun et al. even suggested that elastographic parameters of the skin can be considered reliable only if the subcutaneous tissue layer is 3 mm or thicker. However, those findings are in opposition to the results published by Xiang et al., who reported higher intra-observer reproducibility for elastographic parameters of the skin in anatomical regions with less subcutaneous tissue, e.g. fingers. Also in our study, the intra-observer reproducibility for elastographic parameters of facial skin was excellent although the thickness of subcutaneous tissue rarely exceeded 3 mm. Since to the best of our knowledge the reliability of elastographic parameters of normal skin has been the subject of only two previous [10, 13], and apart from the abdomen their authors examined different anatomical regions, finding a reason behind the abovementioned discrepancies can be challenging. Nevertheless, the high ICC values obtained in our study might result from the approach to skin elastography which is routinely used in our center. Using a high-frequency transducer and a hydrogel pad to reduce the diameter of ROI, we are able to prevent the signal from deeper lying tissues with higher values of Young modulus, such as muscles and bones, to override the signal of skin detection, which probably contributed to higher reproducibility of the measurements.
In this study, higher values of elastographic parameters were obtained in younger women, under 50 years of age. Previous studies demonstrated unequivocally that aging is associated with a significant decrease in skin elasticity due to alteration of the collagen network [10]. This unfavorable effect of aging can be either determined with elastography or examined with other methods [16, 21].
Another factor tested in this study as a potential determinant of facial skin elasticity was body weight, expressed by BMI. Based on the results of previous studies, we assumed that women with overweight may have lower elasticity of facial skin. According to some authors, larger adipocyte content in overweight persons may contribute to irreversible damage of collagen and elastic fibers [22–24]. However, we did not find statistically significant differences in the elastographic parameters of facial skin in women with BMI values < 25 kg/m2 and higher. Perhaps statistically significant differences in skin elasticity could be observed in anatomical regions which are more predisposed to the accumulation of subcutaneous adipose tissue, such as the abdomen, buttocks and hips. Moreover, it needs to be stressed that the vast majority of our patients with BMI ≥ 25 kg/m2 were overweight, and only four women from this group had BMI ≥ 30 kg/m2. It cannot be excluded that the effect of BMI on facial skin elasticity, if any, can be demonstrated solely in persons with severe obesity.
We also verified whether factors with an established effect on skin elasticity had an influence on the intra-rater reproducibility of SWE parameters. Indeed, we found nearly significantly higher reproducibility of the elastographic parameters in women with normal body weight. In contrast, no statistically significant differences were observed in the ICC values for younger and older women. Aside from the role of signal-to-noise ratio, we know virtually nothing about other factors determining the reproducibility of SWE measurements. We did not find statistically significant differences in the intra-observer reproducibility of elastographic parameters in younger and older women, who also varied considerably in terms of their facial skin elasticity. We found non-significantly higher ICC values in women with normal body weight, although their elastographic parameters were essentially the same as in overweight subjects. Perhaps these discrepancies can be explained by the considerable heterogeneity of our study group in terms of age and BMI. Due to such heterogeneity and the relatively small size of our sample, we were unable to conduct a multivariate analysis and to determine whether any of the abovementioned factors truly exerted an effect on the reproducibility of elastographic parameters. Nevertheless, the high ICC values obtained on the subgroup analysis imply that regardless of patient’s age and body weight, the intra-observer reproducibility of elastographic parameters for facial skin is high.
The principal limitation of this study stems from the fact that all elastographic measurements were taken by the same examiner. Therefore, we were unable to estimate another reliability measure of the SWE parameters, their inter-rater reproducibility. However, the results of previous studies suggest that the inter-rater reproducibility of SWE parameters for the skin in most anatomical regions is relatively high. In the previously mentioned study of healthy volunteers conducted by Sun et al., the ICC values for 9 out of 13 examined parameters ranged between 0.75 and 0.98. Equally high (0.618–0.908) were the ICC values for inter-observer reproducibility in another study of healthy volunteers performed by Xiang et al.


