Introduction
The intravoxel incoherent motion (IVIM) diffusion-weighted (DW) model as a possible imaging technique, using multiple b values and bi-exponential fitting for the concurrent estimation of the pure molecular water diffusion and microcirculation of blood water in randomly oriented capillaries (perfusion) was first introduced in the late 1980s by Le Bihan et al. [1]. The idea to use diffusion and IVIM magnetic resonance imaging (MRI) to acquire perfusion parameter maps was considered revolutionary but technically difficult, and, as a result, it was more than 20 years before the method started being used in clinical practice [2]. IVIM reflects the random microscopic motion of water molecules that occurs in each voxel on MR images not only in intra- or extracellular space but also in microcirculation of blood [3]. According to IVIM theory, diffusion and perfusion are affected by several tissue characteristics, including the presence of restrictive barriers within tissue, the viscosity of the fluid in which the spins are diffusing, and the velocity and fractional volume of perfusing spins [4]. Formerly, due to degradation of images caused by cardiac, respiratory, and other motion artifacts, IVIM imaging was restricted to neuroradiologic applications. Nowadays, it is pursued to apply IVIM MRI to evaluate almost entire human body. Over the last few years there has been a revival of interest in IVIM MRI and its applications in many fields, particularly in oncology [2].
Basic principles and acquisition of intravoxel incoherent motion perfusion magnetic resonance imaging
DW magnetic resonance imaging is based on the random movement of individual water protons, called Brownian motion. The Brownian motion can be described by a series of molecular jumps [5].
According to Einstein’s equation the diffusion coefficient D depends on the averages of individual displacements between two collisions and the mean molecular velocity. In the presence of a magnetic field, random displacement of individual molecules between two gradient pulses results in signal attenuation. Initially, the signal attenuation increase was described by a monoexponential function:
where: S is the measured signal intensity, S0 is the signal intensity without the influence of diffusion, D (mm2/s) is the diffusion coefficient of water, and the b value (s/mm2) can be calculated as follows: γ – gyromagnetic ratio (MHz/T), G – amplitude of the two diffusion gradient pulses (mT/m), δ – duration of the pulses (ms), Δ – time between the two pulses (ms) [1].
The assumptions of the IVIM model, described for the first time by Le Bihan et al. in the late 1980s, are based on the translation movements at voxel levels. Microcirculation of the blood in the capillary network would mimic a pseudo-diffusion process [1]. The IVIM effect appears at low b values (i.e. b ≤ 200 s/mm2) as a deviation of tissue diffusion signal decay (Figure 1). Because the pseudo-diffusion coefficient (D*) is one order of magnitude higher than the diffusion coefficient D, the exponential decay with the pseudo-diffusion coefficient disappears faster. At low b-values, the perfusion effect predominantly contributes to the overall diffusion signal. At higher values of b, the exponential input with D modifies the signal. MRI signal attenuation is the sum of the tissue and blood component, taking the shape of biexponential decay:
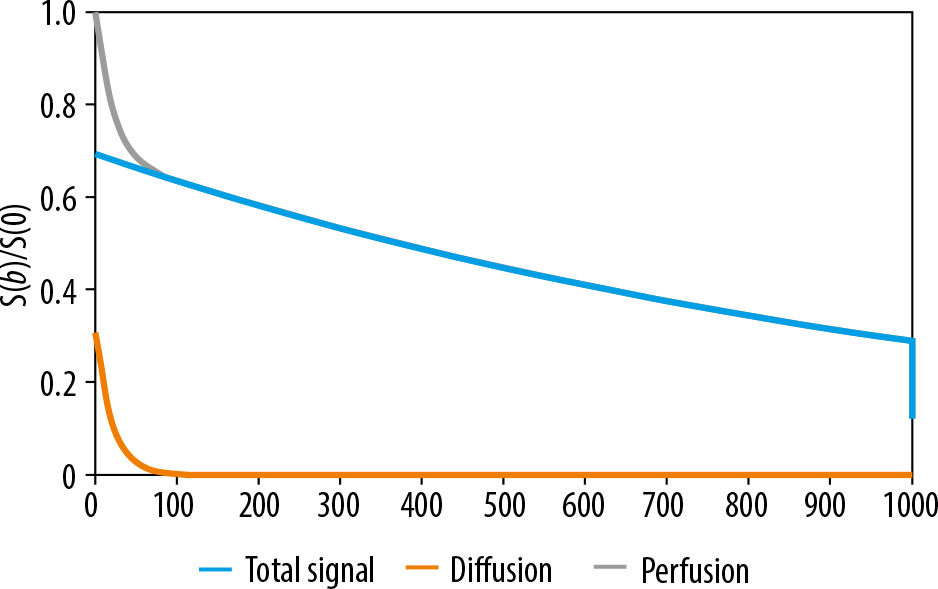
where: S – the signal intensity in the pixel with diffusion gradient b, S0 – the signal intensity in the pixel without diffusion gradient, D – the true diffusion as reflected by pure molecular diffusion (mm2/s), f – the fractional perfusion related to microcirculation, and D* – pseudo-diffusion coefficient representing perfusion related diffusion or incoherent microcirculation (mm2/s). D* is sometimes referred to as ADCfast, while D may be also called ADCslow.
The IVIM sequence consists of several scans: the first without the use of a coding gradient, the next with different values of the amplitude and duration of the gradient (different b-values). An important part of the IVIM acquisition protocol is the choice of b-values (in terms of their number and distribution), resulting in a different degree of diffusion weighting in the acquired images. The b-values used in IVIM imaging are usually in the range of 0-900 s/mm2. The number of b-values ranges from 4 to 16. Number of b-values in the range of 0-200 s/mm2, where the perfusion effect is dominant, is between 2 and 12 (Table 1).
Table 1
The b-value used in clinical trials
| Paper | Year | b-values (s/mm2) | Number of b-values |
|---|---|---|---|
| Guo [9] | 2016 | 0, 10, 20, 30, 50, 70, 100, 150, 200, 400, 800, 1000 | 12 |
| Liu [10] | 2013 | 0, 10, 20, 30, 50, 70, 100, 150, 200, 400, 800, 1000 | 12 |
| Ichikawa [11] | 2013 | 0, 10, 20, 30, 40, 50, 80, 100, 200, 400, 800, 1000 | 8 |
| Rheinheimer [12] | 2012 | [0; 50], [0; 100], [0; 150], [0; 200], [0; 300], [0; 400], [0; 600]; [0; 800] | 8 |
| Cui [13] | 2015 | 16 b-values from 0 to 800 | 16 |
| Dyvorne [14] | 2013 | 0, 15, 30, 45, 60, 75, 90, 105, 120, 135, 150, 175, 200, 400, 600, 800 | 16 |
| Federau [15] | 2014 | 0, 20, 40, 80, 110, 140, 170, 200, 300, 400, 500, 600, 700, 800, 900 | 15 |
| Federau [16] | 2014 | 0, 10, 20, 40, 80, 110, 140, 170, 200, 300, 400, 500, 600, 700, 800, 900 | 16 |
| Döpfert [17] | 2011 | 0, 50, 500, 800 | |
| Kakite [18] | 2016 | 0, 15, 30, 45, 60, 75, 90, 105, 120, 135, 150, 175, 200, 400, 600, 800 | 16 |
| Shim [19] | 2015 | 0, 10, 20, 40, 60, 80, 100, 120, 140, 160, 180, 200, 300, 500, 700, 900 | 16 |
| Conklin [20] | 2016 | 0, 10, 20, 40, 80, 110, 140, 170, 200, 300, 400, 500, 600, 700, 800, 900 | 16 |
| Federau [21] | 2016 | 0, 10, 20, 40, 80, 110, 140, 170, 200, 300, 400, 500, 600, 700, 800, 900 | 16 |
| Xu [22] | 2016 | 0, 10, 20, 30, 40, 50, 60, 70, 80, 90, 100, 200, 400, 800 | 14 |
| Boss [23] | 2016 | 0, 10, 30, 60, 120, 200, 300, 430, 600, 800 | 10 |
| Valerio [24] | 2016 | 0, 10, 20, 30, 40, 50, 80, 100, 200, 400, 800 | 11 |
| Pang [25] | 2013 | 0, 188, 375, 563, 750 | 5 |
| Bane [26] | 2016 | 0, 15, 30, 45, 60, 75, 90, 105, 120, 135, 150, 175, 200, 400, 600, 800 | 16 |
There are, however, several important limitations that have so far prevented the use of IVIM in routine practice. The most important is the lack of a uniform data analysis method, which is particularly important because IVIM imaging is based on the quantitative analysis of f,D, and D* parameters [1,5,6].
Le Bihan proposed acquisition with only three values of b that are theoretically sufficient to obtain IVIM results. However, more points are needed, especially for the brain due to “noise contamination” [5]. For accurately estimating IVIM parameters at least 10 of the optimal distributed b-values should be used [7].
In addition, IVIM parameters, similarly to ADC values, are possibly field-strength dependent (1.5T vs. 3.0T) [8].
Strengths and limitations of intravoxel incoherent motion magnetic resonance imaging
Understanding of the strengths and limitations of IVIM concept may help to appreciate a clinical benefit of this method (Table 2).
Table 2
Advantages and disadvantages of intravoxel incoherent motion (IVIM) magnetic resonance imaging
The most important advantage of IVIM diffusion MR imaging is that as a non-contrast perfusion imaging modality it can be used in situations in which intravenous administration of contrast agents is not clinically justified, and it may serve as an interesting alternative to contrast-enhanced perfusion MR imaging in some patients with contraindications to contrast agents, such as severely compromised renal function. Furthermore, IVIM diffusion MR imaging does not involve ionising radiation or injection of radioisotopes.
The most important disadvantages include artifacts related to cardiac and respiratory motion, artifacts from other bulk flow phenomena, no standardisation of acquisition parameters, and various algorithms used for quantitative image analysis. Moreover, the sensitivity of IVIM MRI not only varies according to vessel size but also depends on the utilised number and distribution of applied b values. Thus, IVIM-derived parameters and maps are highly variable and inconsistent. Due to the lack of standardisation of the IVIM technique, significant variance in calculated parameters among studies has been observed and no values for normal organs have been established.
Clinical applications in oncology
Abdominal and pelvic organs
Liver
IVIM was applied to study liver diseases such as liver fibrosis, nonalcoholic liver fatty disease, and focal liver lesions and to estimate possible treatment response [3,30]. With IVIM DWI, Luciani et al. suggested that the diffusion component related to the molecular displacement (D) does not differ significantly between cirrhotic and healthy livers [27].
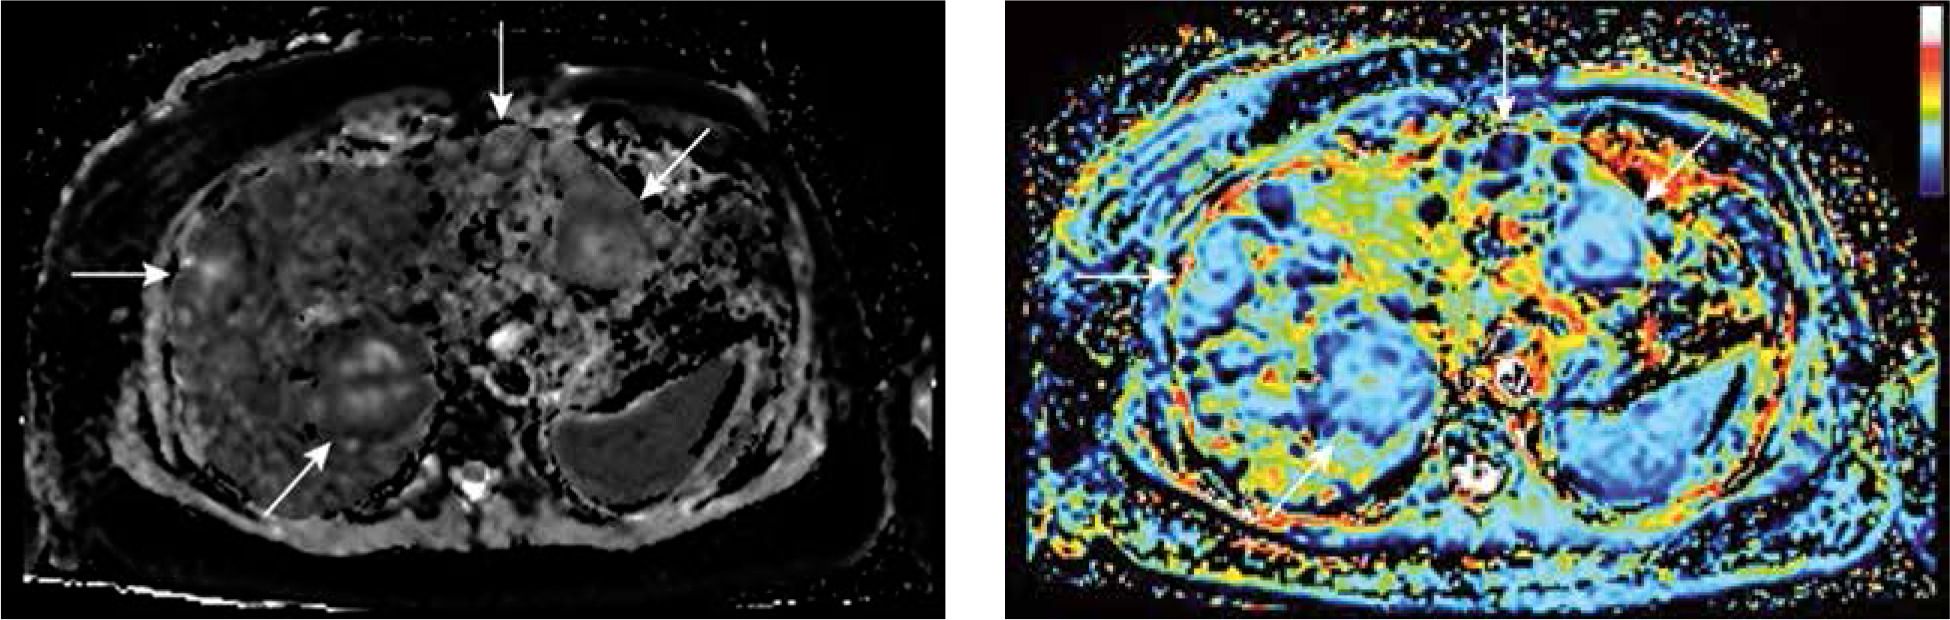
Yamada et al. found that D was significantly lower than ADC, thus suggesting that differences reported in ADC between patients with cirrhosis and healthy patients were mainly related to the perfusion component of liver diffusion. The fact that the pure molecular diffusion coefficient, D, was similar in both the healthy liver group and the cirrhotic liver group further indicates that changes in liver architecture may be of less importance than changes in liver perfusion [28] (Figure 2).
Figure 2
Sample quantitative maps of intravoxel incoherent motion (IVIM) parameters (D and f, respectively) created using own plugin for ImageJ software for breast cancer liver metastases (arrows). The increase in blood flow/volume occurring in liver metastases can be detected and mapped with IVIM magnetic resonance imaging
However, the large overlap of D,f, and D* for different stages of fibrosis suggests that this technique cannot be used to accurately characterise stages of liver fibrosis [27].
In a large number of studies the IVIM technique was used for the assessment of focal liver lesions. Liver nodules including hepatocellular carcinoma (HCC), haemangioma, focal nodular hyperplasias (FNH), and liver metastasis (MET) showed overlap in terms of IVIM parameters. However, other researchers, like Yamada et al., showed the potential of IVIM MRI to differentiate HCC from haemangiomas and cysts [28].
Summarising, IVIM MRI for assessing hepatic lesions imposes some difficulties, mainly due to the possible overlap between normal and diseased liver tissue, as well as between benign and malignant lesions [10].
Pancreas
IVIM imaging has recently gained interest as a method to properly recognise and characterise pancreatic lesions.
Perfusion-related IVIM-derived parameters seem especially auspicious for differentiation between normal pancreatic parenchyma and solid pancreatic lesions with high sensitivity and specificity [29].
According to Re et al. there is a compelling difference in the average IVIM perfusion fraction of pancreatic adenocarcinoma compared to healthy pancreatic tissue [31]. IVIM MRI emerges as a promising method for characterisation of pancreatic lesions and should therefore be further investigated.
Kidney
Over the past two decades, the number of properly diagnosed renal tumours has escalated due to increased utilisation of different imaging techniques. Unfortunately, preoperative classification of solid renal masses remains challenging and defective. In light of the above, in the past few years there have been attempts to use IVIM parameters to distinguish renal tumour subtypes. Chandarana et al. [32] established the differentiation of subtypes of renal cell carcinomas using perfusion fraction (f) and tissue diffusi-vity (D*). Interestingly, the authors demonstrated a significantly higher f and lower D* in enhancing renal masses compared with markedly and poorly enhancing renal masses, differentiating these two groups with a higher accuracy than standard ADC values [33]. The combination of f and D* allowed the diagnosis of papillary renal cell carcinoma (RCC) and cystic RCC with 100% accuracy, and clear cell RCC and chromophobe RCC with 86.5% accuracy. The f was shown to have a good correlation under the curve of gadolinium concentration at 60 seconds, which is a measure of the gadolinium concentration obtained from the area under the gadolinium-enhancement signal intensity (SI) curve over the first 60 seconds (CIAUC60) after intravenous injection of contrast, which potentially enable the assessment of tumour vascularity without the need for intravenous administration of gadolinium contrast agent [32,34].
According to Ding et al. [35] IVIM-derived parameters, especially the perfusion-related parameters (D* and f), showed greater diagnostic accuracy than that of ADC values in differentiating non-ccRCCs from lipid-poor AMLs.
Prostate
Recent studies have reflected an interest in multiparametric MR imaging including diffusion MRI in the detection, staging, and post-treatment follow-up of prostate cancer [36].
The results of published papers utilising the IVIM model are inconsistent in terms of prostate cancer detection, staging, and treatment response. According to some studies, the diagnostic value of this technique compared to ADC is rather indigent [17] whereas others report showed significant differences between the IVIM parameters of benign and malignant tissue [24].
Concluding, there is a visible fluctuation between IVIM parameters in cancer and normal prostatic within the literature [37], and there is still a need for validation in the application of IVIM in the diagnosis of prostate cancer.
Head and neck
Over the last two decades IVIM imaging became a very promising technique for differentiation of tumours of the head and neck area, due to distinctive f and D.
IVIM imaging has been successfully applied for differentiation not only between benign and malignant salivary gland lesions [38] but also for discrimination of other types of tumours in this region. The perfusion-related parameter values have been significantly different among different types of head and neck tumours, including squamous cell carcinoma, benign (pleomorphic adenomas, Warthin tumour) and malignant salivary gland tumours, lymphomas, and schwannomas [39].
Additionally, low pre-treatment D and f values favour good response to treatment, whereas an increase in D during treatment confirms good response to therapy [40]. However, the role of IVIM MRI in characterisation of lymph nodes remains controversial because IVIM parameters have been shown to be inappropriate for differentiation between metastatic and non-metastatic head and neck lymph nodes [41]. On the other hand, some studies indicate that IVIM DWI is feasible in the diagnosis of lymph node metastasis, which demonstrate decreased D (due to increased nuclear-to-cytoplasmic ratio) and increased D* (due to new blood vessel formation and increased parenchymal perfusion) [42].
Furthermore, pre-treatment and mid-treatment IVIM- DWI led to the conclusion that there is a potential for prediction of chemo-radiotherapy response of cervical lymph nodes in head and neck squamous cell carcinoma patients [43].
What is more, in patients with head and neck squamous cell carcinoma (HNSCC) due to locoregional failure, high initial f in lymph nodes may be considered as an indicator of poor treatment response [44].
IVIM MRI (perfusion-related coefficients) appears promising for noninvasive evaluation of early changes of irradiated major salivary glands during radiotherapy [45]. Moreover, it is reasonable and advantageous for predicting and assessing initial responses of human papilloma virus and oropharyngeal squamous cell carcinoma SCC to chemoradiotherapy [46].
Reported artifacts, specific for this area and related to the presence of bones and air-filled structures, are additional problem in the evaluation of the head and neck with MRI. Moreover, specific artifacts related to jaw movements, swallowing, speaking, coughing, and respiration might additionally degrade acquired images.
Breast
In recent years, with the improved MR hardware, a renewed interest in IVIM has been shown and the applications of IVIM to breast lesions have been reported [47].
According to some authors, IVIM has been recognised as a very promising method for the diagnosis of breast cancer [48,51,52].
Compared to DWI with monoexponential fit, IVIM provides separate quantitative measurement for cellularity and vascularity. IVIM can be used to differentiate benign and malignant lesions with high specificity. This method can increase the diagnostic sensitivity and might play a role in screening breast MRI in high-risk women [47].
What is more, quantification of perfusion fraction, tissue diffusivity, and pseudodiffusivity provides noninvasive sensitivity to microenvironment properties without need of contrast agent. These applications have the potential to improve the specificity of breast MRI.
According to Sigmund et al., further work in a larger patient population is needed to validate the ability of IVIM for the diagnosis, differentiation, monitoring, and management of cancerous lesions in the breast and verify its role as a possible surrogate marker of the biological properties of the tumour [49].
Other lymph nodes
Some recent studies have shown that particular IVIM parameters, such as the ADC and diffusion coefficient (D), are significantly different between patients with metastatic and non-metastatic lung cancer that has spread to the lymph nodes, therefore possibly facilitating discrimination of benign and malignant mediastinal lymph nodes [53].
Furthermore, an IVIM sequence may also be helpful in diagnosing metastatic lymph nodes of rectal carcinoma. According to Qui, average D and ADC values are more sensitive than f and D* values for this purpose [54]. As reported by Yu et al. in patients with rectal cancer, metastatic mesorectal lymph nodes exhibit lower D and D* values, compared to non-metastatic lymph nodes. The authors concluded that IVIM DWI may be helpful in identifying mesorectal nodal involvement in rectal cancer patients [55].
Clinical applications in neuroradiology
There is little doubt that IVIM imaging has potential for evaluation of brain ischaemia. Wirestam et al., who utilised IVIM for the assessment of the stroke by IVIM, reported that the perfusion fraction was reduced in areas affected by ischaemia in comparison to the respective contralateral region [56].
In acute stroke, a significant decrease in f was measured in the infarct core compared with the contralateral hemisphere in three independent studies [57-59].
Furthermore, it has been found that decreased IVIM perfusion fraction f and blood flow-related parameter D* might correspond with proximal artery vasospasm development after cerebral aneurysm rupture and delayed cerebral ischaemia [60].
What is more, IVIM may be a valid and favourable method for significant measurement of brain perfusion without intravenous administration of contrast material. According to some studies, IVIM perfusion parameters are highly reactive to hyperoxygenation-induced vasoconstriction and hypercapnia-induced vasodilatation [61].
Another study showed that IVIM can be used for the assessment of cerebral small vessel disease and its complications including lacunar stroke, leukoaraiosis, or even vascular dementia [62].
Brain tumours
The most common malignant brain tumours are gliomas, which originate from glial cells (astrocytes, oligodendrocytes and ependymocytes). Due to the high mortality rate, early diagnosis and correct assessment of the grade of a glioma are crucial for the planning of a therapeutic strategy and establishing a prognosis [62,63].
Researchers reported that both D* and f could be used to differentiate gliomas because these parameters were higher in high-grade gliomas (HGG; WHO: III-IV) in comparison to low-grade gliomas (LGG; WHO: I-II) [16,64]. In subsequent reports the authors concluded that IVIM-derived metrics characterising both perfusion (D*, f) and diffusion (D) have been assessed as promising imaging biomarkers in preoperative differentiation of glioma grades. The f times D* value demonstrated the best diagnostic performance in grading gliomas compared with other parameters and was the only parameter showing a significant difference between grade III and grade IV [65]. Additionally, according to some scientists IVIM metrics could be a potential biomarker for survival in patients with glioblastomas as it has been found out that f and D* measured in contrast-enhancing regions correlate well with response to therapy and survival [66].
It is also worth noticing that there are studies showing that IVIM may be used to differentiate between glioblastoma and primary central nervous system lymphoma (PCNSL) [19,67,68]. According to authors mean maximum f is significantly higher in the glioblastoma group than in the atypical primary central nervous system lymphoma that often mimics glioblastoma [67,68].
The most recent studies showed that the f-value can be used as a noninvasive quantitative imaging measure to directly assess the vascular volume fraction in brain tumours. Moreover, one study showed an obvious correlation with the histological vascular density in meningiomas [69].
Moreover, IVIM parameters have been used to monitor the tumours treated with antiangiogenic and vascular target agents that have been recently considered an alternative or complementary therapy to conventional cancer treatments [45,62,70-73].
According to some authors, IVIM may be used to differentiate radiation necrosis from tumour progression in brain metastases that are treated with stereotactic radiotherapy (radiosurgery). The f-value was found to be low in the region of the radiation necrosis, whereas tumour recurrence was more heterogeneous and showed higher values [74].
Other clinical applications
IVIM MR imaging might also be used as a diagnostic tool in gynaecology, orthopaedics, dermatology, and ophthalmology. Presentation of these applications is beyond the scope of this paper; however, some examples of various clinical applications according to the PubMed database are presented in Table 3.
Table 3
Clinical applications of intravoxel incoherent motion magnetic resonance imaging
Conclusions
The IVIM method is a DW MRI technique incorporating low b-values (< 200 s/mm2) for the estimation of perfusion parameters, which offers many advantages in comparison to the conventionally used DWI technique. It is a noninvasive substitute for the measurement of perfusion that does not require intravenous injection of exogenous contrast agents, such as gadolinium, and can be a great source of information on perfusion and diffusion simultaneously [62].
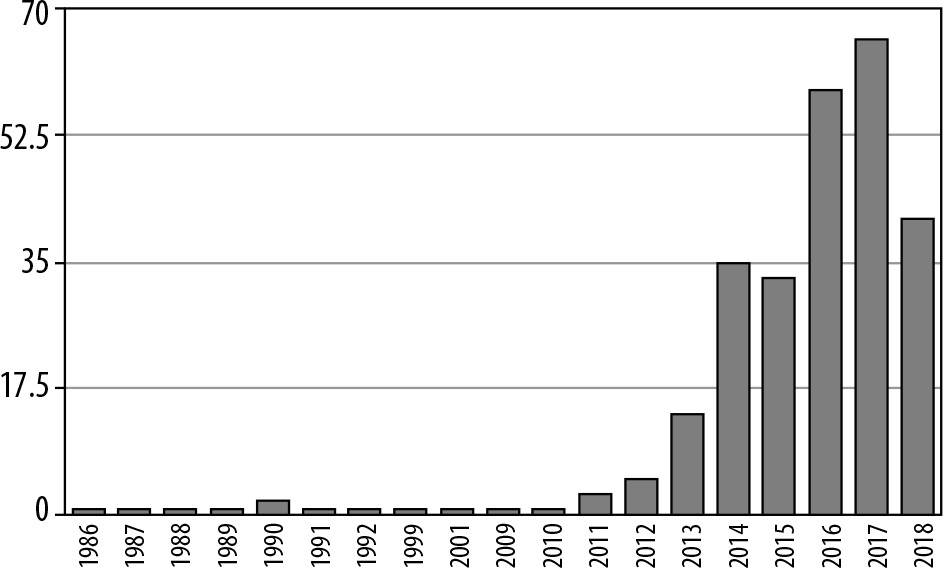
Today, the most promising clinical application for IVIM perfusion MRI is oncology. The graphs demonstrate the number of articles on implementation of IVIM MRI in oncology (Figure 3), compared to the total number of articles about this technique published between 1986 and 2018 (Figure 4).
Figure 3
Number of articles about intravoxel incoherent motion magnetic resonance imaging 1987-2018 (PubMed)
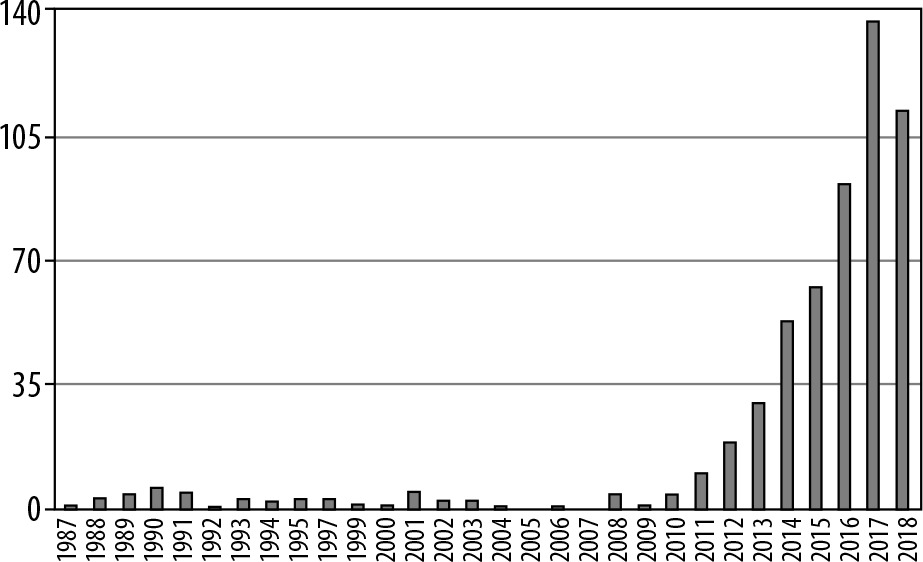
Figure 4
Number of articles about intravoxel incoherent motion magnetic resonance imaging in oncology 1986-2018 (PubMed)
Recently, there has been greater interest in using the IVIM technique to examine organ function and to evaluate treatment response. There is growing evidence that the additional functional information related to tumour angiogenesis may assist diagnosis and could have prognostic value in oncology patients.
Applications of IVIM may include detection and characterisation of widespread disease, such as both primary and metastatic tumours.
Published studies indicate that, in the near future, IVIM may become an important diagnostic imaging modality to evaluate brain, head and neck, salivary gland, pancreatic, prostate, breast, liver, and renal lesions, as well as lymph node metastasis [2].
However, the main problem with implementation of IVIM for routine MR imaging is lack of standardisation of both image acquisition and analysis, resulting in significant variance in calculated parameters among studies [75,76] (Table 4). Thus, this technique still needs to be refined in terms of acquisition, analysis, and application.
Table 4
Characteristics of the included studies
| Autor | Lesion | Parameter | Parameter value | Sensitivity | Specificity | Accuracy | AUC | P value |
|---|---|---|---|---|---|---|---|---|
| Chandarana et al. [32] | Clear cell RCC | ADC × 10-3 mm2/s | 2.2 ± 0.4 | 92.9% | 58.3% | 76.9% | 0.67 | |
| D × 10-3 mm2/s | 1.8 ± 0.6 | 86% | 62.5% | 75.0% | 0.68 | |||
| f | 0.25 ± 0.05 | 100% | 62.5% | 82.7% | 0.74 | |||
| D* × 10-3 mm2/s | 19 ± 13.5 | 0,53 | ||||||
| Cystic RCC and papillary RCC | f | < 0.16 | 100% | |||||
| Clear cell RCC and chromophobe RCC | f | > 0.16 | 100% | |||||
| Ding et al. [35] | Papillary RCC and chromophobe RCC vs. fat poor AML | ADC | > 1.39 | 39.1% | 100% | 60.0% | 0.634 | 0.167 |
| D | > 0.97 | 56.5% | 100% | 71.4% | 0.757 | 0.002 | ||
| D* | ≤ 28.03 | 87.0% | 75% | 82.9% | 0.822 | < 0.001 | ||
| f | ≤ 13.61 | 43.5% | 100% | 62.9% | 0.783 | < 0.001 | ||
| Sumi et al. [38] | Normal parotid gland | D, × 10-3 mm2/s | 0.765 ± 0.138 | |||||
| f | 0.148 ± 0.043 | |||||||
| D*, × 10-3 mm2/s | 41.68 ± 21.91 | |||||||
| Normal submandibular gland | D, × 10-3 mm2/s | 0.999 ± 0.154 | ||||||
| f | 0.133 ± 0.037 | |||||||
| D*, × 10-3 mm2/s | 54.16 ± 23.24 | |||||||
| Malignant salivary gland tumor | D, × 10-3 mm2/s | 0.96 ± 0.22 | ||||||
| f | 0.103 ± 0.0050 | |||||||
| D*, × 10-3 mm2/s | 21.99 ± 19.01 | |||||||
| Pleomorphic adenoma | D, × 10-3 mm2/s | 1.38 ± 0.30 | ||||||
| f | 0.066 ± 0.031 | |||||||
| D*, × 10-3 mm2/s | 10.53 ± 3.48 | |||||||
| Warthin tumor | D, × 10-3 mm2/s | 0.61 ± 0.11 | ||||||
| f | 0.156 ± 0.039 | |||||||
| D*, × 10-3 mm2/s | 42.64 ± 20.17 | |||||||
| Discriminating pleomorphic adenomas from Warthin tumors | D, × 10-3 mm2/s | ≥ 1.1 | 100% | 100% | 100% | |||
| f | ≤ 0.1 | 83% | 100% | 90% | ||||
| D*, × 10-3 mm2/s | ≤ 23 | 100% | 100% | 100% | ||||
| Discriminating malignant salivary gland tumors from benign ones | D, × 10-3 mm2/s | 0.8 < D < 1.1 | 64% | 100% | 87% | |||
| D*, × 10-3 mm2/s | 10 ≤ D*≤ 23 | 73% | 65% | 68% | ||||
| Combined D and D*, × 10-3 mm2/s | 0.8 < D < 1.1, D ≤ 0,8 and D* ≤ 23, or 1.1 ≤ D < 1.4 and D* ≥ 12 | 100% | 100% | 100% | ||||
| Sumi et al. [39] | Lymphomas | PP perfusion-related parameter | 0.09 ± 0.04 | |||||
| D, × 10-3 mm2/s | 0.47 ± 0.07 | |||||||
| Malignant salivary gland tumors | PP | 0.22 ± 0.07 | ||||||
| D, × 10-3 mm2/s | 1.03 ± 0.16 | |||||||
| Squamous cell carcinomas | PP | 0.15 ± 0.04 | ||||||
| D, × 10-3 mm2/s | 0.82 ± 0.17 | |||||||
| Pleomorphic adenomas | PP | 0.13 ± 0.02 | ||||||
| D, × 10-3 mm2/s | 1.44 ± 0.39 | |||||||
| Schwannomas | PP | 0.23 ± 0.08 | ||||||
| D, × 10-3 mm2/s | 1.26 ± 0.20 | |||||||
| Warthin tumors | PP | 0.19 ± 0.04 | ||||||
| D, × 10-3 mm2/s | 0.73 ± 0.22 | |||||||
| Liang L et AL. (42) | Malignant lymph nodes vs benign lymph nodes | D*, × 10-3 mm2/s | 120.89 ± 26.94 vs. 68.78 ± 17.72 | 0.0001 | ||||
| D, × 10-3 mm2/s | 0.57 ± 0.12 vs. 0.74 ± 0.21 | 0.0001 | ||||||
| f (%) | 0.20 ± 0.02 vs. 0.32 ± 0.05 | 0.0001 | ||||||
| ADC, × 10-3 mm2/s | 1.08 ± 0.26 vs. 1.25 ± 0.19 | 0.035 | ||||||
| Federau et al. [57] | Acute ischemic stroke - brain infarct core vs. contralateral side | f | 0.026 ± 0.019 vs. 0.056 ± 0.025 | 2.2 × 10⁻⁶ | ||||
| D, mm2/s | 3.9 ± 0.79 × 10⁻⁴ vs. 7.5 ± 0.86 × 10⁻⁴ | 1.3 × 10⁻²⁰ | ||||||
| Suo et al. [58] | Ischemic stroke vs contralateral hemisphere | ADC, × 10-3 mm2/s | 0.43 ± 0.10 vs. 0.73 ± 0.07 | < 0.001 | ||||
| D, × 10-3 mm2/s | 0.42 ± 0.10 vs. 0.72 ± 0.07 | < 0.001 | ||||||
| D*, × 10-3 mm2/s | 10.20 ± 4.17 vs. 10.87 ± 4.75 | 0.218 | ||||||
| f (%) | 4.29 ± 2.01 vs. 7.97 ± 2.03 | < 0.001 | ||||||
| fD*, × 10-3 mm2/s | 0.49± 0.27 vs. 0.94 ± 0.42 | < 0.001 | ||||||
| Togao et al. [64] | Differentiating high-grade gliomas from low-grade gliomas | D, × 10-3 mm2/s | ≤ 1.25 | 100% | 56.2% | 0.78 | ||
| ADC, × 10-3 mm2/s | ≤ 1.29 | 96.6% | 50.0% | 0.73 | ||||
| D*, × 10-3 mm2/s | ≥ 8.43 | 75.9% | 50.0% | 0.60 | ||||
| f (%) | ≥ 7.7 | 96.6% | 81.2% | 0.95 | ||||
| Suh et al. [67] | Glioblastoma group vs. atypical primary central nervous system lymphoma | fmax | reader 1: 0.101 ± 0.016 vs. 0.021 ± 0.010 reader 2: 0.107 ± 0.024 vs. 0.027 ± 0.015 | reader 1: 89.5% reader 2: 84.2% | reader 1: 95.1% reader 2: 95.1% | reader 1: < 0.001 reader 2: < 0.001 | ||
| Liu et al. [10] | Breast malignant tumor | ADC, × 10-3 mm2/s | 0.95 (0.83, 1.06) | 93% | 90% | |||
| D, × 10-3 mm2/s | 0.85 (0.77, 0.98) | 90% | 93% | |||||
| f | 10.34 (7.68, 11.88) | 88% | 54% | |||||
| D*,× 10-3 mm2/s | 94.71 (70.33, 113.23) | 85% | 41% | |||||
| Breast benign lesions | ADC, × 10-3 mm2/s | 1.39 (1.32, 1.50) | 95% | 90% | ||||
| D, × 10-3 mm2/s | 1.99 (1.77, 2.03) | 92% | 96% | |||||
| f | 6.83 (4.72, 10.33) | 89% | 56% | |||||
| D*, × 10-3 mm2/s | 107.49 (83.20, 131.19) | 82% | 44% | |||||
| Breast simple cyst | ADC, × 10-3 mm2/s | 1.96 (1.73, 2.18) | ||||||
| D, × 10-3 mm2/s | 1.35 (1.26, 1.44) | |||||||
| f | 1.69 (0.70, 3.47) | |||||||
| D*, × 10-3 mm2/s | 99.33 (87.04, 155.69) | |||||||
| Valerio et al. [24] | Prostate cancer | ADC, × 10-3 mm2/s | 0.76 ± 0.27 | |||||
| D, × 10-3 mm2/s | 0.99 ± 0.38 | |||||||
| f | 9.35 ± 5.97 | |||||||
| D*, × 10-3 mm2/s | 15.56 ±12.91 | |||||||
| Yamada et al. [28] | HCC | ADC, × 10-3 mm2/s | 1.10 ± 0.18 | |||||
| D, × 10-3 mm2/s | 1.02 ±10.17 | |||||||
| f | 0.15 ±10.07 | |||||||
| D*, × 10-3 mm2/s | ||||||||
| Liver metastasis | ADC, × 10-3 mm2/s | 1.26 ± 0.25 | ||||||
| D, × 10-3 mm2/s | 1.16 ± 0.18 | |||||||
| f | 0.22 ± 0.09 | |||||||
| D*, × 10-3 mm2/s | ||||||||
| Liver hemangioma | ADC, × 10-3 mm2/s | 1.56 ± 0.22 | ||||||
| D, × 10-3 mm2/s | 1.31 ± 0.21 | |||||||
| f | 0.35 ± 0.10 | |||||||
| D*, × 10-3 mm2/s | ||||||||
| Liver cyst | ADC, × 10-3 mm2/s | 3.01 ± 0.28 | ||||||
| D, × 10-3 mm2/s | 3.03 ±0.22 | |||||||
| f | 0.00 ± 0.01 | |||||||
| De Robertis et al. [29] | Pancreatic cancer | ADC, × 10-3 mm2/s | 1.41 (1.02-1.73) | |||||
| D, × 10-3 mm2/s | 1.42 (0.87-1.97) | 77% | 88% | 0.821 | ||||
| f | 5.82 (2.12-18.84) | 91% | 100% | 0.989 | ||||
| D*, × 10-3 mm2/s | 10.23 (1.79-57.85) | 94% | 96% | 0.952 | ||||
| Neuroendocrine neoplasms | ADC, × 10-3 mm2/s | 1.28 (1.01-1.89) | ||||||
| D, × 10-3 mm2/s | 1.2 (0.54-1.56) | |||||||
| f | 27.61 (3.22–80.83) | |||||||
| D*, × 10-3 mm2/s | 28.9 (12.16-73.08) | |||||||
| Autoimmune pancreatitis | ADC, × 10-3 mm2/s | 1.24 (0.94-1.64) | ||||||
| D, × 10-3 mm2/s | 1.16 (0.84-1.76) | |||||||
| f | 9.87 (4.18-11.60) | 100% | 100% | 1.000 | ||||
| D*, × 10-3 mm2/s | 10.62 (7.6-15.15) | 100% | 98% | 0.988 |