Introduction
High-density lipoprotein cholesterol (HDL-C) is the cholesterol fraction responsible for the reverse transport of excess cholesterol from peripheral tissues to the liver, where it is excreted from the body along with the bile [1, 2]. High-density lipoprotein (HDL) is a heterogeneous population of particles differing in shape, size, and composition [3], and is characterized by the presence of group A apolipoproteins (apos) and the absence of apolipoprotein B (apo B). Apolipoprotein complement is a critical determinant of lipoprotein function and metabolism. Apolipoproteins are activators or inhibitors of enzymes and ligands of cellular receptors that play a key role in the conversion of lipoproteins. The protein contained in HDL-C constitutes about 50% of the composition of the molecule. Apolipoprotein AI (apo AI) is the main protein responsible for the anti-atherosclerotic effects of HDL-C [4]. It is the key HDL-C protein, which promotes vasoprotective mechanisms via its ability to promote reverse cholesterol transport from peripheral tissues (i.e., macrophages) to the liver. Next to it, there are apos AII (apo AII), AIV, C, and E, as well as lipid-transporting enzymes and proteins that play an important role in the metabolism of lipoproteins [5, 6]. Apolipoprotein AII is the second most abundant protein in HDL-C particles. Its role in the reverse transport of cholesterol is controversial. Various observations indicate either the atherosclerotic or anti-atherogenic properties of apo AII [7].
People with autoimmune diseases are characterized by the presence of dyslipidemia including reduced HDL-C levels [8–10]. There have been reports on the effect of insulin therapy on HDL-C levels in type 1 diabetes mellitus (T1DM) [11–13], but few studies assessing the effect of insulin on apos. Moreover, there is a lack of data on the relationship between apo abnormalities at the time of T1DM diagnosis and the development of atherosclerotic cardiovascular disease and other complications in the future. Our previous observations showed that the initiation of insulin therapy in patients with newly diagnosed T1DM causes a significant increase in HDL-C level after 3 months of treatment, and this effect is dose-dependent [14]. Conflicting data exist regarding the level of apo AI in patients with T1DM. Researchers have reported decreased, increased, or the same apo AI level compared with healthy controls. Interestingly, the researchers agree that apo AII concentration is not significantly different in patients with T1DM compared to the control group [15–18]. An increase in apo AI level was observed along with the duration of the T1DM [19]. Murao et al. showed that insulin stimulates apo AI expression in human HepG2 cells, and this phenomenon is dependent on the dose of insulin. The authors suggested that the ability of insulin to enhance apoA1 gene expression reinforces the recommendation for tight glycemic control to reduce the risk of atherosclerotic disease in T1DM [20]. The data about the relation between insulin therapy and apos in T1DM are limited.
Thus, the study aimed to prospectively observe the changes in serum apos AI and AII in patients with newly diagnosed T1DM and their association with the daily insulin requirement.
Material and methods
General information
The Insulin Therapy and Lipoproteins Profile in Type 1 Diabetes Study (InLipoDiab1) is a prospective, observational study. Three hundred patients were recruited for the study so far, but recruitment is still ongoing. Thirty-four patients (22 men and 12 women), aged 26 (IQR: 22–32) with newly diagnosed T1DM were consecutively recruited between June 2015 and October 2017 in the Department of Internal Medicine and Diabetology. All participants of the InLipoDiab1 study are patients with newly diagnosed T1DM who are constantly recruited and regularly participate in visits to the Outpatient Clinic. The current analysis includes people for whom we have collected a set of data at 4 control points, i.e. at the time of diagnosis and after 3 weeks, 6 and 12 months of observation. The inclusion criteria were: new-onset T1DM and treatment with insulin, age between 18 and 35 years old, written consent to participate in the study, no other medical conditions, and no additional drugs apart from insulin. All patients were hospitalized, on average, for 7 days due to newly diagnosed T1DM. The patients were treated with intensive insulin therapy using insulin pens from the moment of diagnosis and underwent the same educational program as we described previously [14]. The daily dose of insulin (DDI) was defined as the requirement for insulin per kilogram of body weight per day. The daily dose of insulin was calculated as the amount of short and long-acting insulin (basal + bolus) at discharge from the hospital and at follow-up visits in the outpatient clinic from the doses of insulin noted by the patients in their self-monitoring of blood glucose logs 1 day before the visit. The autoimmune etiology was confirmed in all patients by the positive specific autoantibodies: islet cell antibodies (a-ICA), glutamic acid decarboxylase antibodies (a-GAD), and tyrosine phosphatase antibodies (a-IA2). The study is registered at ClinicalTrials.gov (NCT02306005). The study followed the tenets of the Declaration of Helsinki and was approved by the institutional ethics committee, with written informed consent from each participant. All data were obtained from a face-to-face interview, physical examination, and biochemical measurement. Blood pressure was measured with an arm type manual sphygmomanometer one 3 times after resting for more than 10 min, and then the average was taken. Characteristics of the study group at diagnosis are presented in Table I.
Table I
Characteristics of the study group at diagnosis. Results are presented as median values and interquartile range (IQR) or number and percentage
| Variable | All patients N = 34 | Women n = 12 | Men n = 22 |
|---|---|---|---|
| Age at diagnosis [years] | 26 (22–32) | 24 (22–31) | 31 (28–35) |
| DDI at discharge from hospital at diagnosis [units/kg/day] | 0.12 (0.09–0.19) | 0.13 (0.11–0.26) | 0.10 (0.08–0.17) |
| Body mass before the diagnosis of diabetes [kg]* | 77.30 (61.60–87.50) | 58.75 (55.60–66.90) | 84.4 (76.3–88.3) |
| Body mass at diagnosis [kg] | 69.15 (56.60–82.30) | 53.05 (49.60–57.00) | 78.2 (70.00–85.00) |
| BMI [kg/m2] | 22.29 (19.56–23.63) | 19.40 (18.66–21.49) | 23.21 (21.89–26.55) |
| Waist circumference [cm] | 80 (70–86) | 66.50 (64–73) | 83 (80–93) |
| WHR | 0.80 (0.75–0.87) | 0.74 (0.71–0.77) | 0.85 (0.80–0.91) |
| SBP [mm Hg] | 120 (110–127) | 118 (110–121) | 121 (115–132) |
| DBP [mm Hg] | 80 (70–87) | 80 (70–86.5) | 80 (70–87) |
| Fat tissue content (%) | 19.35 (13.55–22.30) | 20.6 (17.6–26.1) | 18.0 (10.4–21.3) |
| MFG [mmol/l] | 7.44 (6.57–7.86) | 7.4 (6.6–7.6) | 7.45 (6.57–8.06) |
| MPG [mmol/l] | 9.33 (8.41–10.08) | 8.98 (8.29–9.77) | 9.36 (8.69–10.11) |
| Creatinine [μmol/l] | 72.49 (64.53–83.10) | 64.53 (56.58–66.30) | 82.21 (70.72–90.17) |
| AlAT [U/l] | 23.00 (16.00–31.00) | 17.00 (10.00–30.50) | 24.00 (17.00–31.00) |
| HbA1c (%) | 11.15 (9.50–12.30) | 11.7 (9.45–13.00) | 10.8 (9.5–11.9) |
| Total cholesterol [mmol/l] | 4.51 (3.80–5.04) | 4.22 (3.75–4.65) | 4.58 (3.85–5.74) |
| HDL cholesterol [mmol/l] | 1.22 (1.01–1.40) | 1.23 (1.18–1.69) | 1.19 (0.96–1.34) |
| LDL cholesterol [mmol/l] | 2.58 (2.00–3.55) | 2.31 (1.85–2.76) | 2.97 (2.27–4.00) |
| Triglycerides [mmol/l] | 1.21 (0.94–1.60) | 1.11 (0.80–1.43) | 1.21 (0.99–2.31) |
| TSH [μIU/ml] | 1.86 (1.26–2.92) | 2.25 (1.12–3.04) | 1.81 (1.35–2.62) |
DDI – daily dose of insulin, BMI – body mass index, WHR – waist-hip ratio, SBP – systolic blood pressure, DBP – diastolic blood pressure, MFG – mean fasting glucose, MPG – mean postprandial glucose, AlAT – alanine transaminase, HbA1c – glycated hemoglobin, HDL – high-density lipoprotein, LDL – low-density lipoprotein, TSH – thyroid stimulating hormone.
Anthropometric data
Physical examination included the measurements of body weight, height, fat tissue content, waist, and hip circumference. Body weight and fat tissue content were measured by Body Composition Analyzer Tanita. Height, waist, and hip circumference were measured by trained investigators using standardized meter measures. The body mass index (BMI) and waist-to-hip ratio (WHR) were calculated from the following formulas: BMI = weight (kg)/squared height (m2) and WHR = waist circumference (cm)/hip circumference (cm), respectively.
Diabetes mellitus metabolic control
The measurement of glycated hemoglobin (HbA1c) concentration was made in whole blood and assessed by a turbidimetric inhibition immunoassay (Cobas 6000, Roche Diagnostics). Mean fasting glucose (MFG) and mean postprandial glucose (MPG) were measured using capillary plasma with a glucometer. Mean postprandial glucose was measured 3 times, 2 h after major meals throughout the day. Mean fasting glucose and MPG were expressed as the mean of patients’ measurements from all days of hospital stay.
Assessment of lipid profile and apolipoproteins
The measurement of apo AI and apo AII concentration was conducted at 4 time points: at the time of diagnosis (before administration of insulin) and at follow-up after 3 weeks, 6 months and 1 year of insulin treatment. The concentration of apo AI and apo AII was determined with AssayPro company tests using the immunoenzymatic method ELISA (enzyme-linked immunosorbent assay) using a TECAN-SUNRISE reader with Magellan software. Apolipoprotein AI/apo AII ratio was calculated by dividing apo AI by apo AII. The evaluation of the lipid profile was conducted at the time of diagnosis (before administration of insulin). High-density lipoprotein cholesterol, total cholesterol (TC), and triglyceride (TG) levels were measured with the Cobas 6000 biochemistry analyzer (Roche Diagnostics) using enzymatic colorimetric methods. All of the above measurements were performed in serum. Low-density lipoprotein cholesterol level was calculated by the Friedewald formula. Non-HDL-C was calculated as TC minus HDL-C. Triglyceride/HDL-C ratio was calculated by dividing TG by HDL-C (in mg/dl units). To properly assess the effect of insulin therapy on apos, the inclusion criterion was to obtain baseline blood samples of the patients immediately after the diagnosis of diabetes and before administration of the first insulin injection.
Statistical analysis
Statistical analysis of results was performed using Statistica v. 13.0 software (StatSoft, Tulsa, CA, USA). The Kolmogorov-Smirnov test with Lilliefors correction was used to analyze the normal distribution of data. Non-parametric tests were used for further analyses because analyzed parameters did not have a normal distribution. Results were presented as numbers and percentages, as well as medians and interquartile ranges (IQR). ANOVA Friedman test was used to analyze differences between subgroups for numerical variables. A comparison of selected parameters at 2 different points of observation was tested by the Wilcoxon test. Spearman correlation was used to evaluate the association between the DDI and Apo AI and Apo AII concentration. P < 0.05 was considered statistically significant.
Results
Apolipoproteins
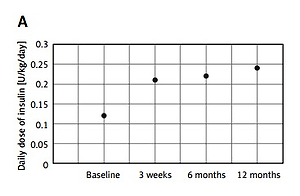
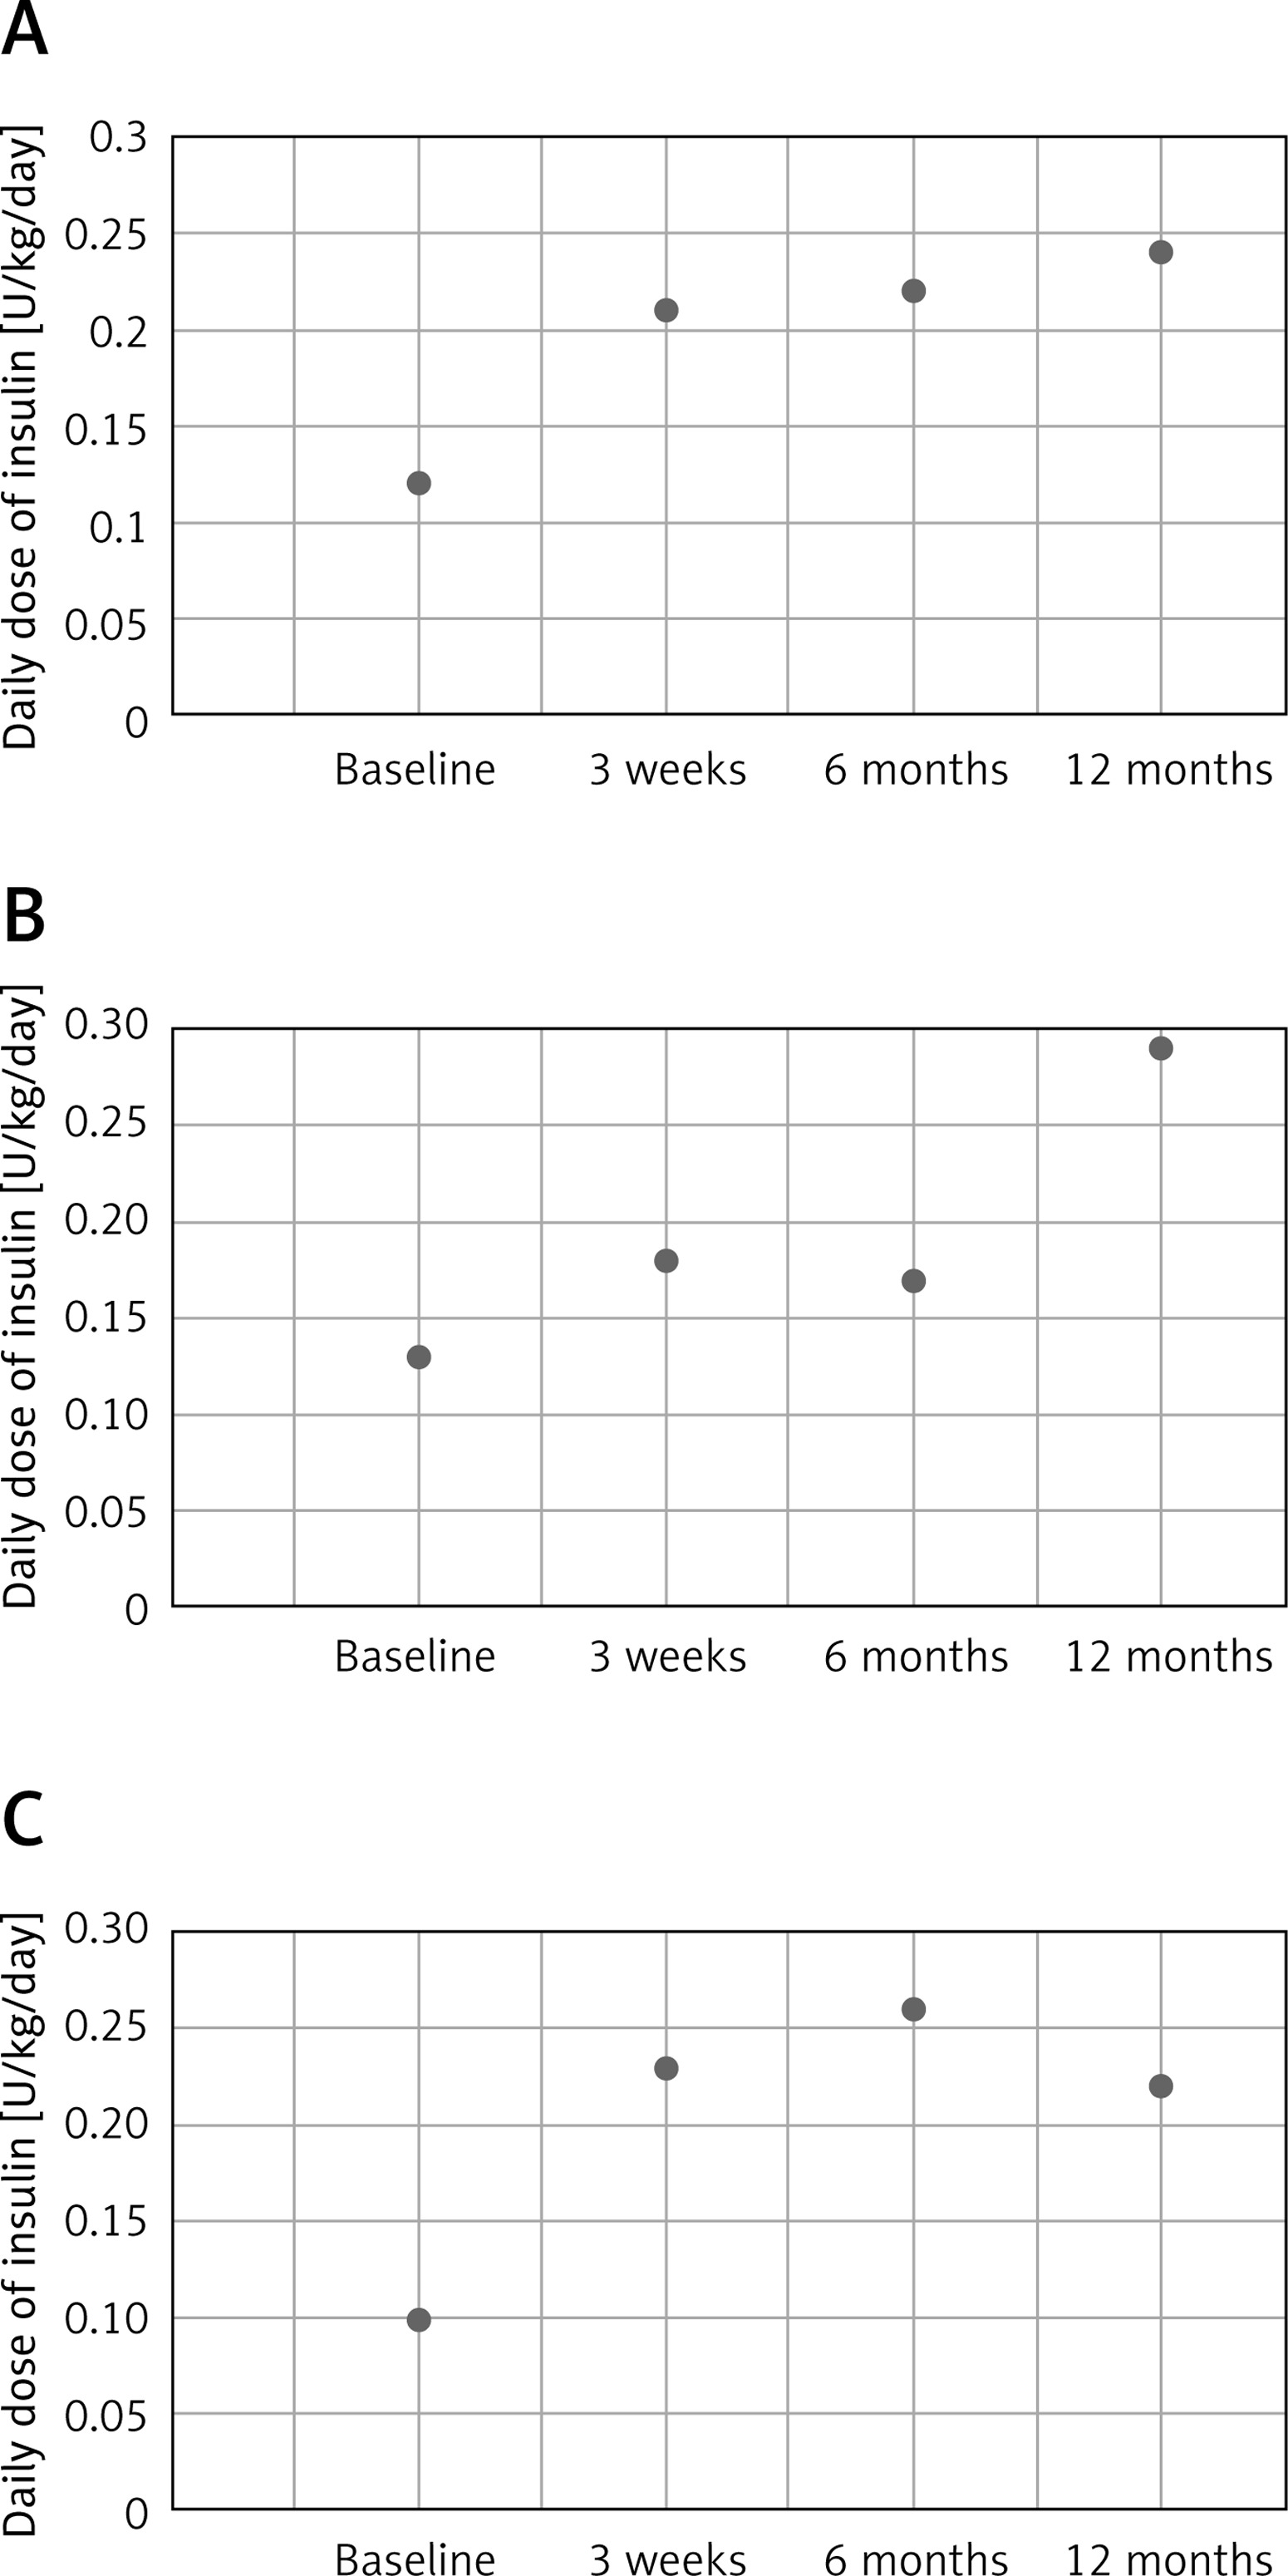
Significant increases in apo AI and apo AII concentrations were revealed during the first year of insulin therapy. The changes in apo AI concentration were observed after the first 3 weeks of intensive insulin therapy, with the largest increase between 3 weeks and 6 months of observation. The same trend was found in the apo AI/apo AII ratio. In contrast, apo AII levels did not change significantly after 3 weeks of treatment, while a significant increase was observed between 3 weeks and 6 months of treatment. Between 6 and 12 months of the study, we observed a further increase in the level of apo AI and a decrease in the level of apo AII, but these changes were not statistically significant. The correlations between DDI and apo concentration also were not statistically significant. Changes in apolipoprotein concentration for the whole group and according to sex are shown in Table II, while changes in DDI are shown in Figure 1.
Table II
Changes in apolipoprotein concentrations during the first year of observation. Results are presented as median values and interquartile range (IQR). P < 0.05 is statistically significant. Wilcoxon test
Discussion
The obtained results provide first-line evidence showing dynamic changes in the concentration of apos AI and AII, during the first year of intensive insulin therapy in patients with newly diagnosed T1DM. The results indicate a significant increase in anti-atherogenic apo AI and probably proatherogenic apo AII in the first year of disease duration. However, we have not proven the direct effect of a DDI on the increase in apos concentration. Surprisingly, our study demonstrated that apo AI level significantly exceeds accepted norms, both at the time of diagnosis and after 12 months of the study. On the other hand, apo AII level (despite the significant increase in concentration) is significantly below accepted norms at the same time points [21, 22]. The above results suggest a protective mechanism against metabolic disturbance which occurs at the onset of T1DM. This shows how important it is to achieve good management of the disease from the beginning in order to improve the outcome and prevent the development of complications in the future.
Lipid disorders have a proven impact on the development of chronic complications, both in T1DM and type 2 diabetes mellitus (T2DM). Patients with T1DM are characterized by higher HDL-C levels, but their life expectancy is shorter than their peers [23]. We assume that despite high HDL-C levels, its qualitative composition may show abnormalities and function may be impaired, which predicts development of diabetic complications [24]. During our observation, we revealed an increase in the concentration of anti-atherogenic apo AI and apo AII, whose role in atherogenesis is unknown. Studies on animals showed that apo AII promotes insulin resistance and has diverse effects on fat homeostasis. Apolipoprotein AII transgenic mice had increased adipose mass, and higher plasma leptin and insulin levels than control mice. Moreover, these mice exhibited a delay in plasma clearance of a glucose bolus. Adipose tissue from fasted apo AII transgenic mice was characterized by a 50% decrease in triglyceride hydrolysis compared with control mice. Skeletal muscle from fasted apo AII transgenic mice exhibited reduced uptake of 2-deoxyglucose compared with control mice [25]. It might be possible that the development of complications and premature death is associated with adverse changes in apo AII already during the first year of T1DM. This may indicate that not only the concentration but also the composition of HDL may be pivotal in T1DM, probably by changing its function.
Our observations regarding the increase in the concentration of apo AI are consistent with the Wilson et al. study. In a relatively small group of young patients with T1DM, they revealed that insulin therapy intensification results in increased apo AI concentration after 3 and 6 months of treatment [11]. Intensification of treatment consisted of transition from the model of twice-daily insulin doses consisting of NPH insulin and regular insulin to the method of multiple injections consisting of regular insulin given before meals (doses were given as units per calorie of ingested food) and a subcutaneous small dose of NPH insulin given at bedtime according to individual requirement, as estimated by the fasting blood glucose level. Our patients were treated with intensive insulin therapy from the beginning, and the insulin dose increased as the study progressed, but we did not observe the direct effect of the insulin dose on apos levels.
Other prospective studies assessing apos in T1DM are not consistent with our observations. Kobbah et al. [26] similarly to us assessed lipid parameters prospectively, but the observation time was longer (2 years) and the population consisted of children with newly diagnosed T1DM treated with intravenous insulin infusion for the first 48–72 h and then with 2 doses of combinations of regular and intermediate insulins. Concentrations of apo AI and apo AII (more pronounced in apo AI), and apo AI/apo AII ratio were increased on admission to the hospital in comparison with healthy controls but were restored to normal during 2-year insulin treatment. The results obtained in children are puzzling because, in our study, in the adult population, we observed quite the opposite phenomenon.
Fukui et al., in their non-prospective study, showed that patients with T2DM treated with diet and exercise therapy, either alone or in combination with antihyperglycemic agents, except insulin, had significantly lower apo AI levels in comparison with patients with T1DM and T2DM treated with multiple injections of insulin in a basal-bolus manner. In the same study there were no differences in apo AII level. The authors pointed to the effect of insulin on apos. However, there was no significant difference in apo AI level between T1DM and T2DM with insulin, while the total dose of injected insulin was higher in T1DM than in T2DM [27].
Our observations concern changes in apos AI and AII at several points during the first year of the disease. A small study on patients with newly diagnosed T1DM with severe insulinopenia revealed no significant changes in apo AI concentrations during the first 5 days of insulin therapy, but significant normalization in the lipoprotein profile at 2 days after initiation of insulin therapy. Thus, the results of this study showed that insulin caused changes in lipoprotein levels earlier than in the apos levels [28]. Our previous observations have shown that dynamic changes in HDL-C levels occur in the first year of T1DM and insulin therapy. A significant increase appeared after 3 months of insulin therapy and progressed over time, which we also observed between 3 and 12 months of treatment. This is in contrast to changes in apo AI and apo AII, in which we did not record significant changes between 6 and 12 months of T1DM.
Apolipoproteins AI and AII have been associated with chronic complications of T1DM. Apolipoprotein AII level is positively associated with common and/or internal carotid intima-media thickness (IMT) in men, while apo AI level is inversely associated with internal carotid IMT in women [29]. Concerning diabetic nephropathy, the data are ambiguous. Both elevated levels of apo AI and apo AII, as well as reduced levels of these apos, are associated with the development of chronic renal complications [30–32]. In contrast, another study did not reveal differences in apo AI and apo AII in patients with normo-, micro-, and macroalbuminuria [33]. In the case of diabetic retinopathy, an increased, decreased, or unchanged level of apo AI was observed in diabetics with retinopathy compared to patients without the complication or healthy subjects [34–36]. Thus, there are conflicting data on the relationship between apos level and complications in T1DM, perhaps due to different stages of the disease, duration of diabetes or DDI.
The available results of research on apos level do not provide knowledge about their dynamic changes resulting from the initiation of insulin therapy in the first year of diabetes, and there is a lack of new studies on this phenomenon. Our findings may elucidate the role of exogenous insulin in lipid metabolism and prospectively support previous evidence that its disturbances influence diabetic complications.
However, our study has some limitations. We conducted a study on a relatively small group with a short time of observation. Furthermore, no electrophoretic separation of lipoproteins was performed. However, further analyses in this group are planned.
In conclusion, serum apo AI and apo AII concentration increased significantly in patients with newly diagnosed T1DM during the first year of diagnosis and treatment. A clear increase in apos concentration appears 6 months after diagnosis and remains stable after 12 months of treatment. The obtained results can become a strong background for further analysis, because we suggest that the profile of serum apos beside traditional lipid level may be a prognostic marker of macro- and microvascular dysfunction and may play a role in the development of chronic complications in T1DM. Due to the significant deviation of apos concentration from accepted norms, changes in the recommendations of lipid management criteria in T1DM may be considered.