

Introduction
Systemic lupus erythematosus (SLE) is a systemic autoimmune disease with a strong genetic basis, in which the immune system mistakenly attacks healthy tissues, including skin and various organs. It is characterized by over-production of autoantibodies, which results in injury of multiple tissues and organs [1], including skin, heart, lungs, intestine and kidney, rendering it a harmful disease with high morbidity and mortality [2].
The complement system represents the central immune surveillance of the vertebrate organism. It recognizes and removes foreign material and modified host cells, thus playing significant roles in various human disorders including SLE [3]. In the diagnosis of lupus, the test of serum complement C3 level can provide a complementary and confirmatory effect to improve the positive diagnosis rate, which is of great value in understanding the pathogenesis of the disease [4-6]. SLE patients with antiphospholipid antibodies in their blood have significantly lower levels of complement C3 compared with SLE patient without antiphospholipid antibodies [7]. Patients with lupus renal flare also express a significantly lower level of C3 [6].
Complement component C3b would be deactivated by binding with complement factor H related protein 5 (CFHR5) at the site of tissue damage [8, 9]. Plasma lipopolysaccharide-binding protein is associated with a particle containing apolipoprotein A-I, phospholipid, and factor H-related proteins, which is responsible for the enhancement of integrin-mediated cell adhesion in response to lipopolysaccharide in neutrophils [9]. The widely known function of human CFHR5 is represented by the regulation of complement component activities in the form of a cofactor and the dysfunction of CFHR5 is associated with a number of diseases including SLE [3]. Compared with healthy individuals, circulating CFHR5 levels are significantly higher in patients with immunoglobulin (Ig)A nephropathy [10] and SLE [11]. Collectively, the expression of C3 is reduced and CFHR5 is elevated in SLE related diseases. Due to the interaction of C3 and CFHR5, we wonder if a pathological relationship might exist between decreased level of C3 and increased level of CFHR5 in SLE.
Competing endogenous RNA (CeRNA) refers to the fact that the pool of long noncoding RNAs (lncRNAs), messenger RNAs (mRNAs) and transcribed pseudogenes talk to each other using microRNA (miRNA) response elements (MREs) as letters of a new language, which forms a large-scale regulatory network across the transcriptome [12]. CFHR5 expression was regulated by CeRNA networks through miRNA competition. MiR-222 is a miRNA target that decreased in lupus nephritis and it is negatively correlated with serum anti-dsDNA level, which is increased in lupus activity [13]. Therefore, the above-mentioned evidence indicated that high anti-dsDNA and low C3 were exhibited in lupus development, in which CFHR5 expression increased, while MiR-222 decreased. Furthermore, MiR-222 may be involved in the expression of CFHR5 via the CeRNA network.
Therefore, in this study we performed bioinformatics analysis to find the target RNAs involved in the lncRNA-MiR-222-CFHR5 CeRNA network and the result demonstrated the regulatory relationships among C3, CFHR5, MiR-222 and lncRNA in SLE by analysis of samples from animal model and clinical patients. Our results revealed additional evidence associated with the pathogenesis of SLE and may provide new approaches in the diagnosis and treatment of this disease.
Material and methods
Targeted miRNA prediction
The target RNAs involved in the lncRNA-MiR-222-CFHR5 CeRNA network were acquired by the following databases: TargetScan (http://www.targetscan.org/), miRWalk (http://www.ma.uni-heidelberg.de/apps/zmf/mirwalk/), miRanda (http://www.microrna.org/microrna/home.do) and miRDB (http://mirdb.org/miRDB/).
Blood samples from systemic lupus erythematosus patients and healthy individuals
Blood samples were collected from 50 SLE patients and 50 healthy individuals at The First Affiliated Hospital of Medical College, Xi’an Jiaotong University. SLE was diagnosed according to the American College of Rheumatology diagnostic criteria. Written informed consent was obtained from all participants before proceeding with the collection of blood samples, and experiments were approved by the ethics committee of The First Affiliated Hospital of Medical College, Xi’an Jiaotong University.
MRL/lpr mice experiments
MRL/lpr mice (n = 50) and control MRL/MPJ mice (n = 10) (3 months old and weighing 20 ±2 g) were purchased from the SLAC company (Shanghai, China). All animal experiments were performed in accordance with the National Institutes of Health Guide for the Care and Use of Laboratory Animals, with the approval of The First Affiliated Hospital of Medical College, Xi’an Jiaotong University. Mice of the MRL/lpr model were randomly divided into five groups: MRL/lpr group, no-load vector group, lncRNA MIAT treatment group, miR-222 treatment group and lncRNA MIAT + miR-222 treatment group. The control MRL/MPJ group was included, and in each group 10 mice were included. MRL/lpr mice in each group were intravenously treated with no-load vector, lncRNA MIAT-load vector, miR-222-load vector and lncRNA MIAT-load + miR-222-load vector using the in vivo transfection reagent Entranster (Engreen Biosystem Co. Ltd, Beijing, China). Ten µg of each vector was dissolved in 2 ml of saline and injected via the tail vein within 5-8 s in 3 consecutive days, as described previously [14]. Blood samples were collected at 0, 1, 2 and 3 weeks after injection, as described previously [15]. At the end of the experiment, all mice were sacrificed according to the institutional guidelines, and kidney tissues of the mice in each group were dissected and stored at –80°C.
According to the CeRNA theory and the target we identified by bioinformatics analysis, we set the regulatory order as lncRNA MIAT – miR-222 – mRNA CFHR5 – CFHR5 expression – C3 expression, among which miR-222 worked as a sponge to negatively regulate the upstream lncRNA MIAT and downstream mRNA CFHR5 so as to regulate CFHR5 expression. Therefore, mice in the lncRNA MIAT-load vector group showed higher CFHR5 than MRL/lpr mice, while mice in the miR-222-load vector group showed lower CFHR5 than MRL/lpr mice, and mice in lncRNA MIAT-load + miR-222-load vector group showed no significant difference in comparison with MRL/lpr mice.
Extraction of anti-dsDNA, miR-222, lncRNA MIAT, C3 and CFHR5 from blood samples
A peripheral venous blood sample was collected from each mouse. Next, the blood was centrifuged at 3600 rpm for 5 min after standing for 5 min. Anti-dsDNA, C3 and CFHR5 were accumulated in the supernatant serum. Approximately 50 µl of serum were used for dsDNA detection by the Crithidia Luciliae indirect immunofluorescence test (CL-IFT) [16] and 50 µl for miR-222 and lncRNA MIAT detection by qRT-PCR. The remaining serum was used for detection of C3 and CFHR5 protein levels by western blot after protein quantification by bicinchoninic acid (BCA) assay.
Real-time qRT-PCR analysis
Total RNA was extracted from blood of each mouse and patients and volunteers using TRIzol reagent (Invitrogen, Carlsbad, CA, USA). RNA concentration was measured by Nanodrop, and each paired sample was adjusted to the same concentration. qRT-PCR was performed using the LightCycler (Roche, USA) and SYBR RT-PCR kits (Takara Bio, Japan). The human β-actin gene was used as a reference gene. Primers used were as follows: Human miR-222 gene 5’-ACACT CCAGC TGGGA GCTAC ATCTG GCTAC TG-3’ (forward) and 5’-CTCAA CTGGT GTCGT GGA-3’ (reverse) [17]; human lncRNA MIAT 5’-GTGTG TGTCT GCTGA GGTG-3’ (forward) and 5’-CTGGG GTTAG TAAGA AGAGA A-3’ (reverse) [18]; human β-actin 5’-GGTCG GAGTCA ACGGA TTTGG TCG-3’ (forward) and 5’-CCTCC GACGC CTGCT TCACC AC-3’ (reverse) [19]. Five µl of reaction mixture was made as follows: 2.5 µl universal master mix, 0.25 µl primer and probe set, 0.33 µl cDNA and 1.92 µl H<sub>2</sub>O. Each sample was run in triplicate. qRT-PCR was performed at 50°C for 2 min, 95°C for 10 min, followed by 40 cycles at 95°C for 15 s and 60°C for 1 min [20]. The relative gene expression was calculated using the 2-ΔΔCT method.
CL-IFT
CL-IFT was compared with the DNA-binding assay to confirm the presence of dsDNA antibodies in SLE patients [14]. CL-IFT was performed using the Qubit dsDNA HS Assay Kit (Thermo Fisher, Massachusetts, USA), according to the manufacturer’s instruction. The absorbance was measured at 485/530 nm using a microplate reader (Vario-skan Flash, Thermo).
Western blot
The expression of C3 in the serum and CFHR5 on the cyto-membrane of red blood cells of SLE patients and healthy individuals, and in the MRL/lpr mice model and control MRL/MPJ mice were detected by western blot using specific primary antibodies. Forty µg of proteins were loaded on each lane of 8% SDS-PAGE gel; after separation, the proteins were transferred onto polyvinylidene fluoride or polyvinylidene difluoride (PVDF) membranes. PVDF membranes were then blocked with 5% Albumin Bovine V (Roche, USA) in Tris-buffered saline containing 0.5% Tween 20 and incubated at room temperature for 2 hours. Next, membranes were incubated overnight with the specific primary antibodies of each protein, such as anti-C3 (ab181147), CFHR5 (ab175254), and GAPDH (ab9485, Abcam Biotechnology, Inc., Cambridge, UK) at 4oC. At the second day, membranes were taken out and washed with washing buffer 3 times, each time for 5 min. Then membranes were incubated with corresponding secondary antibodies for 1 h at room temperature. After incubation, membranes were washed with washing buffer 3 times, each time for 5 min. After washing, proteins were visualized by chemiluminescence using Super Signal West Pico PLUS Chemiluminescent Substrate (Thermo Fisher, Massachusetts, USA) by a Tanon 5500 Chemiluminescence Detection System (Tanon, Shanghai, China).
Hematoxylin and eosin (H&E) staining
Mice kidney tissues were maintained in 4% paraformaldehyde overnight in 12-well plates, then transferred to increasing concentrations of ethanol for dehydration, embedded in paraffin and cut into 4 µm-thick sections using a microtome. Sections were dewaxed in xylene, rehydrated through decreasing concentrations of ethanol, and washed in phosphate-buffered saline (PBS). Sections were stained with hematoxylin and eosin for 2 min and 3 min, respectively. After staining, sections were dehydrated through increasing concentrations of ethanol and xylene, mounted and photographed (Olympus BX53, Olympus, Japan).
Statistical analysis
Statistical analysis was performed using the SPSS 13 software package (IBM, Endicott, NY). Each experiment was performed at least three times. Data were expressed as mean ± standard error of the mean (SEM). Statistical significance of the differences among means was determined by one-way analysis of variance (ANOVA) followed by the Dunnett test for post hoc multiple comparisons. A value of p < 0.05 was considered as statistically significant.
Results
MiR-222 was the target of lncRNA MIAT and mRNA CFHR5
The specific miRNAs targeted by lncRNA MIAT and CFHR5 mRNA was predicted by the following databases: TargetScan, miRWalk, miRanda and miRDB. First, the potential miRNAs binding to the CFHR5 mRNA (Table 1) were found, and then we established miRNAs pairing with the 3’ UTR sequence of CFHR5 (Table 2). According to the bioinformatics analysis, the miRNAs in the intersection set were has-miR-222-3p, has-miR-6507-5p and has-miR-186-5p. Furthermore, multi-binding sites to lncRNA MIAT were present in has-miR-222-3p (Table 3), demonstrating that lncRNA MIAT could easily interact with miR-222 to exert its regulatory function as a sponge. Additionally, miR-222 may exert effects on SLE related diseases including lupus nephritis [6] and multiple sclerosis [21]. Based on the above-mentioned results and reports, we chose miR-222 as the targeted miRNA.
Table 1
The potential miRNAs binding to the CFHR5
Table 2
The miRNAs pairing with the 3’ UTR sequence of CFHR5
Table 3
The multi-binding sites of lncRNA MIAT to has-miR-222-3p
LncRNA MIAT enhanced lupus disease development by upregulating CFHR5 expression via miR-222 degradation in vivo
As shown in Figure 1A, the expression levels of lncRNA MIAT and CFHR5 were both higher in the MRL/lpr group, the expression of miR-222 and C3 was significantly lower in comparison with the control MRL/MPJ group, and the expression of anti-dsDNA was higher in the MRL/lpr group in comparison with the MRL/MPJ group (Table 4). Accordingly, more renal injury was found in the MRL/lpr model in comparison with MRL/MPJ mice as indicated by H&E staining (Fig. 1B). As regards the lncRNA MIAT treatment group, the expression of miR-222 was remarkably low, CFHR5 expression and expression of positive anti-dsDNA (Table 4) were much higher, and C3 was extremely lower than in the no-load vector group (Fig. 2A). Moreover, H&E staining showed no glomerular interstitial or vascular injury in the groups of control MRL/MPJ and no-load vector (Fig. 2B), but thickened vascular walls, thickened/damaged intima, and thickened tunicae media vasorum were present in the MRL/lpr group (Fig. 2B). LncRNA MIAT and CFHR5 expression (Fig. 2C), and positive anti-dsDNA level (Table 4) were lower, while the expressions of miR-222 and C3 (Fig. 2D) were both significantly higher in the miR-222 group than in the vector group and MRL/lpr group. Moreover, H&E staining showed fewer pathological characteristics such as glomerular interstitial or vascular injury.
Fig. 1
A) LncRNA MIAT, miR-222, CFHR5, and C3 expression in the MRL/lpr group and MRL/MPJ control group. Data are expressed as mean ± SEM. *p < 0.05. B) H&E staining in kidney tissues of the MRL/lpr group and control MRL/MPJ group
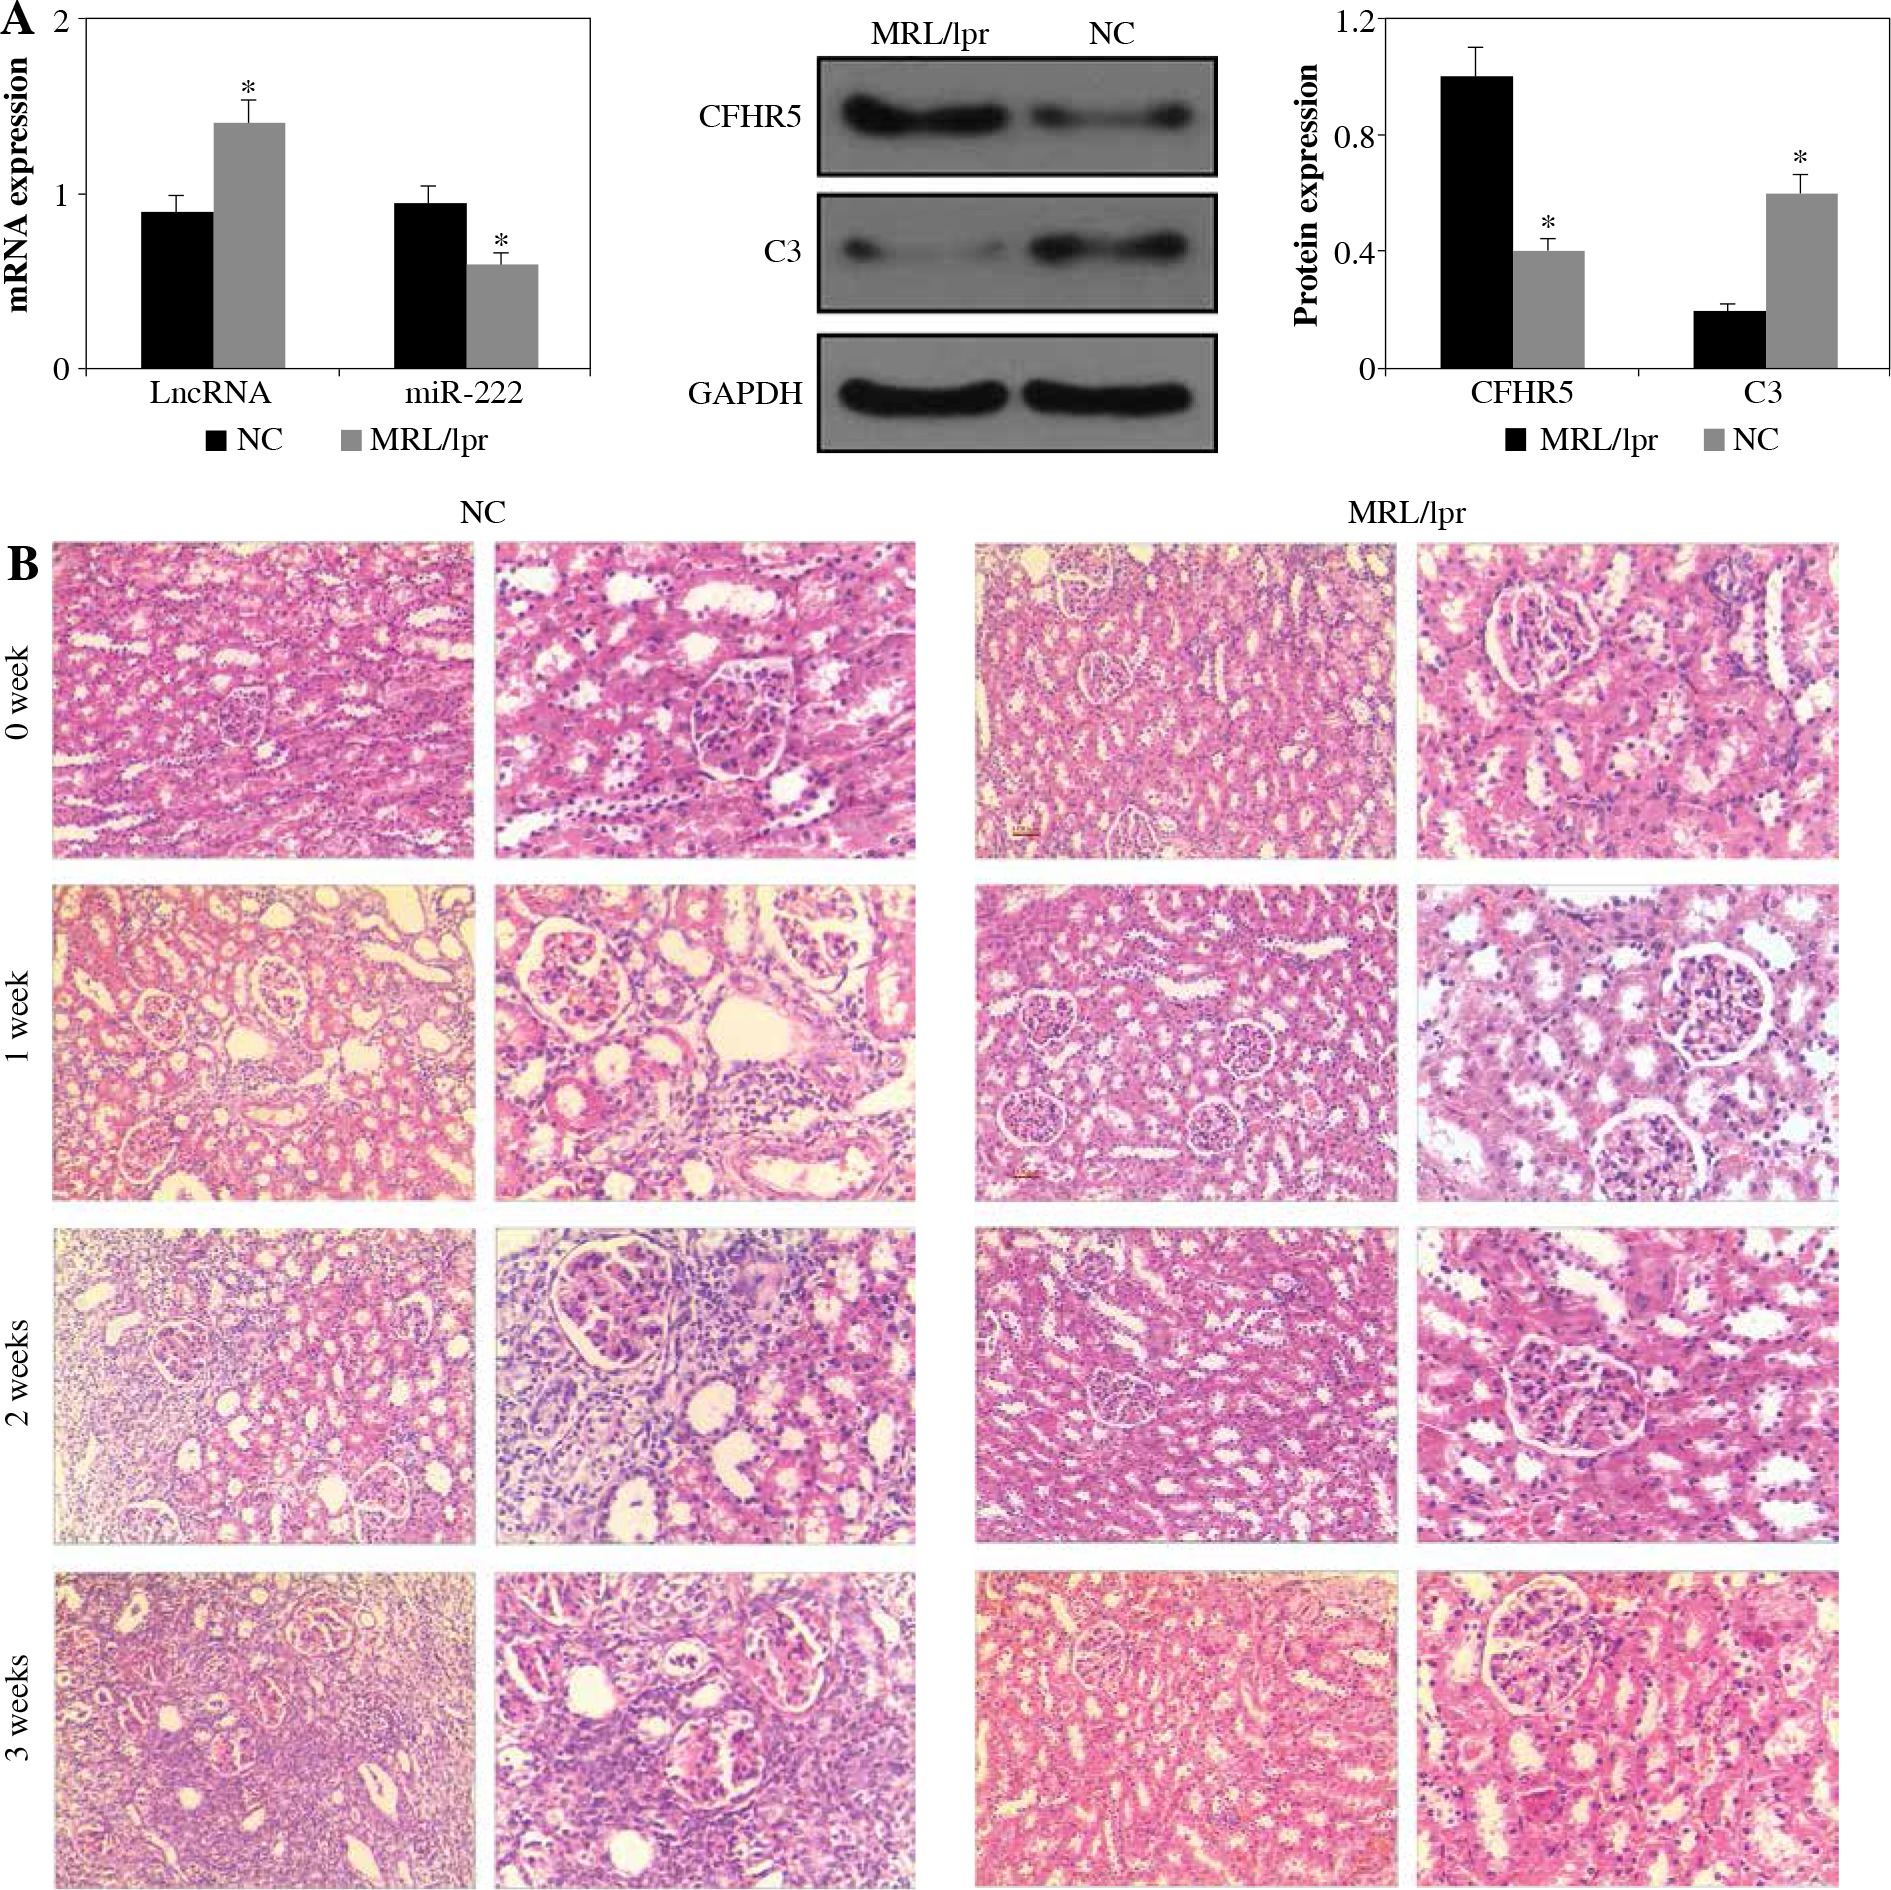
Fig. 2
A) LncRNA MIAT, miR-222, CFHR5, and C3 expressions in MRL/lpr group, no-load vector group and lncRNA MIAT treatment group. Data were expressed as mean ± SEM. *p < 0.05. B) H&E staining in kidneys of the MRL/lpr group, no-load vector group and lncRNA MIAT treatment group C) LncRNA MIAT, miR-222, CFHR5, and C3 expression in MRL/lpr group, no-load vector group and miR-222 treatment group. Data are expressed as mean ± SEM.*p < 0.05. D) H&E staining in kidneys of the MRL/lpr group, no-load vector group and miR-222 treatment group
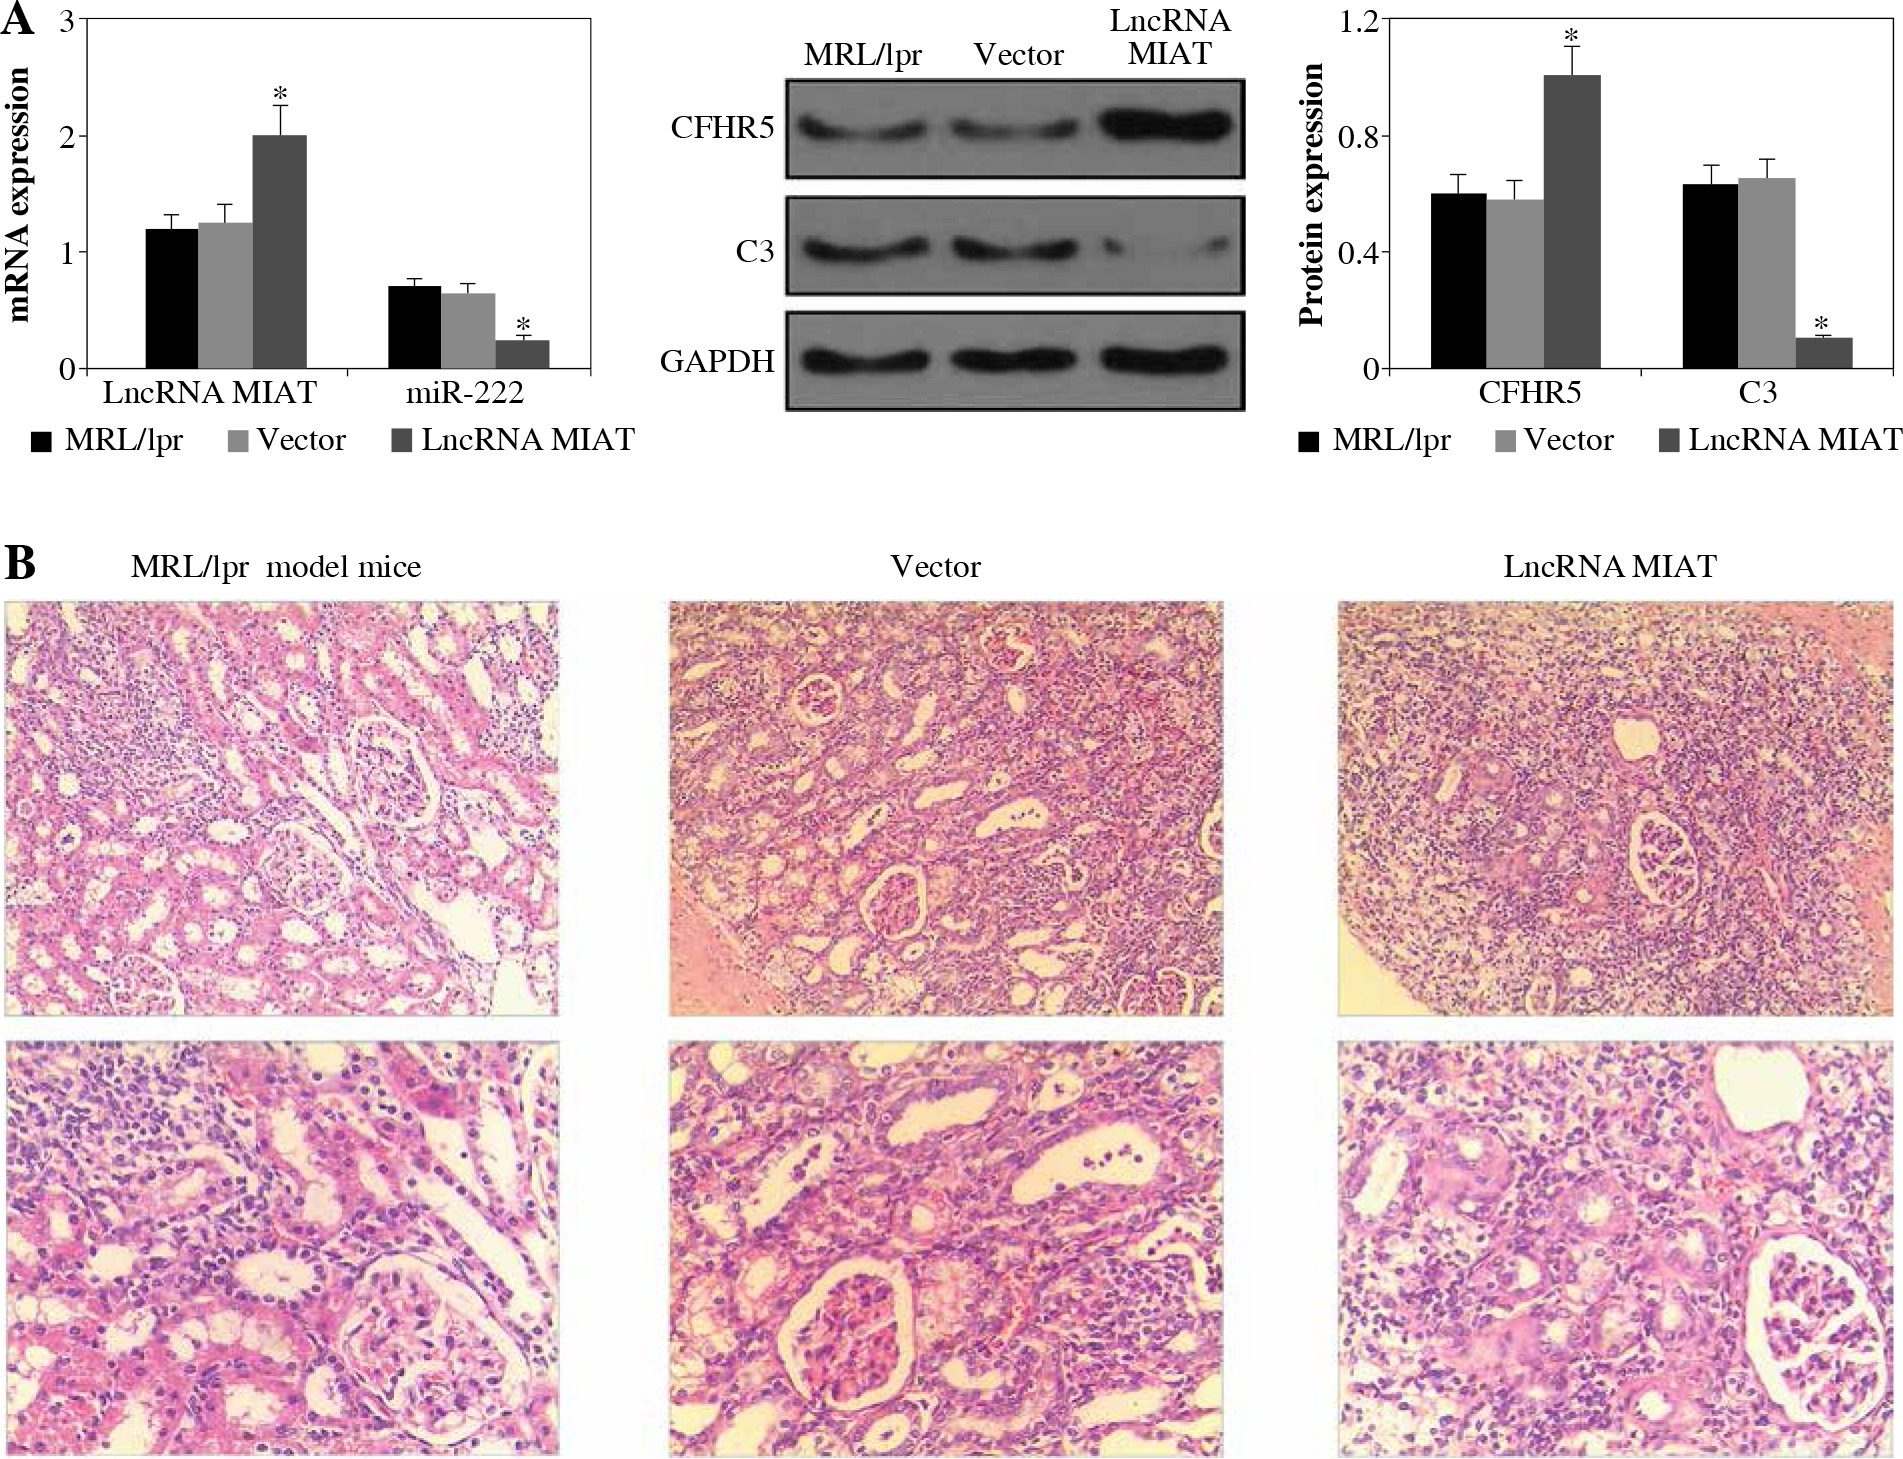
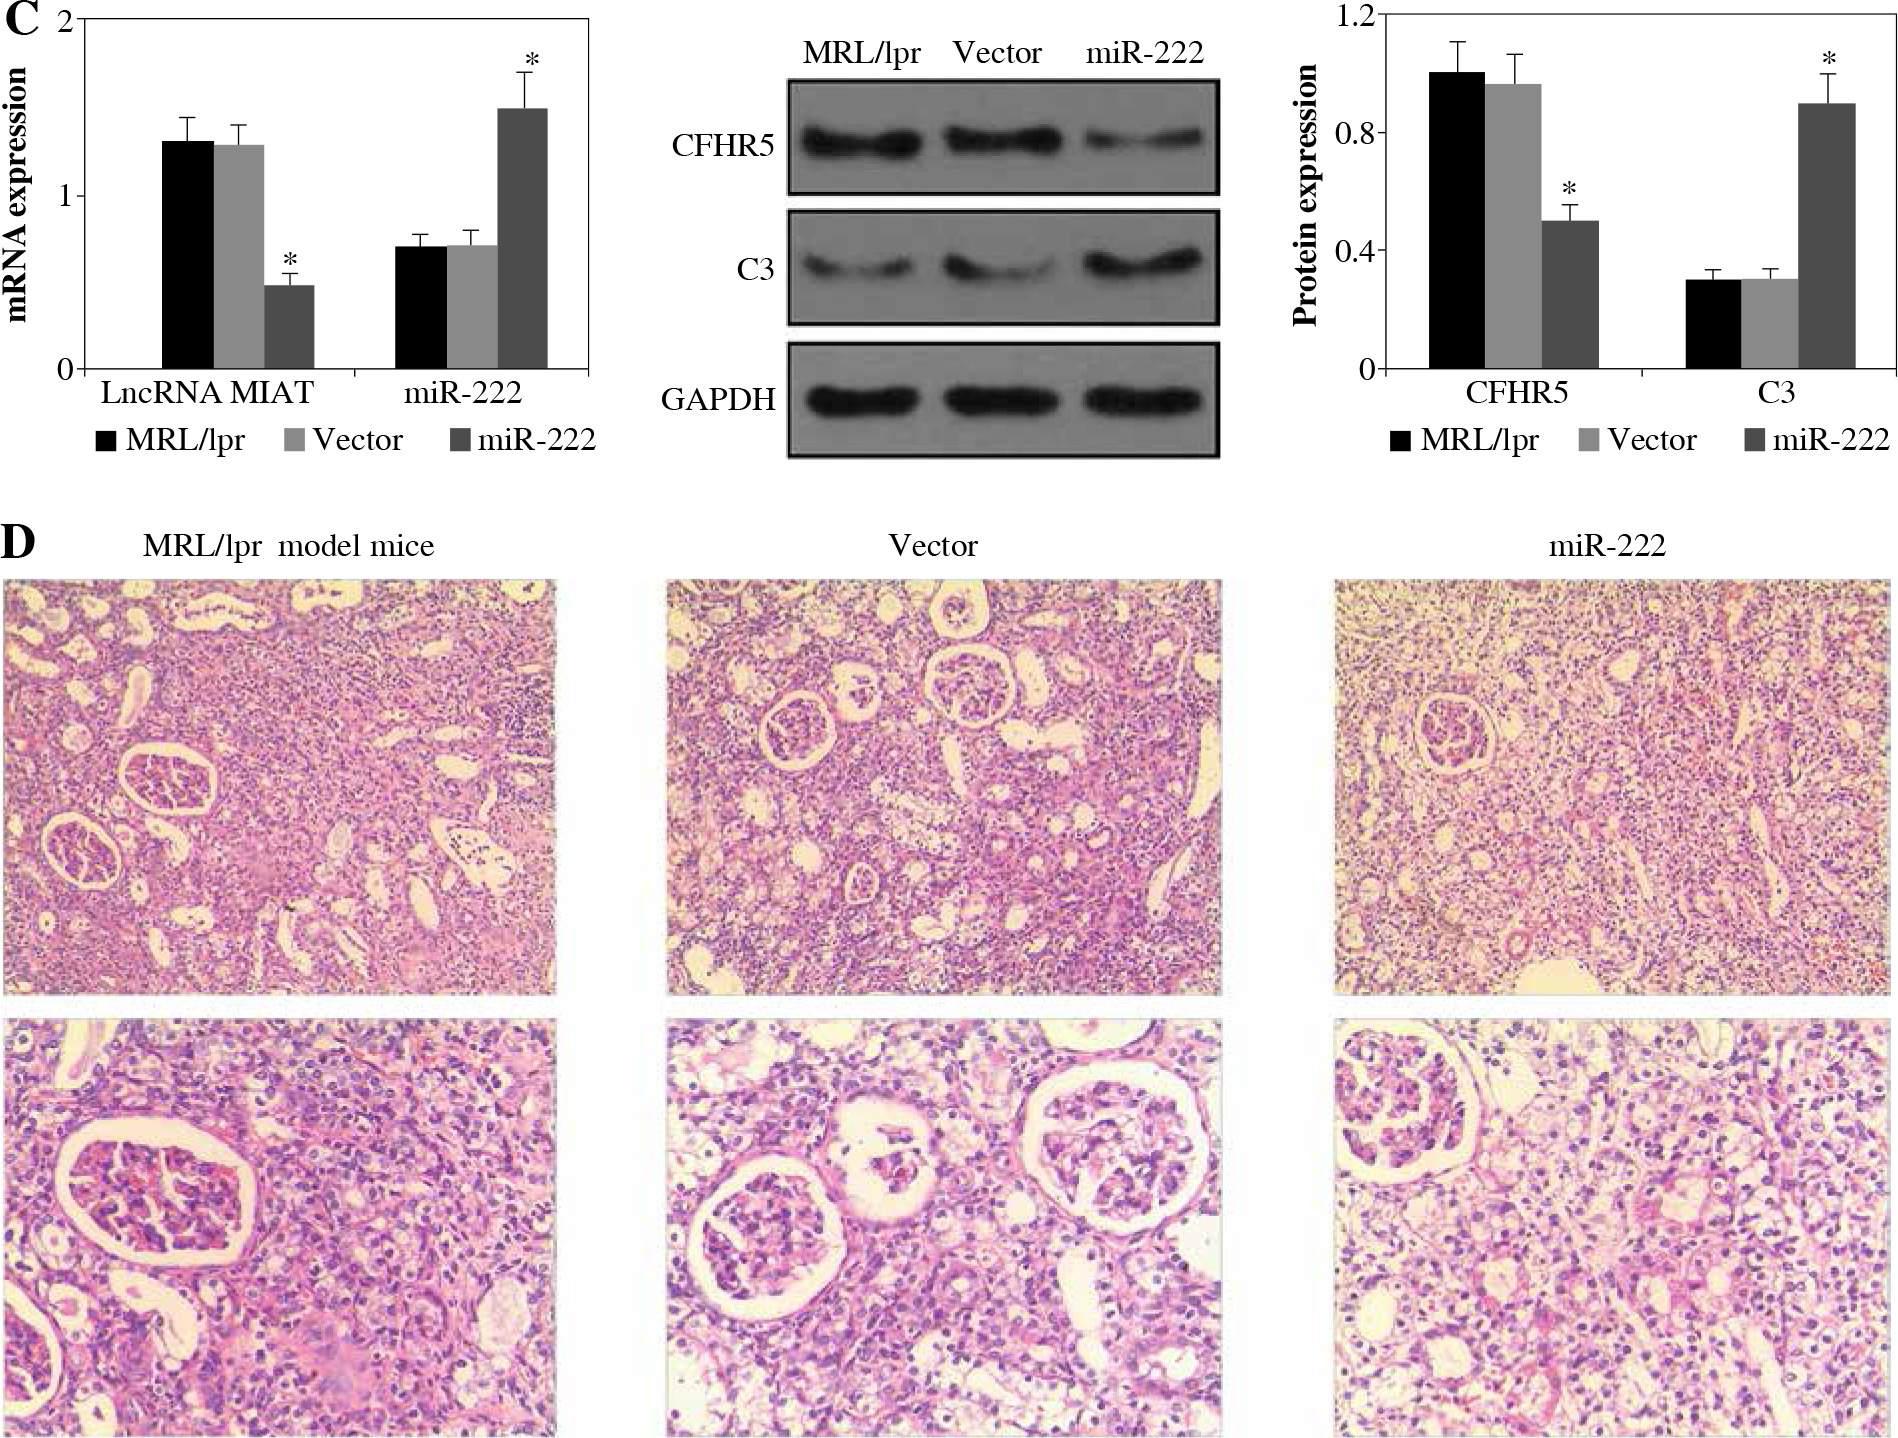
Table 4
dsDNA positive rate between different mice groups [n (%)]
LncRNA MIAT was a competitive inhibitor of miR-222 in vivo
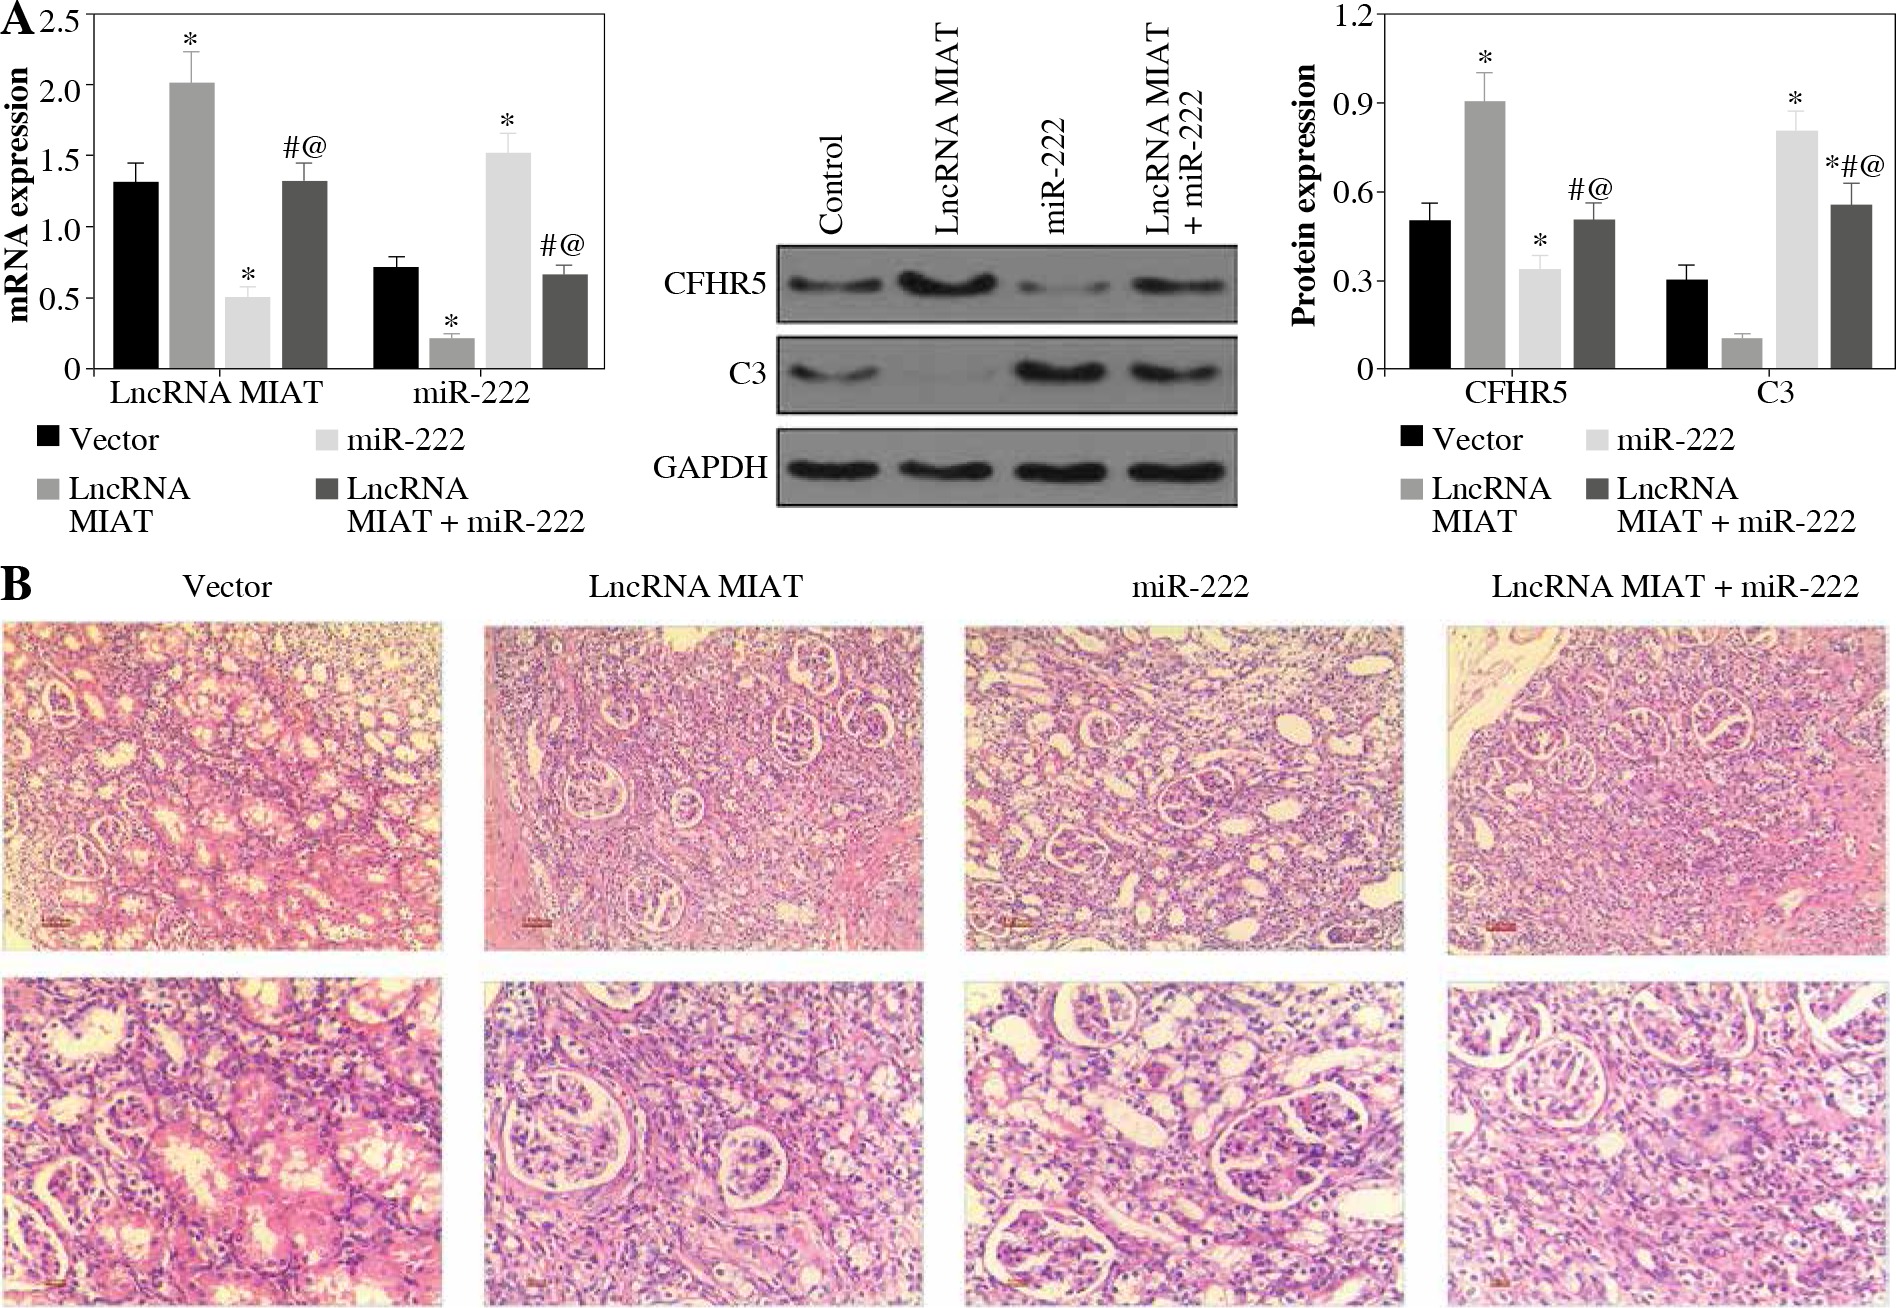
LncRNA MIAT and CFHR5 expression (Fig. 3A), and positive anti-dsDNA level (Table 4) were lower, while C3 (Fig. 3A) was higher in the miR-222 group in comparison with the MRL/lpr group and vector group, suggesting that lupus disease activity was alleviated in the miR-222 group. In contrast, mice in the lncRNA MIAT group expressed extremely high levels of CFHR5 and anti-dsDNA and a very low level of C3 in comparison with the control group (Fig. 3A and Table 4). Therefore, we wondered if lncRNA MIAT worked as a CeRNA to regulate the expression of CFHR5 via miR-222. To test this hypothesis, lncRNA MIAT + miR-222 plasmids were injected via the tail vein. The results showed that SLE disease activity index C3 in the lncRNA MIAT + miR-222 treatment group was similar to the one in the control MRL/MPJ group (Fig. 3A). Furthermore, H&E staining showed fewer pathological characteristics and more normal cells in the lncRNA MIAT + miR-222 treatment group compared with the no-load vector group and control MRL/MPJ group (Fig. 3B).
Fig. 3
A) LncRNA MIAT, miR-222, CFHR5, and C3 expressions in no-load vector group, lncRNA MIAT treatment group, miR-222 treatment group and lncRNA MIAT + miR-222 treatment group. Data are expressed as mean ± SEM. *p < 0.05 compared to the control, #p < 0.05 compared to lncRNA MIAT, @p < 0.05 compared to miR-222. B) H&E staining in kidneys of the no-load vector group, lncRNA MIAT treatment group, miR-222 treatment group and lncRNA MIAT + miR-222 treatment group
LncRNA MIAT and CFHR5 protein increased while miR-222 decreased in SLE patients
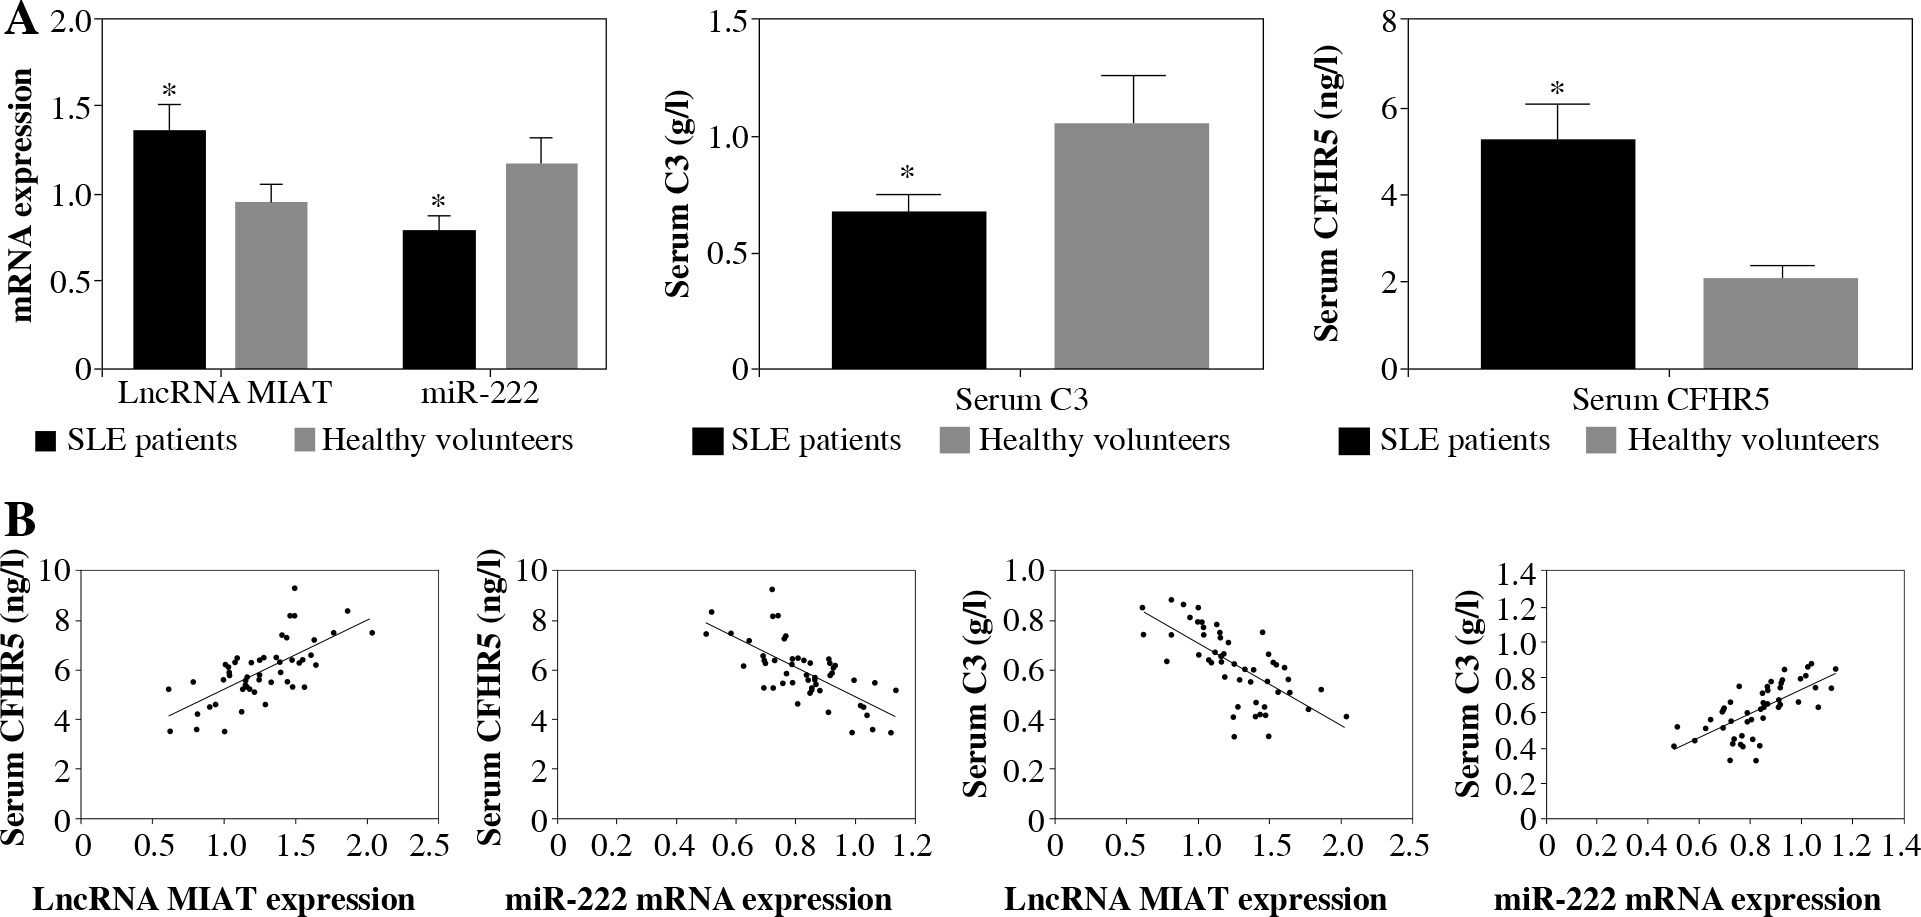
LncRNA MIAT and miR-222 gene expression levels were assayed by qRT-PCR, while CFHR5 and C3 protein expression levels were analyzed by ELISA kits using blood samples from 50 SLE patients and 50 healthy controls. C3 protein level was decreased in SLE patients in comparison with healthy controls. Moreover, miR-222 expression was negatively correlated with lncRNA MIAT level in SLE patients, since LncRNA MIAT was significantly higher while miR-222 was significantly lower in SLE patients than in healthy volunteers (Fig. 4A). In agreement with lncRNA MIAT, CFHR5 expression was up-regulated in SLE patients in comparison with healthy controls (Fig. 4A). Furthermore, the correlation analysis showed a positive correlation between miR-222 and C3, a negative correlation between miR-222 and CFHR5, a positive correlation between lncRNA MIAT and CFHR5, and a negative correlation between lncRNA MIAT and C3 (Fig. 4B).
Fig. 4
A) mRNA expression of lncRNA MIAT and miR-222, and CFHR5 and C3 serum levels in patients with SLE and healthy controls. *p < 0.05 compared to healthy controls. B) Correlation analysis between lncRNA MIAT, miR-222, CFHR5, and C3. A positive correlation was observed between lncRNA MIAT and CFHR5, a negative correlation between miR-222 and CFHR5, a positive correlation between lncRNA MIAT and C3, and a negative correlation between miR-222 and C3 in patients with SLE
Discussion
Systemic lupus erythematosus is a complex autoimmune disease with diverse clinical manifestations [2]. Patients with SLE usually express a high anti-dsDNA antibody level and low complement protein C3 level [10, 11]. Since SLE is generally considered as a model of systemic autoimmune disease, complement activation is thought to be involved in the tissue damage in the pathogenic process of SLE [2, 22].
The results in the present study revealed that CFHR5 expression in serum was significantly increased in patients with SLE in comparison with the healthy control, and its level was negatively correlated with complement protein C3. In addition, higher SLE disease activity index and anti-dsDNA were accompanied by higher CFHR5 expression. Furthermore, H&E staining showed that pathological characteristics such as thickened vascular walls, thickened/damaged intima and thickened tunicae media vasorum were often present when high CFHR5 was highly expressed, suggesting that CFHR5 expression was positively correlated with the severity of SLE. The results found in both model mice and patients were consistent and were in accordance with studies reported previously [6, 10, 11, 13, 23, 24]. Noncoding RNAs fulfil essential roles in the development of human diseases, providing potential targets for disease prevention and treatment. Among them, lncRNAs have been recently identified as key participants in certain types of pathological responses, generally acting as miRNA sponges to modulate gene expression [25]. The identification and regulation of the association of lncRNAs with certain diseases and the targets of lncRNA have attracted increasing attention. However, the expression profile and function of lncRNA such as CeRNA [12] in human SLE remain largely unknown.
Therefore, how lncRNA MIAT regulates the expression of CFHR5 in SLE was investigated in the present study. LncRNA MIAT treatment reduced the expression of miR-222, while CFHR5 was much higher in MRL/lpr mice than in MRL/MPJ mice. In addition, H&E staining showed more glomerular interstitial and vascular injury in the kidney of MRL/lpr mice than control mice, indicating that lncRNA MIAT enhanced lupus disease activity by upregulating CFHR5 expression via miR-222 degradation in vivo. In contrast, miR-222 treatment reduced CFHR5 expression and increased C3 expression along with fewer pathological characteristics, such as glomerular interstitial or vascular injury, as shown by H&E staining of kidney tissues, indicating that miR-222 alleviated lupus disease activity by reducing CFHR5 level in vivo. When treated with lncRNA MIAT + miR-222, anti-dsDNA positive level, and C3 and CFHR5 expression were almost the same as in the mice of the control MRL/MPJ group, as shown by H&E staining. Collectively, our results demonstrated that lncRNA MIAT was a competitive inhibitor of miR-222 in vivo, since inhibition of mRNA CFHR5 degradation by miR-222 led to C3 decrease and eventually lupus exacerbation.
Therefore, our results provide evidence associated with the pathogenesis of SLE, potentiating new approaches to the diagnosis and treatment of this disease. However, results from experiments that only used an MRL/lpr mouse model and samples from SLE patients to confirm the relationship between pathogenic markers and disease status and the pathogenic mechanism are rare, and further studies are warranted to elucidate the mechanism of the disease development. For example, lncRNA MIAT regulation mechanisms and the interaction between lncRNA MIAT, miR-222, mRNA CFHR5 and C3 should be studied at a molecular level to confirm the role of lncRNA MIAT in the SLE disease development process.
Overall, our study for the first time demonstrated that lncRNA MIAT enhanced lupus disease activity by upregulating CFHR5 expression via miR-222 degradation in vivo, and may provide new evidence to develop therapeutic options for SLE and novel insights into the understanding of the mechanisms involved in the CeRNA hypothesis.