


Septic shock, similar to other types of circulatory shock, is characterised by peripheral hypoperfusion and, consequently, inadequate tissue oxygen deli-very. It is commonly believed that intravenous fluid infusion improves organ perfusion and reverses cellular dysoxia. This belief might be valid in the early phase of septic shock, and some earlier studies [1] and international recommendations (Surviving Sepsis Campaign) [2] support this view. The physio-logical rationale behind fluid bolus administration is that it causes intravascular volume expansion. According to the Frank-Starling principle, increased left ventricular end-diastolic volume (i.e., preload) increases stroke volume (SV), resulting in improved organ perfusion. This mechanism works until the optimal preload is achieved. However, the pathophysiology of septic shock is complex and comprises both distributive and cardiogenic components. At the peripheral level, the inflammatory process in sepsis damages the endothelial glycocalyx [3] and increases small vessel permeability. This results in fluid leakage to the interstitial compartment, organ oedema, and further worsening of peripheral perfusion. Fluid overload can negatively contribute to these processes.
Additionally, increased cardiac preload in patients already on the flat part of the Starling curve may worsen already impaired cardiac function [4]. Thus, with abnormal blood flow distribution in the capillaries and compromised cardiac function, volume expansion can lead to further impairment of both peripheral and central circulation. It is estimated that only half of septic patients respond to fluid administration [5]. Several recent studies have demonstrated that fluid overload in septic patients is associated with organ dysfunction [6] prolonged mechanical ventilation [7, 8] and intensive care unit (ICU) stay [7, 9], and higher mortality rates [10–12].
Considering these recent reports on fluid overload in septic shock, assessment of which patient would benefit from fluid bolus administration is crucial. For years, optimization of fluid management has been based on the assessment of vital signs, laboratory tests (serum lactate level, mixed venous oxygen saturation), physical examination, and static assessment of cardiac preload, such as central venous pressure (CVP) and pulmonary capillary wedge pressure (PCWP) [13]. However, several of these variables failed to reliably predict the haemodynamic response to fluid load [14].
In contrast, “dynamic” indicators have been proposed to assess preload responsiveness. This approach involves the induction of a change in cardiac preload and the measurement of its effects on SV. Consequently, two conditions must be met for such measurements. First, a bedside method for the assessment of SV or other variables associated with SV must be available. Second, cardiac preload must be challenged. The latter can be obtained by either a fluid provocative stimulus or a heart-lung interaction during mechanical ventilation. In this review, we describe several methods used to assess SV that are currently used in clinical practice and present static and dynamic indicators of fluid responsiveness (FR). Furthermore, we indicate the methods that potentially lead to haemodynamically guided, fluid restrictive treatment that would prevent fluid overload in septic patients.
MEASUREMENTS OF CARDIAC STROKE VOLUME
Several methods with varying invasiveness are available for the estimation of SV. According to Geerts et al. [15] the optimal method should be “accurate, precise, operator independent, fast responding, non-invasive, continuous, easy to use, cheap and safe”. However, standard methods, including Fick and indicator dilution techniques, require an invasive pulmonary artery catheter. In clinics, the Swan-Ganz catheter, which allows intermittent cardiac output (CO) monitoring, has been used as a reference for years [16]. Its newer version, which provides continuous CO measurement, is based on the continuous pulmonary thermodilution technique. Small amounts of thermal energy are transported into the blood and are detected by a thermistor in the pulmonary artery. Because changes in temperature are minimal, the measurements make extensive use of averaging techniques [15]. Therefore, the displayed value of CO (SV) is an average value taken over a 5-min period and not beat-to-beat measurement [17]. The method has been described as “continuous but not instantaneous” [15] and might not be suitable for assessment of the short-lived effect of fluid challenge on SV. Furthermore, the safety and cost-effectiveness of Swan-Ganz catheters have recently been questioned [18].
Hence, less invasive monitoring options have gained popularity. Transpulmonary thermodilution (TPTD) is a modification of the above-mentioned pulmonary artery catheterization, where cold saline is injected in a central vein instead of the right atrium and the blood temperature is measured in a systemic artery instead of the pulmonary artery [19, 20]. TPTD is easier to implement than the Swan-Ganz catheters; however, the measurements might be less accurate [20]. Other less-invasive monitoring options are based on arterial waveform analysis; they are referred to as the pulse contour analysis or pulse power analysis (for differences and details, please see elsewhere [21]). They usually still require peripheral artery access, and some of these methods that use calibration require an additional central line catheter. Peripherally derived pulsation of arterial pressure is then put into one of the algorithms to fit the model of aortic pressure and further converted from a central pressure variable into a volume variable (i.e., SV) [15]. Depending on the algorithm used and the calibration method, devices made by different manufacturers have different precision or trending ability [22, 23]. Systems that use this indirect method and require external calibration include the PiCCO system (Pulsion Medical Systems, Munich, Germany) and the EV1000 VolumeView monitor (Edwards Lifesciences, Irvine, CA, USA), both calibrated with TPTD. Another device, the LiDCO Plus System (LiDCO, Cambridge, UK), utilises the lithium bolus indicator dilution method of measuring CO. Systems that use autocalibration where the software calculates individual aortic compliance and systemic vascular resistance based on patients’ height, weight and sex are the FloTrac sensor (Edwards Lifesciences, Irvine, CA, USA) and ProAQT/Pulsioflex (Pulsion Medical Systems, Munich, Germany). Autocalibrated systems are not reliable in the estimation of absolute values of CI, especially in a hyperdynamic condition like sepsis [24]. Their ability to track the fluid-induced and norepinephrine-induced changes in CI appear to be unsatisfactory [25, 26]. However, there is a clear trend for increased accuracy with improved algorithms in newer devices [24, 27]. Meanwhile, externally calibrated systems have better accuracy, even when arterial tone is significantly changed by vasopressor use [25].
Another minimally invasive continuous measurement of SV (CO) in real time is oesophageal Doppler monitoring (e.g., ODM+, Deltex Medical, Chichester, UK). A unidirectional continuous-wave Doppler transducer probe inserted into the distal oesophagus measures the blood flow in the descending aorta. A similar method can be fully non-invasive through transthoracic Doppler echocardiography. To measure SV, the velocity of blood flow (typically sampled in the outflow tract below the aortic valve) must be integrated over one entire heartbeat (velocity time integral, VTI) and multiplied by the cross-sectional area of the left ventricular outflow tract (LVOT). Since normally the LVOT does not change over time, any change in VTI is strictly proportional to the change in cardiac SV. A VTI of 18–22 cm reflects normal cardiac contractility [28]. Both approaches (oesophageal and transthoracic) appear to be relatively operator-dependent and sometimes technically difficult [29].
Other, entirely non-invasive methods that are currently being investigated are based on different measurement techniques, such as dynamic changes in the pulse oximeter waveform (Masimo, Irvine, USA), pulse wave transit time analysis (esCCO, Nihon Kohden, Japan), continuous non-invasive arterial pressure technology (NICCI, Getinge, Sweden), non-invasive analysis of arterial pressure waveform (Clear Sight, Edwards Lifesciences, Irvine, USA), and analysis of transthoracic impedance and bioreactance (Starling Fluid Management System, Baxter International, Deerfield, USA). The latter method is based on the assumption that fluctuations in aortic blood volume during the cardiac cycle induce changes in the electrical conductivity of the chest. These changes can be detected by the skin electrodes after applying a low-amplitude high-frequency current. Analysis of frequency modulation and signal phase shift of the current crossing the thoracic cavity allows for the estimation of SV [30]. Guided by bioreactance, initial fluid resuscitation in septic patients is associated with a lower fluid balance and better outcomes [31].
DYNAMIC MEASUREMENTS OF FLUID RESPONSIVENESS
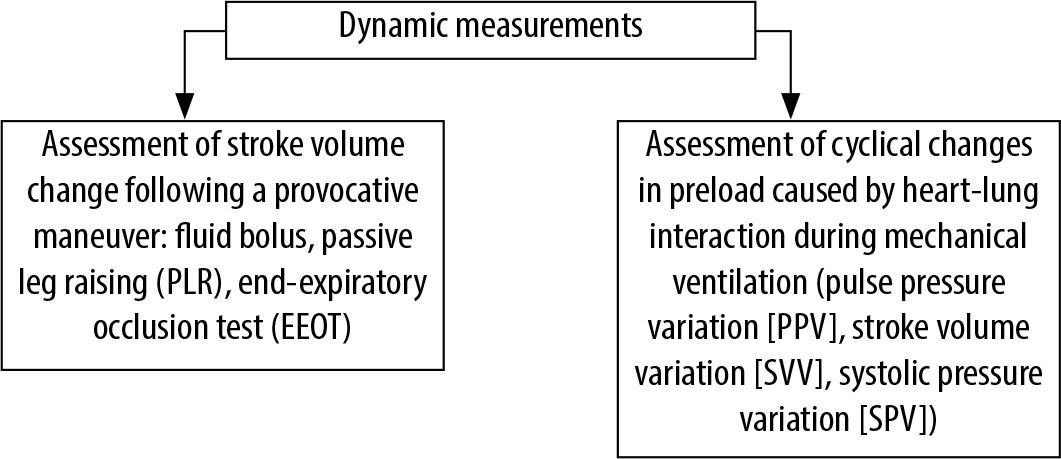
The concept of FR is based on the assumption that fluid administration may increase peripheral perfusion by increasing cardiac SV. Having one of the abovementioned methods assessing SV, cardiac preload challenge can be performed. Generally, two different techniques that challenge the preload can be distinguished (Figure 1). The first is based on either “external” (by means of intravenous fluid administration) or “internal” (displacement of blood volume) expansion of circulating volume that would increase cardiac preload. The latter can be achieved by either passive leg raising (PLR) or the end-expiratory occlusion test (EEOT). The second technique relies on cyclic changes in the preload caused by the heart-lung interaction during mechanical ventilation. This group can be further divided into methods that measure volume (i.e., SV), pressure (i.e., pulse pressure), or variation in inferior vena cava (IVC) size, as a result of intrathoracic pressure changes.
DYNAMIC MEASUREMENTS BASED ON FLUID CHALLENGE
Classically, fluid challenge is performed by rapidly administering 250–500 mL of fluid (7 mL kg-1) in less than 30 min [32–34]. A 15% increase in SV (CO) indicates FR [33, 35]. Modified current recommendations include a lower initial volume (4 mL kg-1) [33, 36] and a shorter infusion time (5–10 min) [37, 38]. The assessment should be performed 1 min after the end of the bolus infusion [37], as long-lasting effects persist only in half of fluid responders [39]. Such a challenge repeated often during the early phase of septic shock can quickly lead to uncontrolled fluid overload [40]. To minimise this effect, a mini-fluid challenge, in which 100 mL of fluid is administered over 1 min, has been proposed [41]. A 5% increase in SV predicts FR with good reliability (Table 1) [42]. Several indices can be monitored in response to fluid bolus, such as SV, and several of its derivatives, such as CO, cardiac index (CI), VTI, and end-tidal carbon dioxide (EtCO2) [28, 31, 43]. The latter is sensitive to CO fluctuations under stable metabolic conditions and constant minute ventilation [44]. An increase in EtCO2 of 2 mmHg (5%) or more, followed by fluid bolus, has been demonstrated as a diagnosis for FR [43]. Another study reported that an increase in the VTI of more than 10% could predict FR after mini-fluid challenge [45].
TABLE 1
Predictive values of dynamic indices of fluid responsiveness
| Cardiac stroke volume changes due to provocative manoeuvres | |||||
|---|---|---|---|---|---|
| Test | Threshold | Sensitivity (95% CI) | Specificity (95% CI) | AUC | References |
| Mini-fluid challenge | 5% | 0.82 (0.76–0.88) | 0.83 (0.77–0.89) | 0.91 | Messina, 2019 [42] |
| PLR | 10% | 0.85 (0.81–0.88) | 0.91 (0.88–0.93) | 0.95 | Monnet, 2016 [52] |
| EEOT | 5% | 0.86 (0.74–0.94) | 0.91 (0.85–0.95) | 0.96 | Messina, 2019 [42] |
| Changes of dynamic variables due to heart-lung interaction | |||||
| Parameter | Threshold | Sensitivity (95% CI) | Specificity (95% CI) | AUC | References |
| SVV | 12% | 0.83 (0.75–0.88) | 0.85 (0.78–0.90) | 0.90 | Alvarado Sánchez, 2021 [20] |
| PPV | 10% | 0.74 (0.66–0.81) | 0.77 (0.70–0.83) | 0.82 | Alvarado Sánchez, 2021 [20] |
| Tidal volume challenge | 3% | 0.9 (0.76–0.97) | 0.87 (0.31–0.99) | 0.92 | Alvarado Sánchez, 2021 [20] |
| SPV | 7.5% | 0.92 (NA) | 0.87 (NA) | 0.91–0.93 | Jalil, 2018 [81] |
| SPV (∆down) | > 5 mmHg | 0.86 (NA) | 0.86 (NA) | 0.92 | Preisman, 2005 [71] |
PLR is performed by tilting a patient from a 45-degree semi-recumbent head-up position to a 45-degree leg-up position or by lifting the legs passively from the horizontal position. This manoeuvre transfers up to 300 mL of blood from the lower limbs and abdomen into the intrathoracic compartment [46] and induces significant changes in cardiac preload. It can be implemented in either spontaneously breathing or mechanically ventilated patients and can often be repeated [47]. The method has been validated in numerous studies [48], has been recommended by the Surviving Sepsis Campaign [49], and was appraised by the European Society of Intensive Care Medicine [50]. However, the haemodynamic effect of PLR lasts approximately 1 min and requires fast and efficient assessment [51].
The most reliable methods for assessing FR during PLR are those that continuously measure indirectly (e.g., based on pulse contour analysis) or directly (e.g., echocardiography) several indices such as CO, CI, or SV [52]. The FR following PLR can be identified with a 10% increase in one of these indices (Table 1) [52]. The suggestion that increased intra-abdominal hypertension reduces the credibility of PLR [53] remains controversial [52]. However, this method is contraindicated in patients with head trauma and is unreliable in patients with elastic compression stockings [54]. It should be noted that the blood pressure transducer must be maintained at a fixed level with the heart when PLR is performed from a semi-recumbent position. If it is technically difficult, then the manoeuvre could be initiated with the patient in a supine position (before lifting the legs); this is considered as equally sufficient [55, 56].
EEOT is another technique that does not require fluid infusion for temporary preload increase and FR assessment. It can only be performed in mechanically ventilated patients whose cardiac preload is cyclically distracted by intrathoracic positive pressure. The interruption of this effect at the end of the expiration phase for at least 12 s [57] results in increased venous return (VR) that results in increased SV; however, other studies indicate a longer expiration phase at 15 s [58,59]. The threshold for SV change for FR has been 5% (Table 1) [42, 58, 60, 61], and the accuracy of EEOT, regardless of ventilator settings and me-thods of CO (SV) measurement, has been confirmed by a recent meta-analyses [20, 57, 61]. The reliability may be affected when the test was performed in a prone position, as indicated by a previous study [61].
DYNAMIC MEASUREMENTS BASED ON HEART-LUNG INTERACTION
The approach taken to avoid unnecessary fluid expansion to assess FR is the evaluation of parame-ters based on heart-lung interaction during mechanical ventilation. Variations in flow- and pressure-derived variables of cardiac function, such as SV variation (SVV), pulse pressure variation (PPV), and systolic pressure variation (SPV) [62], during mechanical ventilation are considered to be an indicator of a patient’s current position on the Frank-tarling curve. Increased intrathoracic pressure induced by a ventilator during insufflation decreases right ventricular preload, which transmits further to the left ventricle and results in decreased left ventricular SV (and aortic pressure). Thus, cyclic positive pressure ventilation can act as a provocative test to assess changes in SV and its surrogates. Significant changes suggest that the ventricles are preload-dependent and indicate FR.
SVV is an indirect measure of left ventricular SV derived from the analysis of the pulse contour of the arterial pressure waveform. Usually, pulse analysis is obtained by the arterial line. However, other methods such as volume-clamp photoplethysmography [63] can also be used, but with lower reliability [64]. Because systemic vascular resistance is relatively constant during a few cycles of respiration, changes in SV are directly reflected in arterial pulse pressure changes [65]. Therefore, other parameters based on pressure variations have been useful in predicting FR.
PPV is the ratio of the difference between the maximal and minimal values of pulse pressure over the mean of these two values and is expressed as a percentage. Some studies have demonstrated that PPV might be superior to SVV in FR prediction [62, 66], while others found a contrary relationship [20]. This might be attributed to the method of measurements, that is, PPV directly assesses arterial pressure, whereas SVV reflects an indirect measure of SV derived from pulse contour. Traditionally, values of both parameters higher than 13–14% identify FR [67]. Ways on how to interpret PPV values between 10% and 14% remain controversial. A previous meta-analysis found that the median threshold of PPV is 12% (interquartile range: 10–13%), with a sensitivity of 0.88 and a specificity of 0.89 [68]. The authors concluded that PPV > 13% suggests FR, whereas PPV < 10% indicates fluid unresponsiveness. However, a more recent meta-analysis describing the operative performance of FR predictors indicated that the PPV threshold was 10% and the SVV threshold was 12% (Table 1) [20]. A decrease of 1–2% from the initial values during a mini-fluid challenge also demonstrated good ability to predict FR [20, 69].
The second pressure dynamic parameter is SPV. Positive pressure inspiration reducing venous return decreases the right ventricular end-diastolic volume, reducing SV. This reduction in right ventricular SV decreases left ventricular end-diastolic volume after a phase lag of a few heartbeats due to the pulmonary vascular transit time. This results in reduced left ventricular SV, which becomes evident during the expiratory phase. Consequently, the left ventricular SV is maximal during inspiration and minimal during expiration under positive pressure ventilation. At the end of expiration, it reaches a plateau value (baseline). This phenomenon enables the calculation of SPV, which is defined as the difference between the maximal and minimal systolic blood pressure values during one mechanical breath [70]. It constitutes the sum of two components: ∆up (maximal systolic arterial pressure minus systolic arterial pressure at the end of expiration [baseline]) and ∆down (systolic arterial pressure at the end of expiration [baseline] minus minimal systolic arterial pressure). ∆down reflects the decrease in left ventricular ejection volume due to the increase in intrathoracic pressure. It has been found that ∆down > 5 mmHg is a reliable predictor of FR (Table 1) [70, 71]. It is not recommended to only interpret SPV without its components because its increase could be caused by either an increase in ∆down or an increase in ∆up. An increase in ∆down would indicate hypo-volaemia while an increase in ∆up (and the absence of ∆down) would indicate hypervolaemia or congestive heart failure; hence, further fluid load would be contraindicated [70, 72]. SPV is often determined manually, and it would probably be ousted by indices calculated digitally in real time [73].
The aforementioned dynamic measurements based on lung-heart interaction can be implemented only in a minority of ICU patients [74], including those who are mechanically ventilated, with no spontaneous respiration, who are sedated, and with sinus rhythm, normal lung compliance, normal intra-abdominal pressure, and normal right heart function [75, 76]. Low tidal volume (TV) ventilation does not appear to be a limitation [20, 77]. Recent meta-analyses revealed that both SVV and PPV have fair operative performance even with low TV (i.e. < 8 mL kg–1) and neither PEEP nor driving pressure influences measurements [20, 77]. However, other reviews and studies indicate that high TV ventilation is required for accurate FR predictions [78–81]. When low TV ventilation is used, it has also been proposed to perform a tidal volume challenge. This is described as a transient (lasting 1 min) increase in TV (from 6 mL kg-1 to 8 mL kg-1). A change in PPV greater than 3.5% or change in SVV greater than 2.5% predicts FR with high accuracy [82].
SVV and PPV are also less accurate in patients supported with inotropic agents and vasopressors [83, 84]. This might be due to increased vasomotor tone, that is, arterial elastance and compliance, thus invalidating the assumed algorithm variables [76]. On the other hand, factors such as method of measurements (Swan-Ganz thermodilution rather than transpulmonary thermodilution), used threshold (lower rather than higher) and choice of critically ill patient (post-cardiovascular and those with septic shock rather than surgery patients) might increase operative performance of SVV and PPV [20].
Taken together, conflicting results regarding the usefulness of SVV and PPV in septic shock are observed. First, only a few ICU patients meet the inclusion criteria, such as no spontaneous breathing [74, 85]. Second, vasopressor support is used per definition in this group of patients. Nonetheless, several studies have demonstrated that these methods are feasible [86] and have fair operative performance [20]. They may also be reliable under some conditions in patients with spontaneous breathing [87]. However, other studies have considered them to be less accurate [88] and indicated a cautious approach; thus, additional studies are recommended [21].
The lung-heart interaction during mechanical ventilation is also expressed with variations in the diameter of the IVC; however, its measurement has limitations similar to those of the other variables in this group of measurements (e.g., requirement of high TV or no spontaneous respiratory activity). Furthermore, the previously described distensibility index of IVC ≥ 18% as a predictor of FR [89] was found to be unreliable in septic patients [90].
STATIC VARIABLES: INCREASE IN PRELOAD WITHOUT MEASURING STROKE VOLUME DOES NOT PREDICT FLUID RESPONSIVENESS
As mentioned, it has been clearly established that static parameters such as CVP and PCWP do not correlate with FR [33, 91, 92]. Despite this fact, their use for FR assessment in several clinical settings worldwide is still common [93]. Interesting facts and anecdotes regarding the controversies surrounding this concept can be found elsewhere [33]. However, a few physiological considerations related to static parameters are worth mentioning. According to the Frank-Starling mechanism, the heart can pump forward as much blood as returns to the heart. The amount of returning blood is called venous return (VR). The Guyton theory states that the preload depends on the pressure gradient between the capacitance vessels and the right atrium of the heart [94]. The capacitance vessels are veins located mainly in the splanchnic region and constitute the largest blood volume reservoirs in the body. The pressure in the capacitance (splanchnic) veins is called “mean systemic pressure” (MSP). CVP reflects pressure in the right atrium. The actual VR is calculated according to the following formula: VR = (MSP − CVP)/SVR, where SVR is the systemic vascular resistance. MSP is primarily regulated by the volume of blood in the capacitance vessels and the sympathetic tone in this vascular region [94]. The volume of blood contained in the splanchnic circulation that does not put pressure on the walls of the vessels is called an unstressed volume and acts as a blood reservoir to maintain VR. Any volume that exerts force on the vessel walls is called the stressed volume and determines the MSP. An increase in sympathetic tone (e.g., due to the use of vasopressors) results in a constriction of the splanchnic vascular bed and recruitment of stressed volume at the expense of unstressed volume [95]. Finally, an increase in the MSP results in an increase in VR. This mechanism explains why the use of vasopressors can rapidly influence several dynamic measurements such as PPV or SVV during surgery, without any fluid bolus administration.
To achieve the best VR and CO, the gradient between the MSP and CVP must be as high as possible. This is precisely obtained when CVP is low [94]. This theoretical explanation demonstrates that there is a poor association between CVP and VR [96]. Therefore, if VR equals CO, then CVP must also be a poor indicator of CO. Most importantly, even with the assumption that CVP is indicative of preload, it certainly does not answer which part of the Frank-Starling curve the patient is on. From a practical point of view, this means that a large increase in CVP after fluid loading indicates a rather flat part of the curve and a reduction in contractility. In contrast, little or no change in CVP, which results in increased heart contractility, indicates a positive response to fluid loading. Thus, changes in CVP due to fluid bolus should be assessed together with changes in SV (or CO). Without this measurement, the increase in CVP only indicates an increased preload, but the response remains unknown. Therefore, CVP changes due to fluid challenge provide hypothetical and unreliable information regarding its effect on SV.
PCWP provides an indirect measure of left atrial pressure. PCWP has a similar limitation to that of CVP, and multiple studies have demonstrated that this variable is unable to predict FR [92, 97]. For the same reason, another currently modern volume variable, providing reliable information on cardiac preload, that is, end-diastolic volume of four chambers of the heart (global end-diastolic volume; GEDV), fails to assess FR [98].
In summary, the above-mentioned static parameters are poor predictors of FR. However, they still provide some information on cardiac preload (not preload responsiveness) and can guide fluid administration to a limited extent: low values might indicate greater chances of CO increase in response to fluids, [38] and a large increase can help to decide when to stop fluid infusion [99].
Conclusions
The majority of patients with septic shock are fluid non-responders, and many of them experience fluid overload [13, 100]. In this context, international recommendations regarding fluid management in the early phase of septic shock are currently debated [101], and those regarding the later phase of septic shock are not clearly defined [102]. Simultaneously, numerous methods assessing FR have been developed. These methods are feasible and safe and successfully guide the restriction of fluid load in septic patients (ANDROMEDA trial) [103]. They have also been associated with lower net fluid balance, reduced need for renal replacement therapy and mechanical ventilation, and shorter hospital stay in septic patients when FR was used (FRESH trial) [13].
However, not all methods predicting FR are feasible for septic shock. Static measurements such as CVP have limited value in predicting FR with several authorities advocating stopping their use [75, 104]. However, they can still be valid in the initial assessment of cardiac preload [38, 99]. In contrast, dynamic measurements based on cardiac preload challenge and assessment of SV, which is gaining in popularity, appear to be more accurate. SV and its derivatives are assessed by different methods of continuous cardiac monitoring (minimally invasive based on pulse contour analysis or transoesophageal Doppler and non-invasive procedures based on bioreactance), or intermittent methods such as echocardiographic transthoracic measurement of VTI. The latter method, on one hand, requires technical skills and is time consuming. On the other hand, ultrasound techniques are becoming more popular in ICUs, and more intensivists have learned how to use them.
Assessment of heart-lung interaction for the prediction of FR is limited in septic shock patients because of common spontaneous breathing, low TVs during mechanical ventilation, and use of vasopressor support. Therefore, they should be interpreted with caution, and other clinical variables should be considered.
Classical fluid challenge based on large volumes easily leads to fluid overload during sepsis. The mini-fluid challenge is a solution, but it requires accurate methods to assess SV (or CO). The two methods mentioned in this review, PLR and EEOT, are safe and easy to perform. PLR is more universal and can be applied in a variety of clinical scenarios, including those outside the ICU. EEOT is performed in patients who are mechanically ventilated. The greatest strengths of both are as follows: they are accurate, can often be repeated, and do not lead to fluid overload.
In summary, fluid therapy should be haemodynamically guided by the available methods for predicting FR. Following Satterwhite’s statement, “Transitioning our dialogue to the identification of patients as fluid refractory, rather than labelling them as fluid responsive, may help curtail the reflex to give another bolus and ultimately achieve improved outcomes” [105], careful assessment of fluid benefit in septic patients before fluid bolus administration should become a daily clinical practice.