Introduction
Glioblastoma (GBM) is a high grade form of diffuse glioma and accounts for more than 45% of cases of malignant central nervous system tumors in adults [1]. The natural history of GBM is rapid and aggressive, leading to poor outcomes as the median overall survival (OS) of GBM was about 14 months and the 5-year survival was only 5.5% [2]. The existing treatment for GBM often involves surgery and concurrent radiation with chemotherapy [3]. Temozolomide (TMZ) is an alkylating agent currently used as first-line therapy in standard treatment of GBM [4]. Through crossing the blood-brain barrier readily and acting by methylation of DNA at specific sites on guanine and adenine bases, TMZ can efficiently inhibit DNA replication and induce apoptosis [5, 6]. However, previous research has shown that O-6-methylguanine-DNA methyltransferase causes GBM cell resistance to TMZ [7]. Thus, the usefulness of TMZ in GBM treatment is generally short-lived and improving the sensitivity of GBM cells to TMZ is a major objective for the successful treatment of GBM.
Currently, there is growing interest in combination therapy using multiple anti-cancer agents as a suitable solution to overcome drug resistance. Y15 is a kind of focal adhesion kinase (FAK) inhibitor newly developed as an additional treatment option for GBM, which specifically targets GBM motility and proliferation [8]. Moreover, in a study of Golubovskaya et al., it was found that the combination of TMZ and Y15 was more effective in retarding the deterioration of GBM than either agent alone [9]. The present study was carried out to gain an in-depth understanding of the molecular mechanisms of TMZ and Y15 in GBM.
With the booming development of high throughput sequencing and bioinformatics analysis, thousands of biomarkers that play crucial roles in human cancers have been identified. Gene set enrichment analysis (GSEA) exhibited excellent performance in analyzing differentially expressed genes (DEGs) in human cancers. Through GSEA and Gene Ontology (GO) analysis, Chai et al. built a gene signature with 5 GBM stem-like cell relevant genes which could predict the prognosis of GBM [10]. Cheng et al. profiled the immune-related gene set and 8 genes with prognostic value in GBM, and found that compared with low grade glioma, GBM exhibited an enhanced immune phenotype [11]. Gene set enrichment analysis and GO analysis also suggested that miR-130a could generate an extensive response to oxidative stress in glioma, thus mediating the resistance to TMZ of glioma cells [12]. In brief, bioinformatics analysis such as GSEA is effective in identifying key DEGs in GBM.
In this study, we performed GSEA analysis based on the microarray data from the Grace et al. study. We reported that down-regulation of the Fanconi anemia (FA) pathway and FANCD2 in TMZ + Y15 treated U87 cells promoted the sensitivity of U87 cells to TMZ in vitro.
Material and methods
Microarray analysis
The GSE43452 database (Supplementary Table SI) on the GPL10558 platform (Supplementary Table SII) that included GBM cell lines (DBTRG and U87) treated with focal adhesion kinase (FAK) inhibitor Y15 (10 μM), TMZ (20 µM) or with a combination of Y15 and TMZ was download from NCBI (https://www.ncbi.nlm.nih.gov/geo/query/acc.cgi?acc=GSE43452). Data of the untreated U87 cell line and U87 cell line treated with 20 µM TMZ + 10 µM Y15 were used as a discovery set. We downloaded the mRNA expression profiling of these samples for the bioinformatics analysis. The expression profiles were converted to the log2 scale using the R software package limma. The adjusted p-value was calculated by the Benjamin-Hochberg method. The screening condition of differentially expressed genes (DEGs) was |log2 (fold change)| > 1 and adjusted p < 0.05.
Gene set enrichment analysis
The GO terms, including GO_MF (molecular function), GO_BP (biological process) and GO_CC (cellular component), and the KEGG pathways altered in the untreated U87 cell line and TMZ + Y15 treated U87 cell line were investigated by GSEA. Data normalized from the mRNA expression profiles were imported to GSEA v3.0 software for GO and KEGG enrichment analysis. The GSEA reports and corresponding GSEA files were then imported into Cytoscape software (Version 3.6.0) to construct the enrichment maps of GO_BP, GO_CC, GO_MF and the KEGG pathway through the enrichment map function. The seven most enriched BPs, CCs, MFs and pathways up-regulated in untreated and TMZ + Y15 groups were presented in the order of normalized enrichment score (NES). The GSEA results were visualized using Dotplot and Joyplot with R packages ggplot2, grid, devtools and easygplot2. The GSEA enrichment plot for genes in the FA pathway were constructed with the GSEABase package.
Cell culture and treatment
Human GBM cell line U87 (BNCC337885) was obtained from BeNa Culture Collection (Beijing, China) and maintained in high-glucose Dulbecco’s modified Eagle medium (DMEM, PYG0073, BOSTER, Wuhan, China) with 10% fetal bovine serum (FBS, PYG0001, BOSTER) at 37°C with 5% CO2. The experiments were divided into two parts: one was performed in the cell line U87 exposed to dimethyl sulfoxide (DMSO, D2650, Sigma-Aldrich, St. Louis, MO, USA) (untreated group), and one was performed in the cell line U87 exposed to TMZ (76899, Sigma-Aldrich) and Y15 (1,2,4,5-benzenetetramine tetrahydrochloride, SML0837, Sigma-Aldrich) (TMZ + Y15 group). In each group, the cells were further divided into four groups: the mock group, the negative control (NC) group, the si-FANCD2 group, and the FANCD2 cDNA group. The U87 cell line was transfected with si-FANCD2 or FANCD2 cDNA before TMZ + Y15 for 48 h. Then cells were treated with 20 µM TMZ and 10 µM Y15 for 24 h. The cells were washed with drug-free medium and allowed to grow for another 48 h.
Cell transfection
SiRNA against FANCD2 (si-FANCD2) and the plasmid vector with FANCD2 cDNA were purchased from GenePharma (A09002, Shanghai, China). U87 cells were seeded at 1 × 10⁶ cells/well in a 6-well plate. Then the transfection was carried out using Lipofectamine 2000 (11668019, Life Technologies, Gaithersburg, MD, USA) according to the manufacturer’s instructions. In the TMZ + Y15 group, TMZ and Y15 were added 48 h after cell seeding. All experiments were performed 48 h after exposure to TMZ and Y15.
Quantitative real-time PCR (qRT-PCR)
After all treatments, two hundred ng of total RNA from the U87 cells was extracted by TRIzol reagent (15596018, Invitrogen, Carlsbad, CA, USA) and quantified by NanoDrop 2000 (Thermo Fisher Scientific, Waltham, MA, USA) before being reverse transcribed by the ReverTra Ace qPCR RT Kit (FSQ-101, Toyobo, Japan). The obtained cDNA was amplified using THUNDERBIRD SYBR qPCR Mix (QPS-201, Toyobo). FANCD2 expression was calculated by the 2–ΔΔCT method based on the content of internal control GAPDH. The primer sequences are listed in Table I.
Western blot
The total protein was extracted from the U87 cells after all treatments by RAPI protein lysate (P0013B, Beyotime, Shanghai, China) and quantified with a Pierce BCA Protein Assay Kit (23225, Pierce, Rockford, IL, USA). One hundred µg of total protein was electro-transferred onto PVDF membrane (88520, Invitrogen) at 200 mA for 120 min after SDS-PAGE separation. Membranes were blocked at room temperature in blocking buffer (TBST with 5% skimmed milk) for 1 h and incubated with anti-BRCA2 (ab123491, 1/2000) or anti-FAN1 (ab68572, 1/500) at 4°C for one night. Then the membranes were washed with TBST buffer three times and incubated with secondary antibody conjugated to horseradish peroxidase for 1.5 h. After washing three times, the blots were visualized by ECL Plus Western Blotting Substrate (Life Technologies). The protein amount was quantified by the software Lab Works 4.5. The internal control was GADPH (anti-GADPH, ab181603, 1/10000). The antibodies were purchased from Abcam (Cambridge, MA, USA).
MTT assay
Cells after all treatments were plated into a 96-well plate (1 × 10³ cells/well) and incubated at 37°C for 48 h. Then 10 µl of 5 mg/ml MTT (M2128, Sigma-Aldrich) prepared by PBS with pH of 7.4 was added to individual wells for an additional 4 h. The supernatant was discarded by centrifugation before the addition of 100 µl of DMSO to each well to dissolve the formazan crystals at room temperature for 30 min. The optical density at 490 nm was measured with a microplate reader.
Colony formation assay
After being digested with trypsin (25300054, Thermo Fisher Scientific), cells were incubated with RPMI 1640 medium (11875127, Thermo Fisher Scientific) and seeded into a 6-well plate (1 × 10³ cells/well) for thermostatic culture. The medium was discarded, and the clones were then washed with PBS before being fixed with 4% paraformaldehyde for 15 min and stained with GIEMSA (48900, Sigma-Aldrich) for 10–30 min. The optical microscope (Nikon, Japan) was used to observe and count the colonies.
Flow cytometric apoptosis analysis
U87 cells were seeded in a 6-well plate, transfected with si-FANCD2 and FANCD2 cDNA for 48 h, and then treated with 20 µM TMZ and 10 µM Y15 for 6 h. The cell apoptosis analysis was performed 48 h after the treatment with TMZ and Y15 with the PE Annexin V Apoptosis Detection Kit (559763, BD Biosciences, San Jose, CA, USA) according to the manufacturer’s instructions, and the FACSCalibur instrument was applied to detect the cell apoptosis. The percentage of apoptotic cells was calculated by FACSDiva software. Annexin V–/PI– cells were regarded as viable cells. Annexin V+/PI– cells were regarded as early apoptotic cells. Annexin V+/PI+ cells were regarded as necrotic or late apoptotic cells. Annexin V-/PI+ cells were regarded as late dead cells.
Results
Fanconi anemia pathway was suppressed in U87 cells treated with Y15 and TMZ
To identify the effects of TMZ or Y15 on the tumor growth of U87 cells, we applied GSE43452 for bioinformatics analysis. However, no differentially expressed genes were screened out between the U87 untreated group and the TMZ group (Supplementary Table SIII) or the Y15 group (Supplementary Table SIV). Compared with the U87 untreated group, there were 217 DEGs in the TMZ + Y15 group (Supplementary Tables SV, SVI). Thus, in following studies, we further investigated the mechanism of combination of TMZ and Y15 on U87 cells.
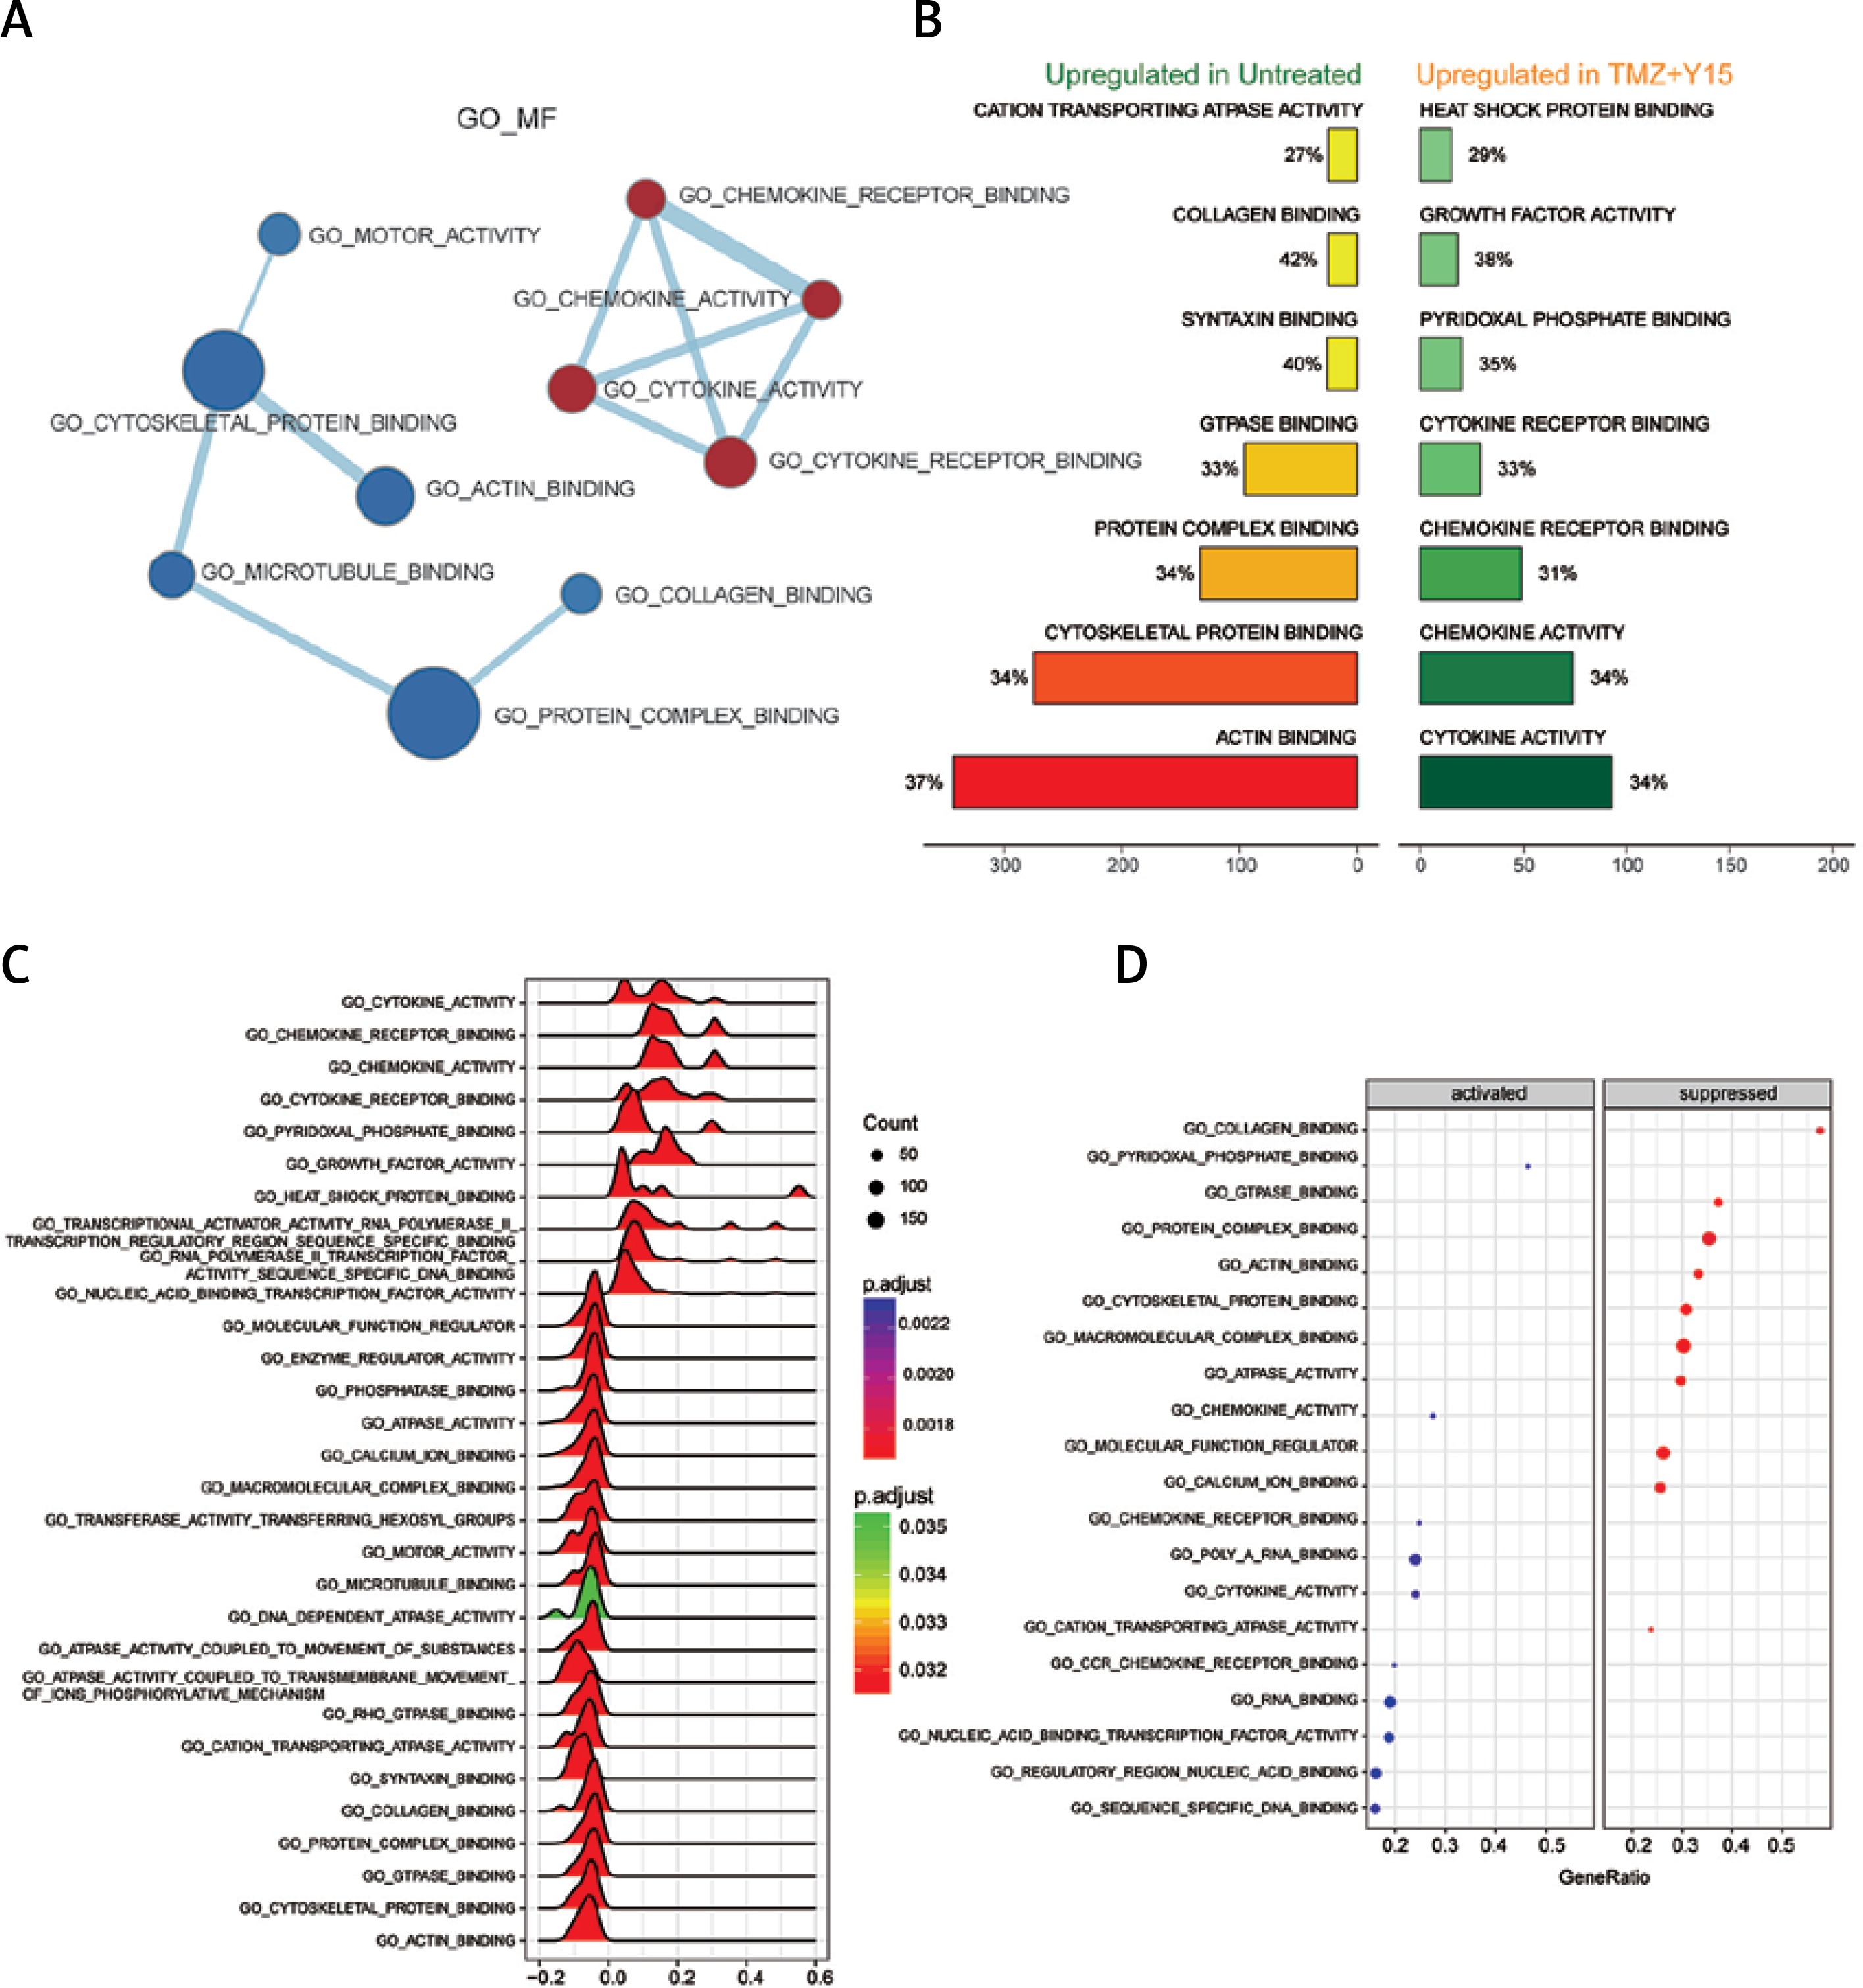
Through GSEA, we identified the differentially expressed GO terms in TMZ + Y15 treated GBM cells, including GO_BP (Figure 1), GO_CC (Figure 2) and GO _MF (Figure 3). The enrichment map of GO_BP showed that most identified biological processes were down-regulated in treated U87 cells (Figure 1 A). The top scoring BP enriched in treated U87 cells was response to transition metal nanoparticle (Figure 1 B), and the most significantly suppressed BP was cell development (Figures 1 C–D). As for GO_CC, all of them exhibited in the enrichment map were down-regulated in treated cells (Figure 2 A). Cellular components of cytoskeleton parts, chromosome parts, cell junctions, cell division site and coated vesicle were up-regulated in untreated U87 cells and suppressed in treated ones (Figures 2 B, C). Ribosome, ribonucleoprotein complex and extracellular space were remarkably activated cellular components in treated U87 cells (Figure 2 D). Analysis of GO_MF identified several down-regulated molecular functions in treated GBM cells (Figure 3 A). Among them, collagen binding, protein complex binding, cytoskeletal protein binding and actin binding were also among the top enriched functions in untreated U87 cells (Figure 3 B). Cytokine and chemokine activities, cytokine and chemokine receptor bindings, heat shock protein binding, growth factor activity and pyridoxal phosphate binding were important molecular functions activated in TMZ + Y15 treated U87 cells (Figures 3 B–D).
Figure 1
Enrichment analysis of GO_BP of U87 cells. A – Enrichment maps of GO_BP in U87 cells treated with TMZ + Y15. Nodes represent GO_BP and edges represent their relationships. Blue color represents suppressed BP while red color represents activated BP in TMZ + U87 group. The Q value was less than 0.05, compared with untreated U87 cells. B – Seven most significantly enriched GO_BP in untreated and TMZ + Y15 treated U87 cells. They were ranked in descending order according to their normalized enrichment scores (NESs). The value on the horizontal axis represents the count of enriched genes in the BP, and the percentage beside the bar indicates the proportion of enriched genes in the BP. C – Joyplot of down-regulated GO_BP in TMZ + Y15 treated U87 cells, compared with untreated U87 cells. The adjusted p-value is reflected by the color intensity of the peaks. The ridges on the left side of 0 represent the down-regulation of BP in the TMZ group. D – Dotplot of up- and down-regulated GO_BP in TMZ + Y15 treated U87 cells. The adjusted p-value is reflected by the color intensity of the nodes. The node size represents the gene count in the analyzed gene set. The gene ratio on the horizontal axis represents the proportion of differential genes in the gene set
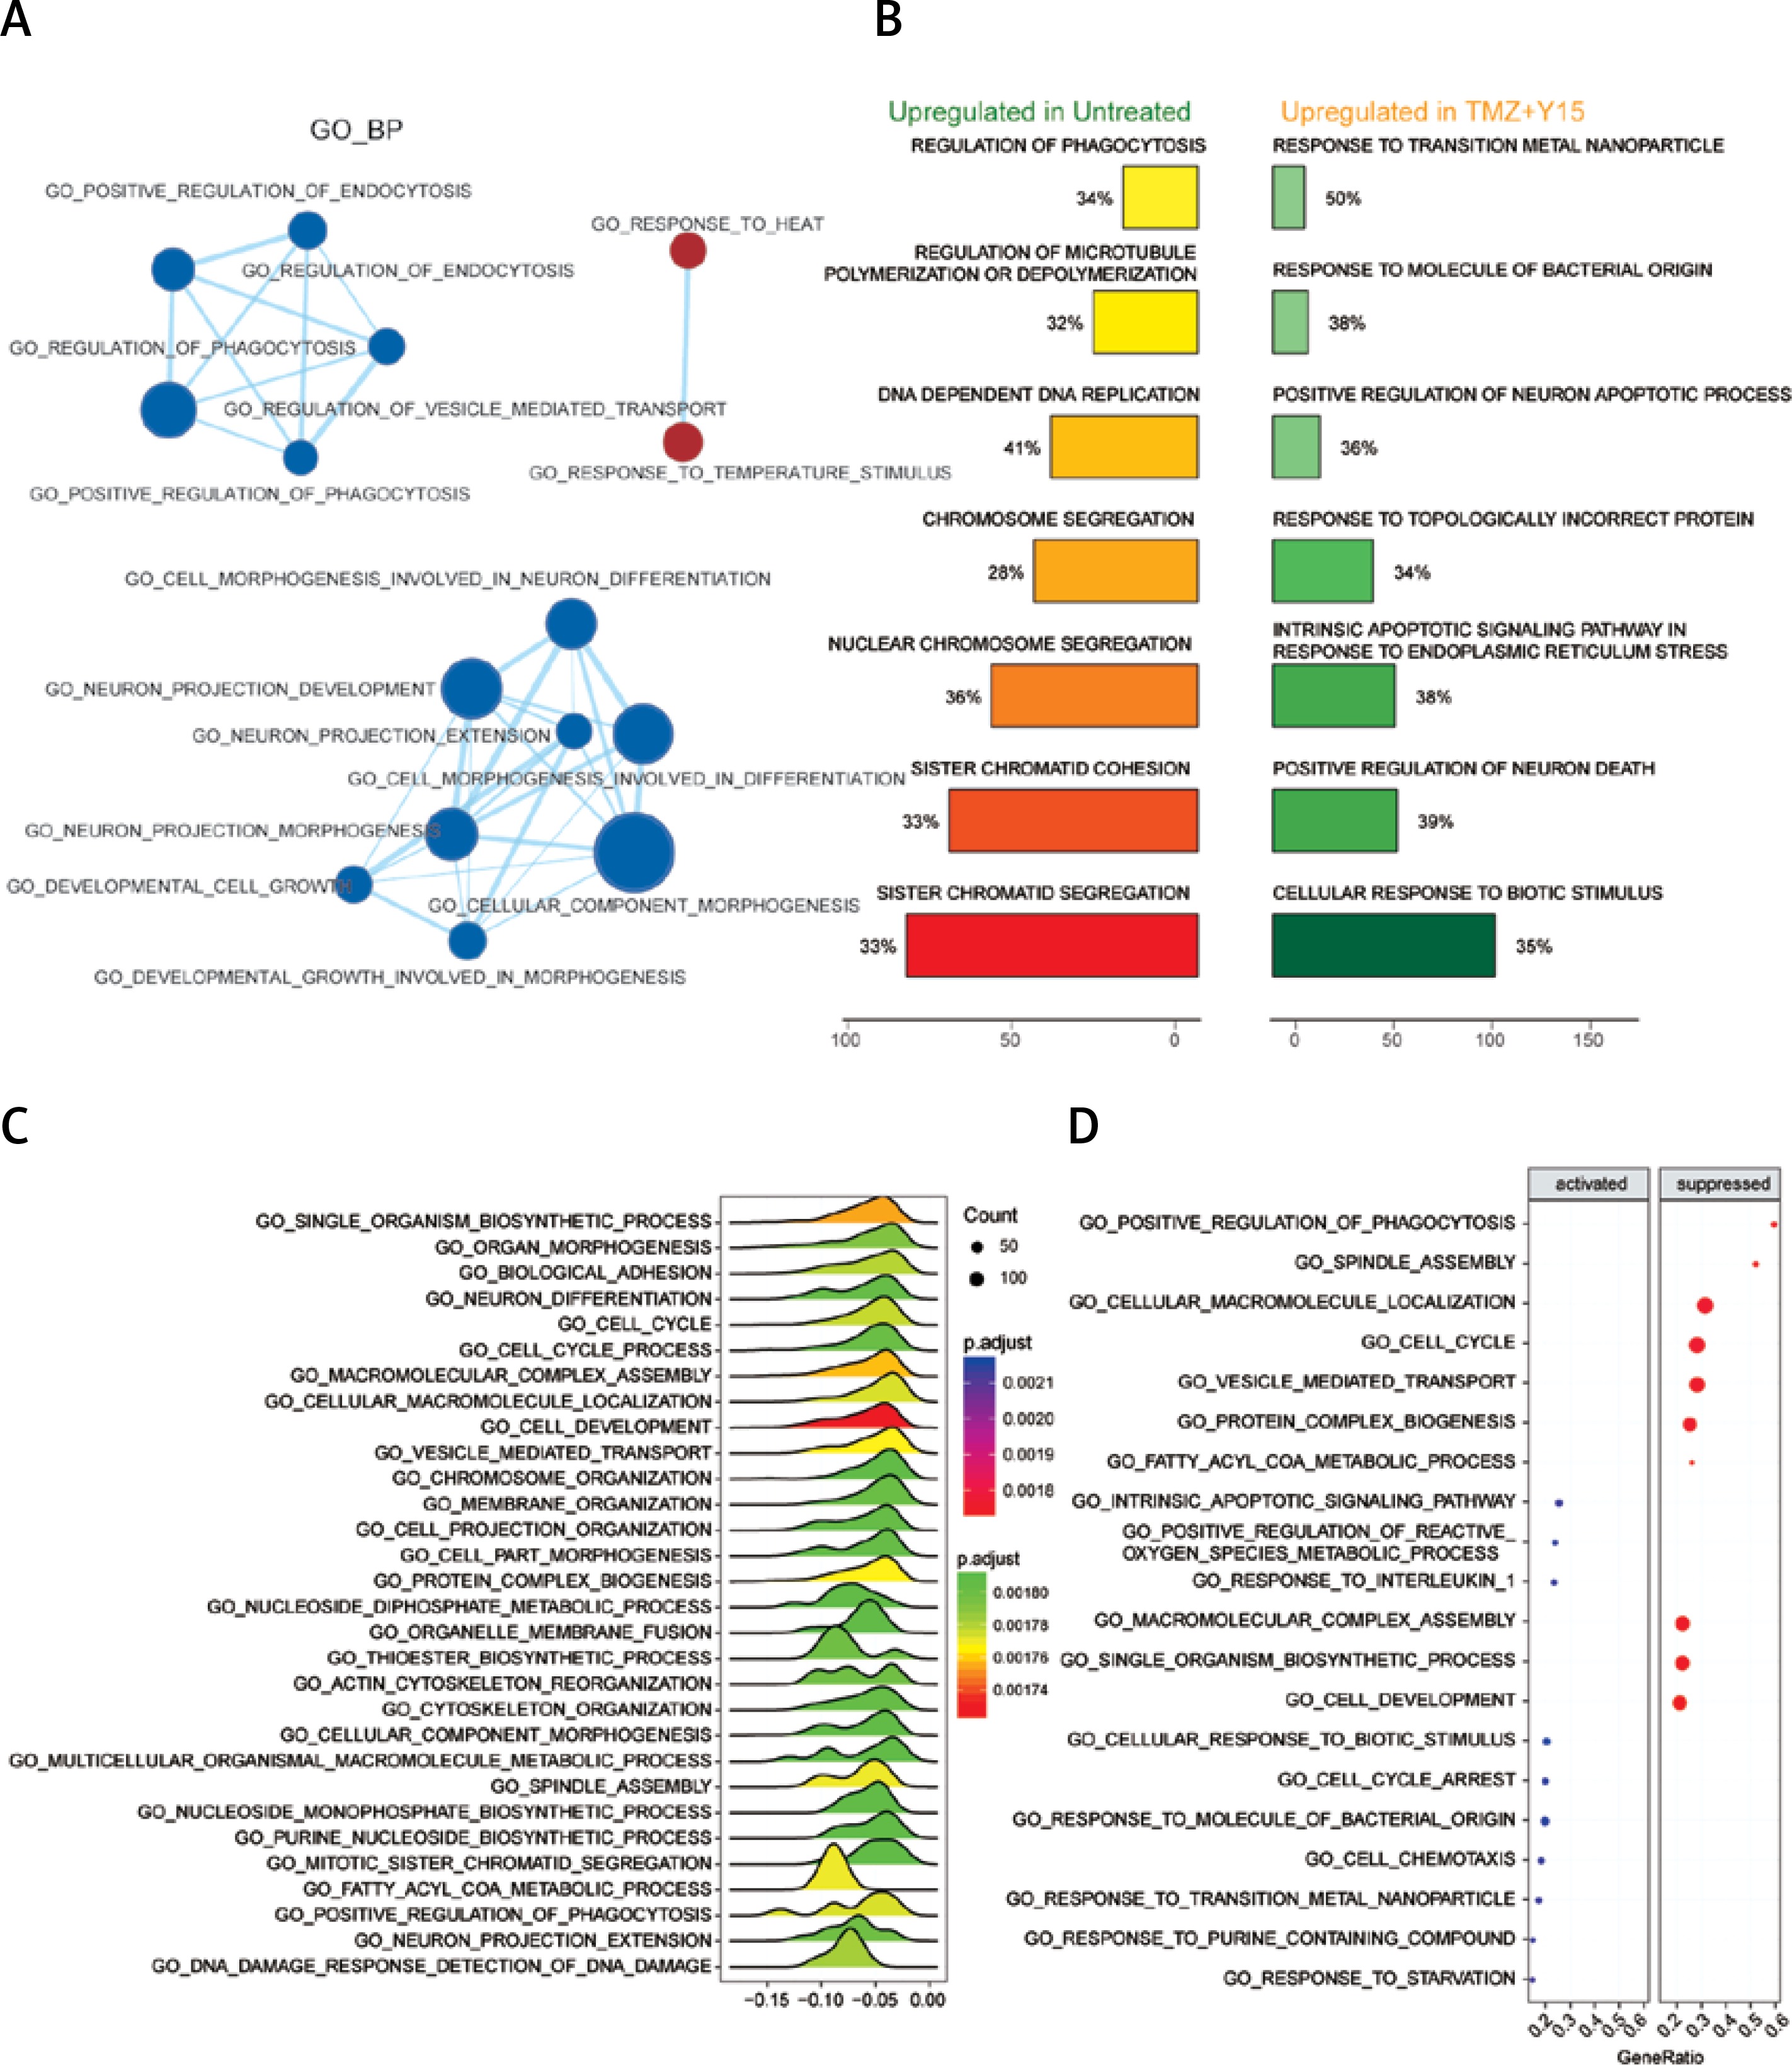
Figure 2
Enrichment analysis of GO_CC of U87 cells. A – Enrichment maps of GO_CC in U87 cells treated with TMZ + Y15. Nodes represent GO_CC and edges represent their relationships. Blue color represents suppressed CC in TMZ + U87 group. The Q value was less than 0.05, compared with untreated U87 cells. B – Seven most significantly enriched GO_CC in untreated and TMZ + Y15 treated U87 cells. They were ranked in descending order according to their NESs. The value on the horizontal axis represents the count of enriched genes in the CC, and the percentage beside the bar indicates the proportion of enriched genes in the CC. C – Joyplot of down-regulated GO_CC in TMZ + Y15 treated U87 cells, compared with untreated U87 cells. The adjusted p-value is reflected by the color intensity of the peaks. The ridges on the left side of 0 represent the down-regulation of CC in the TMZ + U87 group. D – Dotplot of up- and down-regulated GO_CC in TMZ + Y15 treated U87 cells. The adjusted p-value is reflected by the color intensity of the nodes. The node size represents the gene count in the analyzed gene set. The gene ratio on the horizontal axis represents the proportion of differential genes in the gene set
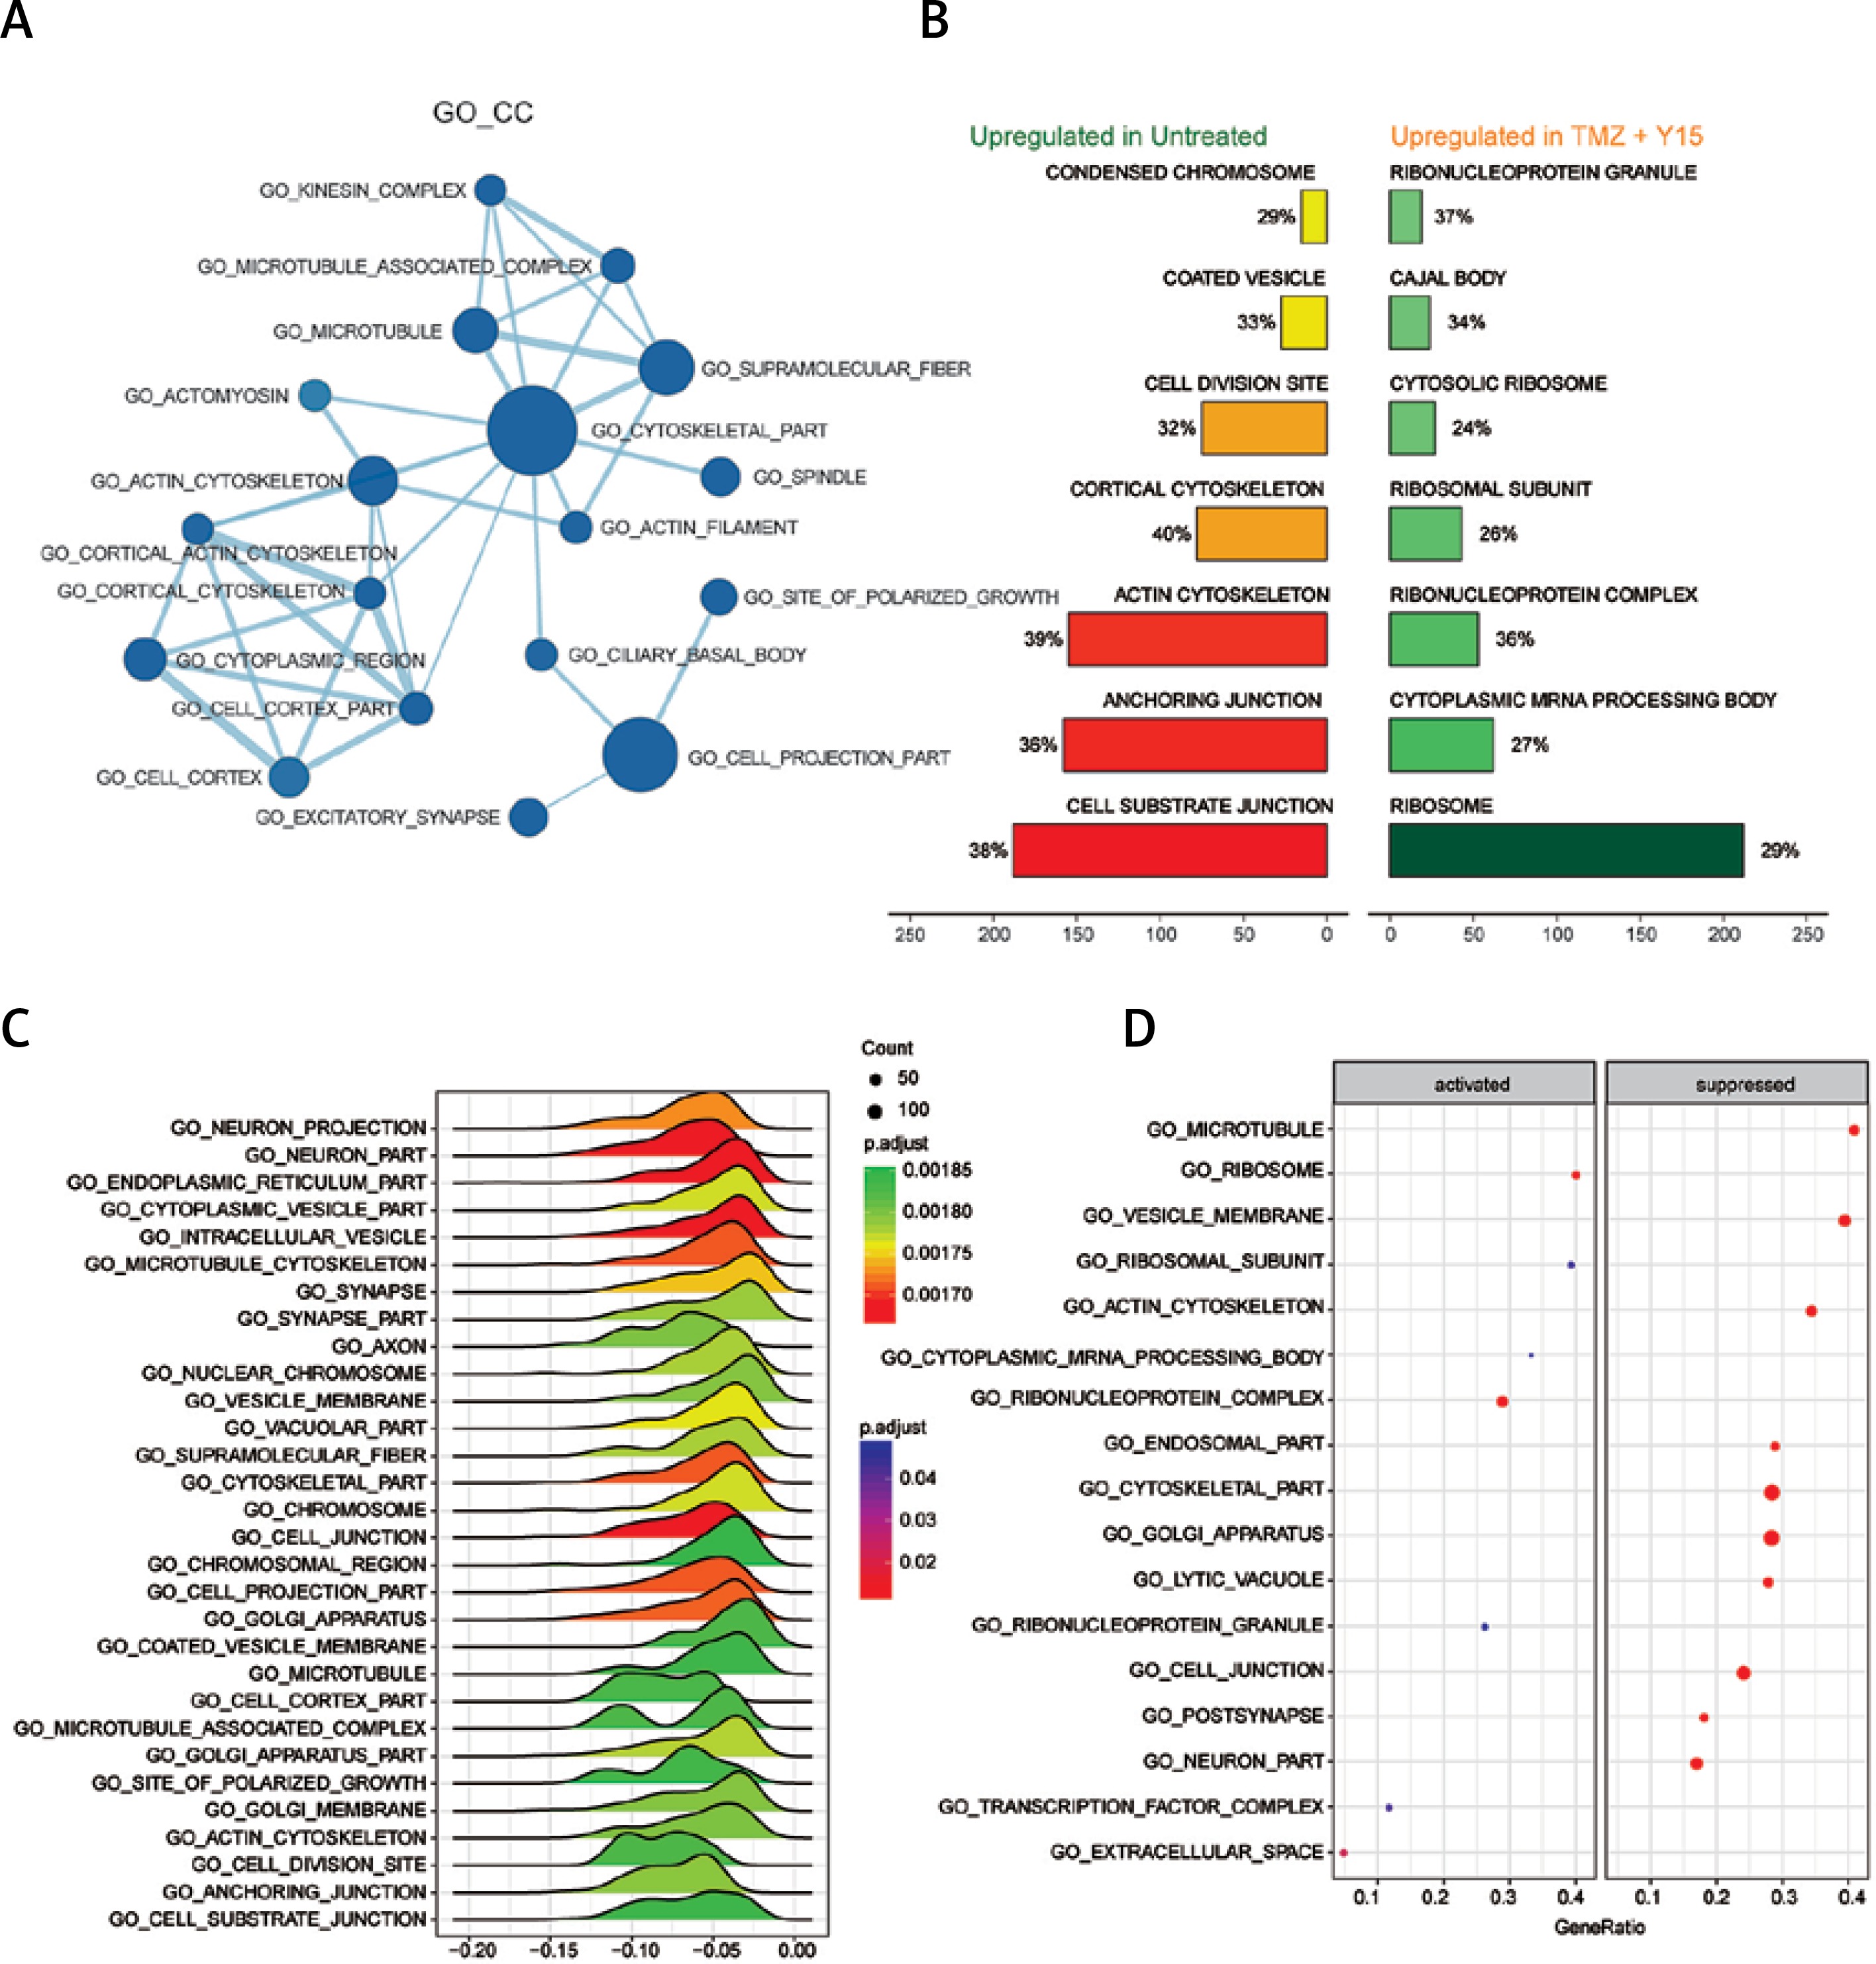
Figure 3
Enrichment analysis of GO_MF of U87 cells. A – Enrichment maps of GO_MF in U87 cells treated with TMZ + Y15. Nodes represent GO_MF and edges represent their relationships. Blue color represents suppressed MF while red color represents activated MF in TMZ + Y15 group. The Q value was less than 0.05, compared with untreated U87 cells. B – Seven most significantly enriched GO_MF in untreated and TMZ + Y15 treated U87 cells. They were ranked in descending order according to their NESs. The value on the horizontal axis represents the count of enriched genes in the MF, and the percentage beside the bar indicates the proportion of enriched genes in the MF. C – Joyplot of up- and down-regulated GO_MF in TMZ + Y15 treated U87 cells, compared with untreated U87 cells. The adjusted p-value is reflected by the color intensity of the peaks. The ridges on the left side of 0 represent the down-regulation of MF while those on the right side of 0 represent the up-regulation of MF in the TMZ + Y15 group. D – Dotplot of up- and down-regulated GO_MF in TMZ + Y15 treated U87 cells. The adjusted p-value is reflected by the color intensity of the nodes. The node size represents the gene count in the analyzed gene set. The gene ratio on the horizontal axis represents the proportion of differential genes in the gene set
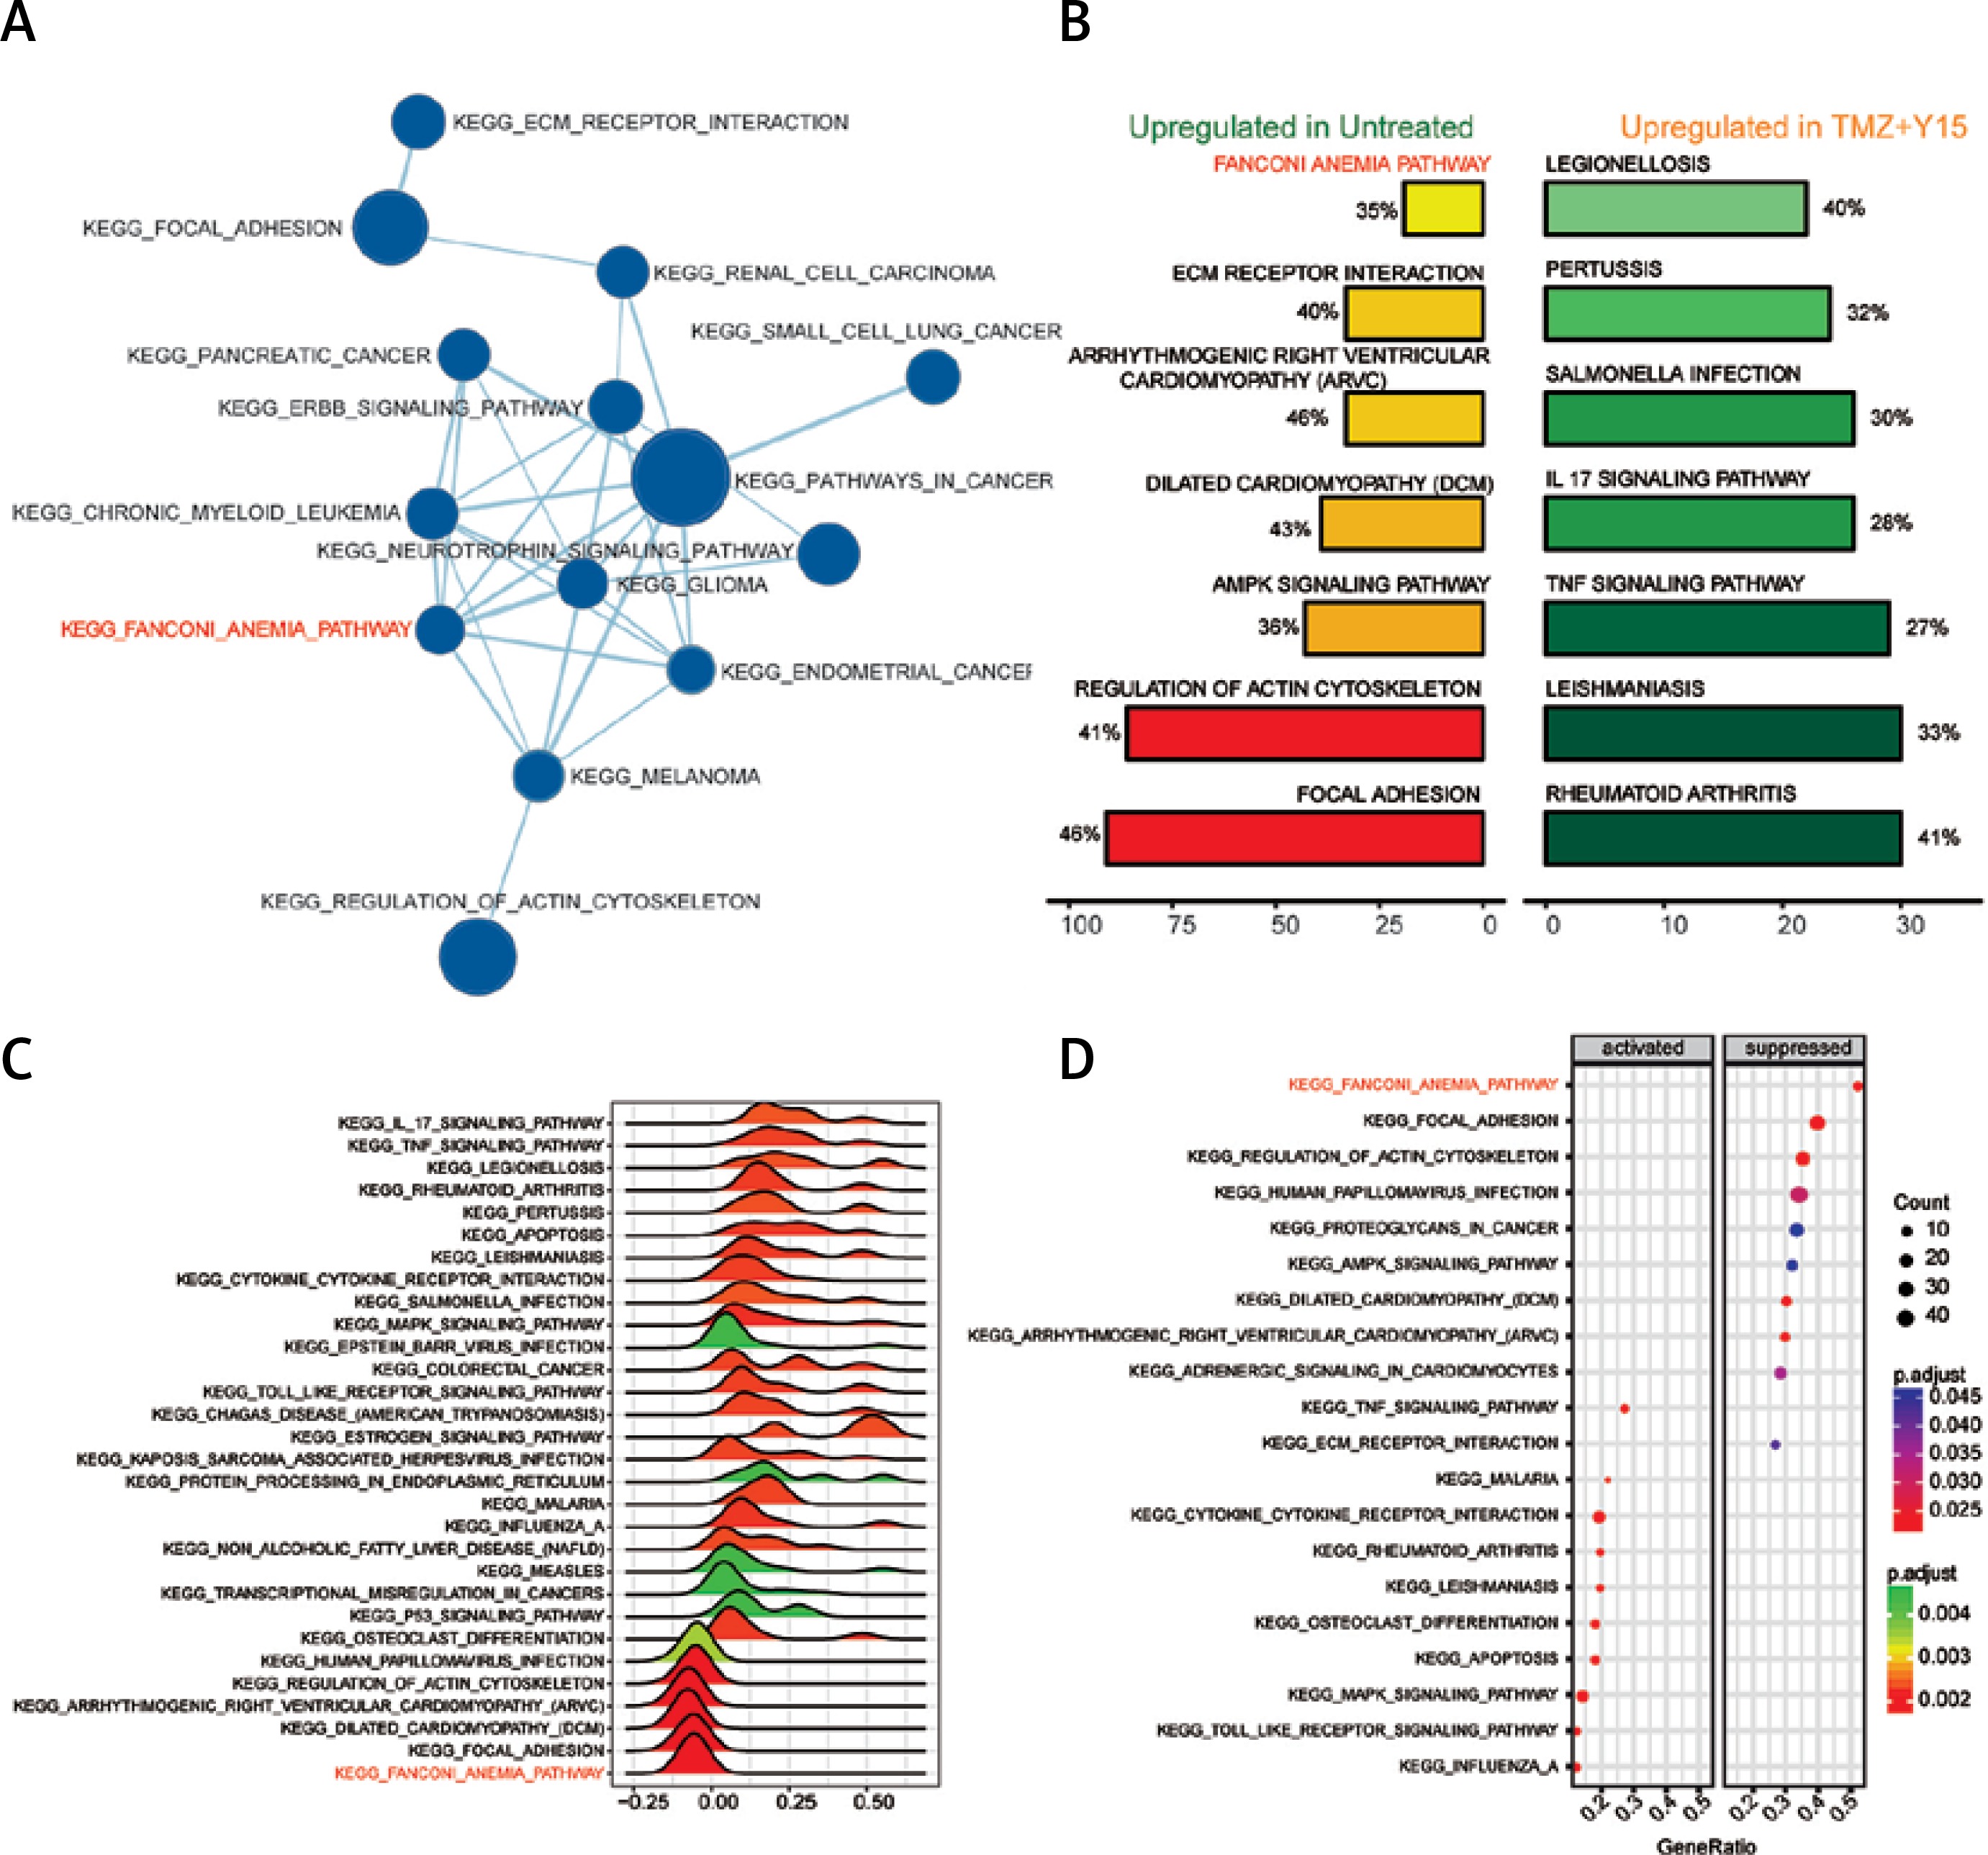
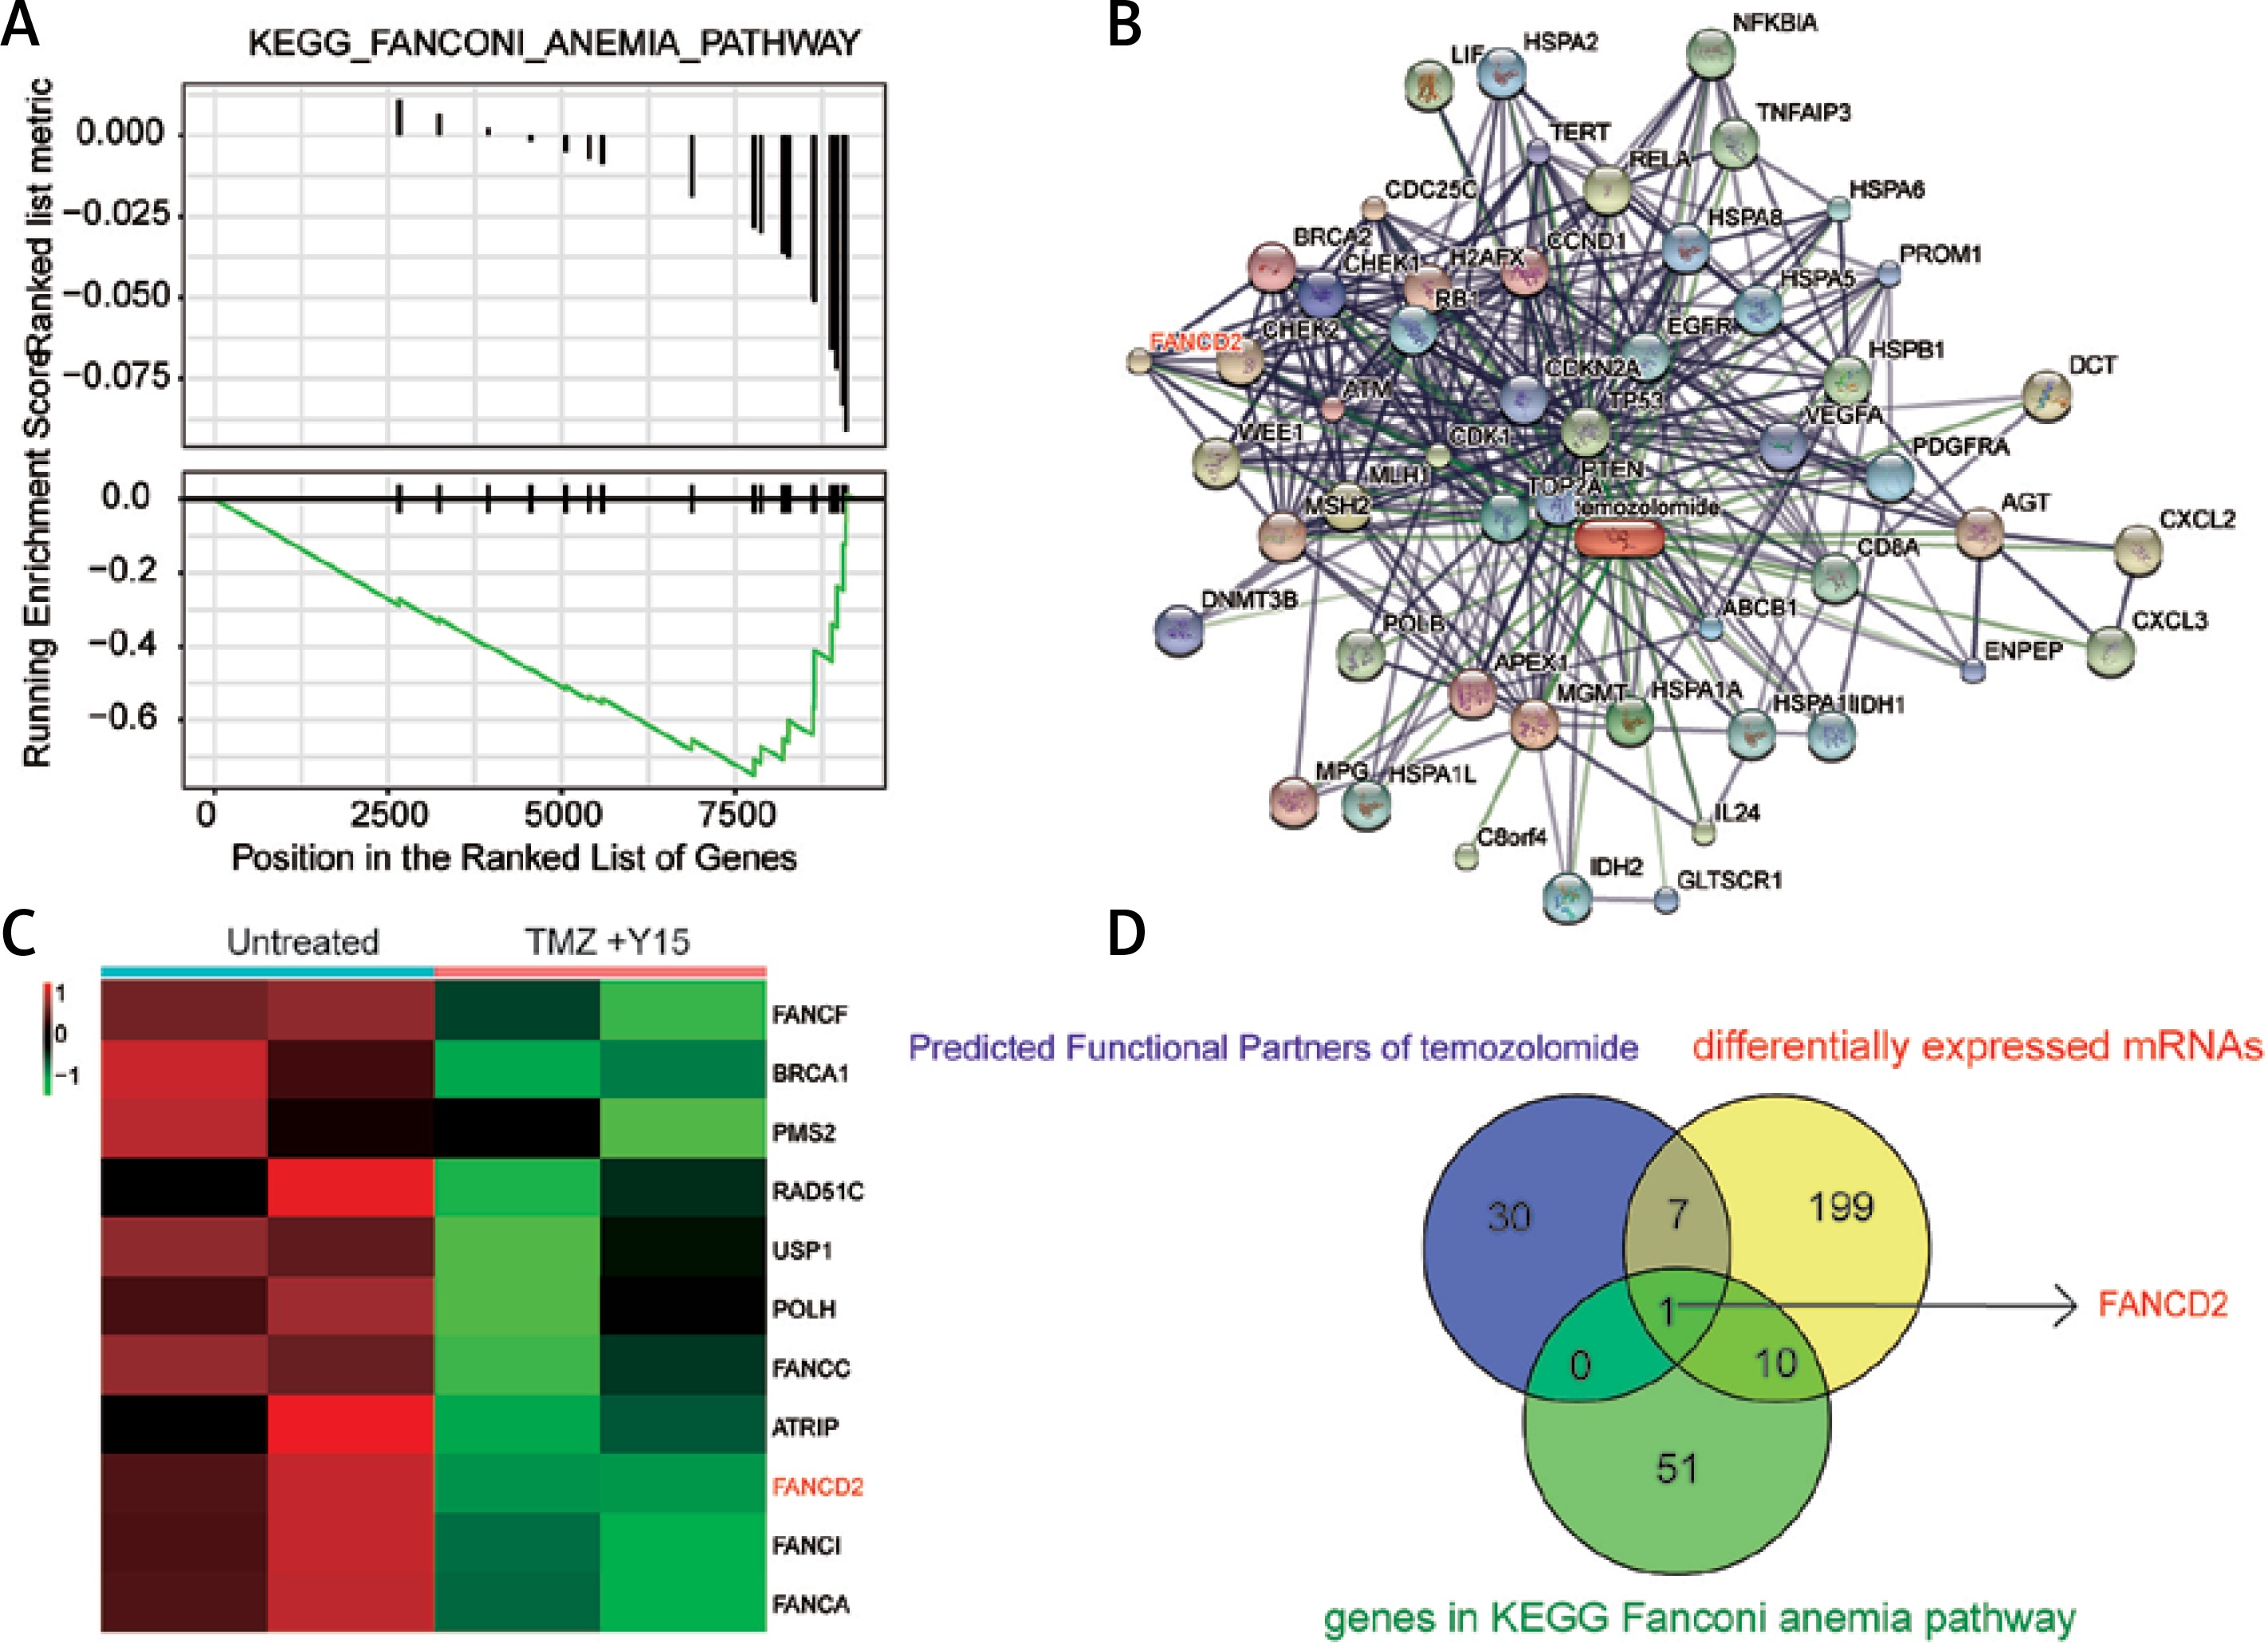
In addition, 14 KEGG pathways down-regulated in treated U87 cells and their interactions were identified in the enrichment map (Figure 4 A). The FA pathway was one of the suppressed pathways and it ranked the highest in the enriched pathways in untreated U87 cells (Figure 4 B), indicating that the combination treatment of TMZ and Y15 exerted a strong influence on its expression in U87 cells. The FA pathway was significantly suppressed with high fold change in treated U87 cells (Figures 4 C, D). Therefore, it was considered as a key pathway dysregulated in TMZ + Y15 treated U87 cells and further studied in the following research.
Figure 4
Enrichment analysis of KEGG pathway of U87 cells. A – Enrichment maps of pathways in U87 cells treated with TMZ + Y15. The FA pathway was down-regulated in the treated U87 cells. Nodes represent pathways and edges represent their relationships. Blue color represents suppressed pathways in TMZ + U87 group. The Q value was less than 0.05, compared with untreated U87 cells. B – Seven most significantly enriched KEGG pathways in untreated and TMZ + Y15 treated U87 cells. The FA pathway was the most enriched pathway in untreated GBM cells. They were ranked in descending order according to their NESs. The value on the horizontal axis represents the count of enriched genes in the pathway, and the percentage beside the bar indicates the proportion of enriched genes in the pathway. C – Joyplot of up- and down-regulated KEGG pathways in TMZ + Y15 treated U87 cells, compared with untreated U87 cells. The FA pathway was suppressed in treated U87 cells with adjusted p < 0.02. The adjusted p-value is reflected by the color intensity of the peaks. The ridges on the left side of 0 represent down-regulation of the pathway while those on the right side of 0 represent up-regulation of the pathway in the TMZ group. D – Dotplot of up- and down-regulated KEGG pathways in TMZ + Y15 treated U87 cells. The FA pathway was suppressed in treated U87 cells with adjusted p < 0.025. The adjusted p-value is reflected by the color intensity of the nodes. The node size represents the gene count in the analyzed gene set. The gene ratio on the horizontal axis represents the proportion of differential genes in the gene set
FANCD2 was down-regulated in U87 cells treated with TMZ and Y15
In the GSEA results, the suppression of the FA pathway in treated U87 cells might have resulted from the down-regulation of the genes involved in this pathway (Figure 5 A). Through the STICH database, the functional partner genes of TMZ were predicted, and the network is shown in Figure 5 B. It was also one of the DEGs involved in the FA pathway, with down-regulation in the TMZ + Y15 group (Figure 5 C). The Venn diagram suggested that FANCD2 was the only intersection of predicted functional partners of TMZ, differentially expressed mRNA in the TMZ + Y15 group and genes involved in the FA pathway (Figure 5 D). It implied that FANCD2 was a unique gene in the FA pathway, which was also down-regulated in TMZ + Y15 treated U87 cells.
Figure 5
FANCD2 was down-regulated in U87 cells treated with Y15 and TMZ. A – GSEA enrichment plots indicated down-regulation of genes involved in the FA pathway in U87 cells treated with Y15 and TMZ. B – Functional partner genes of TMZ predicted by STICH database. FANCD2 was one of the functional partners of TMZ. C – Hierarchical cluster analysis reflected 11 down-regulated genes in the FA pathway in the TMZ group, compared with the untreated group (|log2FC| > 1, adjusted p < 0.05). FANCD2 was one of the down-regulated genes. D – The Venn diagram showed that FANCD2 was the only common gene of predicted functional partners of TMZ, differentially expressed genes in TMZ + Y15 treated U87 cells and genes in the FA pathway
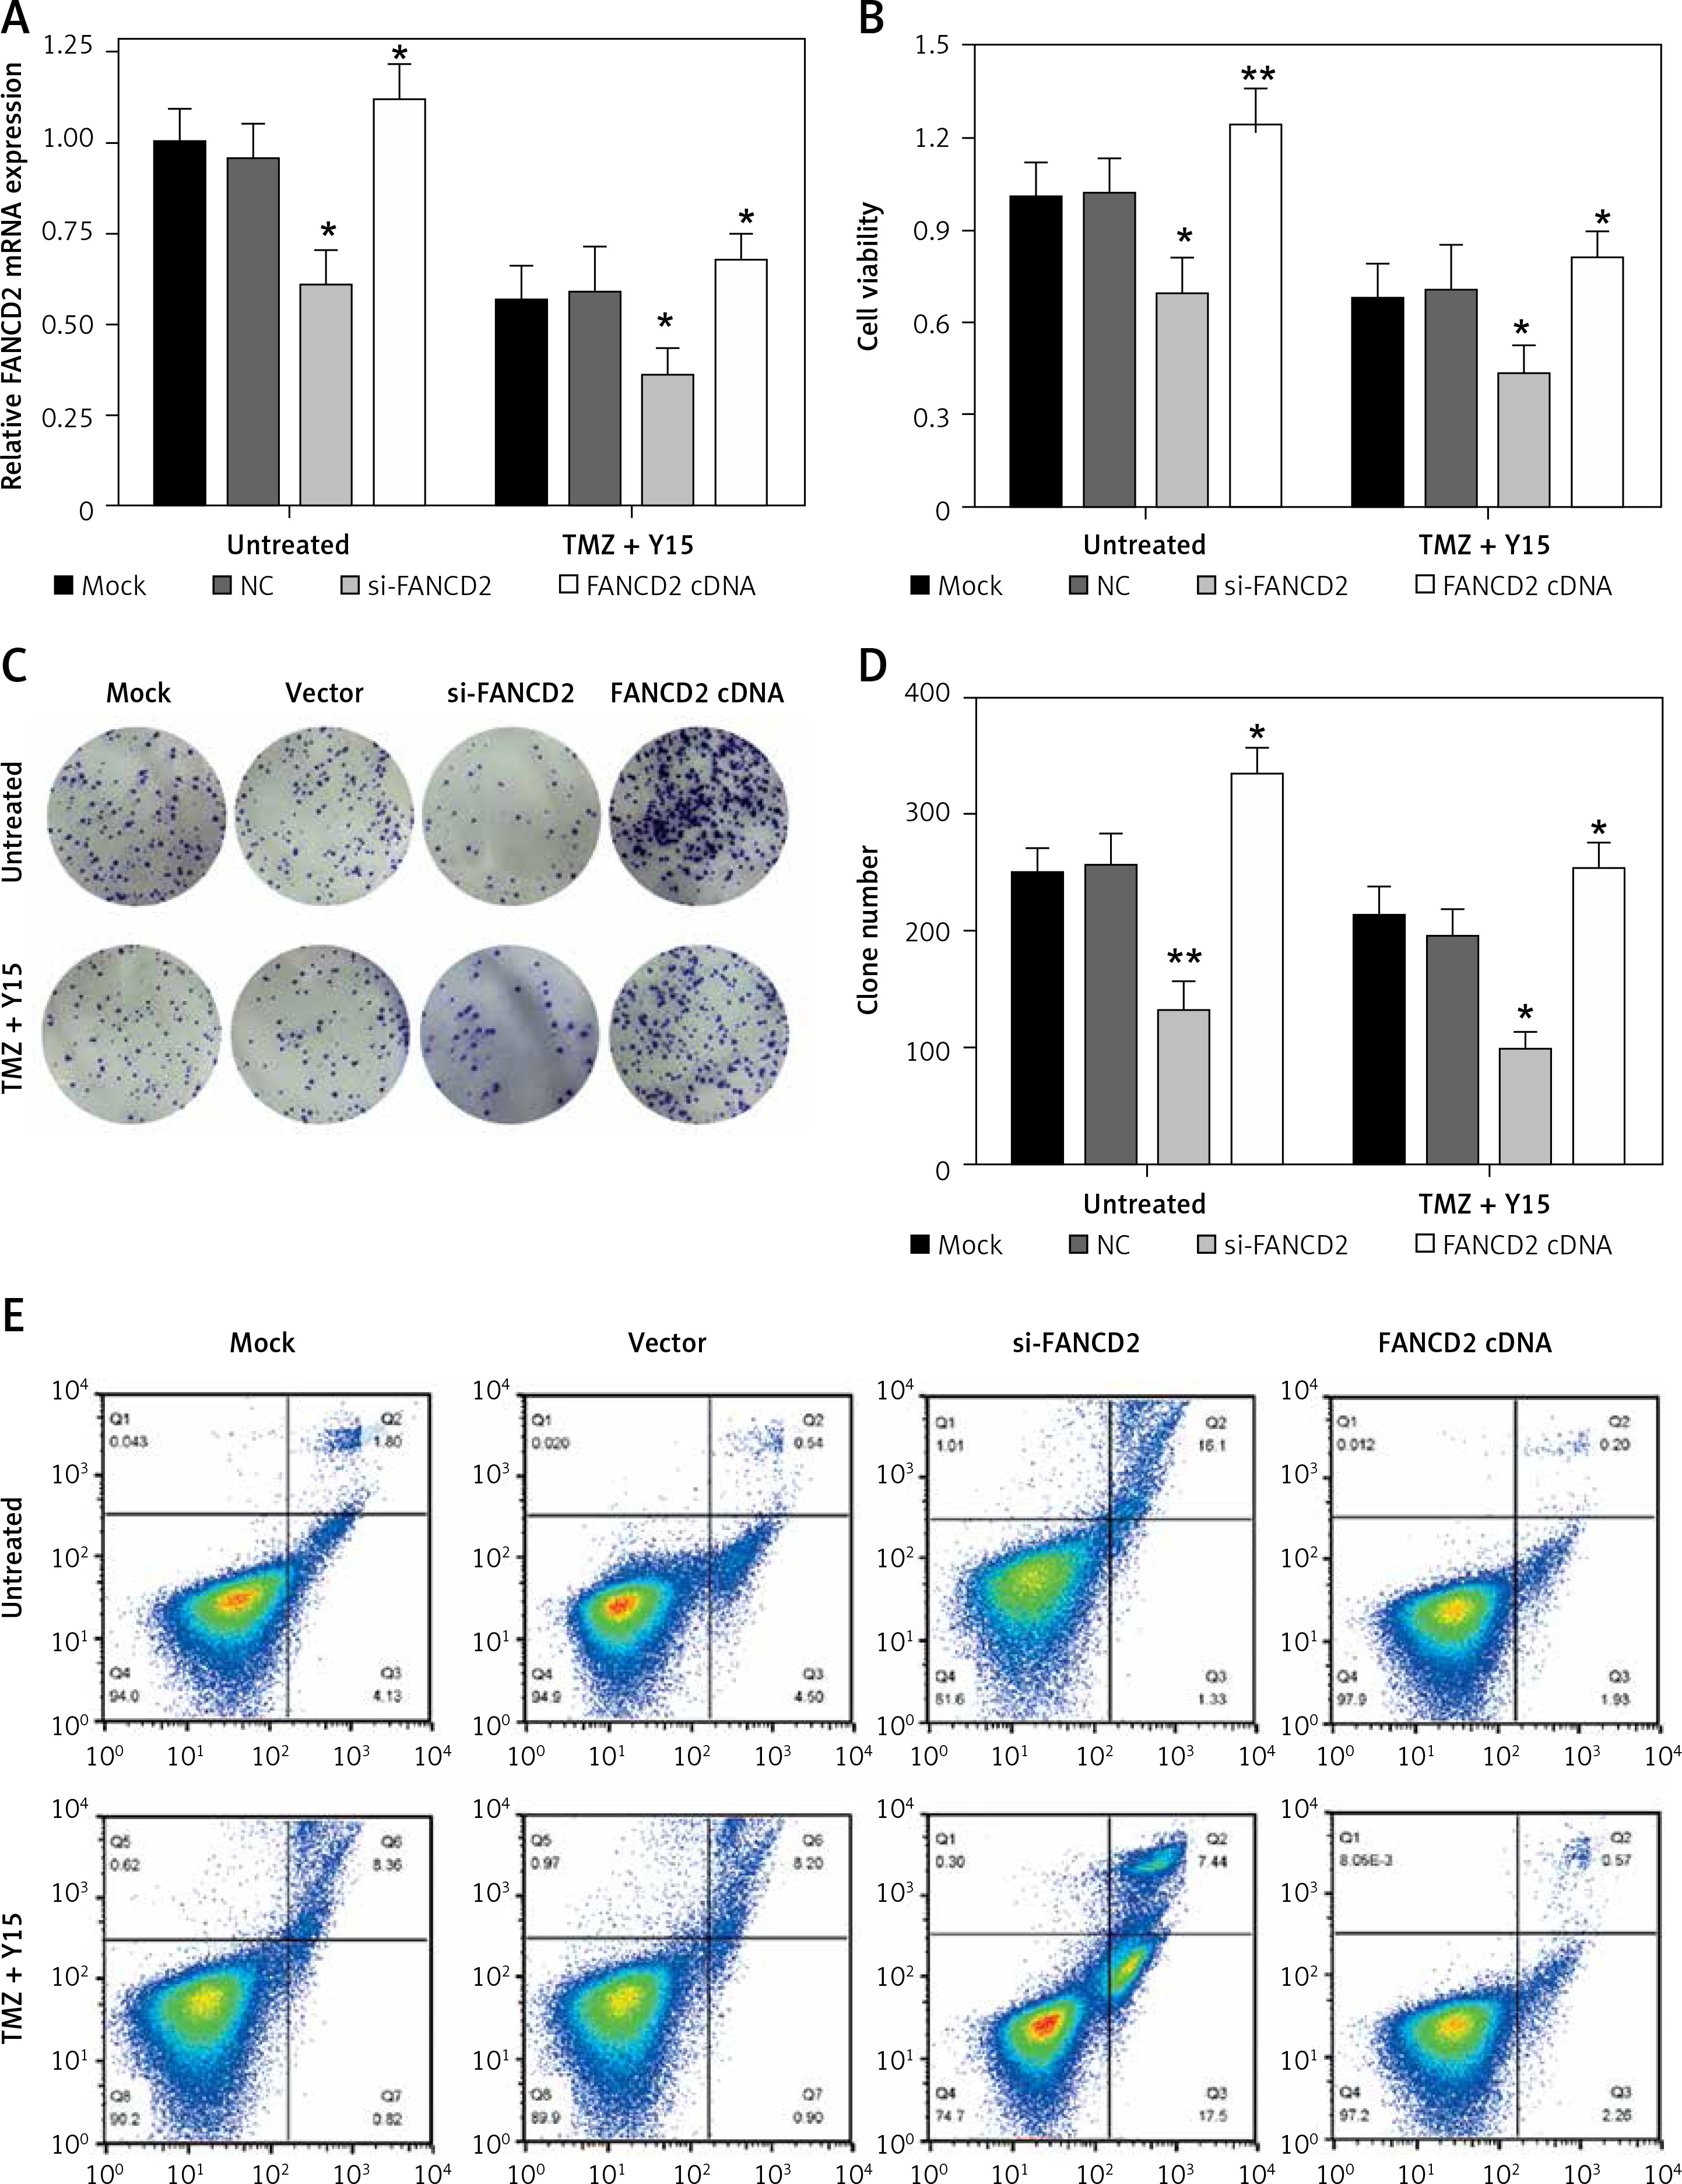
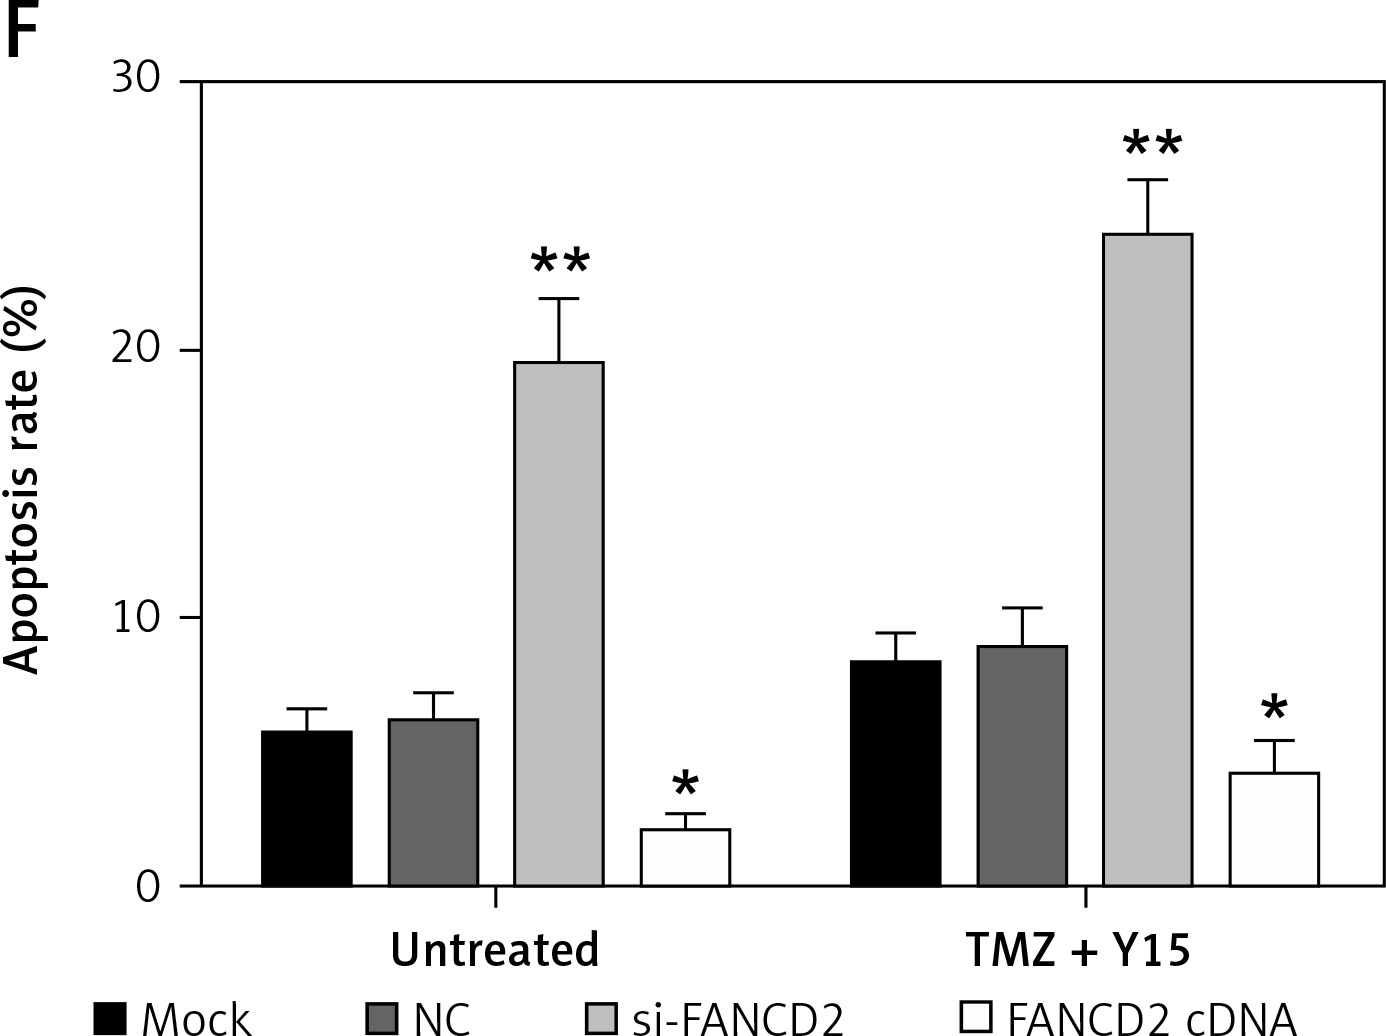
FANCD2 knockdown and TMZ + Y15 treatment inhibited growth of U87 cells
To verify the bioinformatics analysis, we first applied qRT-PCR for FANCD2 mRNA expression detection. At the same time, to meet the results of the bioinformatics results, we used the same concentration of TMZ and Y15 as the previous study [13] in the following experiments. As can be seen in Figure 6 A, TMZ + Y15 treatment suppressed the mRNA expression of FANCD2 in U87 cells. Si-FANCD2 and FANCD2 cDNA were then transfected into untreated and TMZ + Y15 treated cells to knock down and over-express FANCD2, respectively (Figure 6 A). After TMZ + Y15 treatment, the viability of U87 cells was reduced (Figure 6 B). FANCD2 knockdown not only inhibited cell viability in untreated cells, but also reinforced the suppressive effect in TMZ + Y15 treated cells (Figure 6 B). FANCD2 overexpression improved the viability of U87 cells in both untreated and TMZ + Y15 treated cells (Figure 6 B). Colony formation of U87 cells was also restrained by si-FANCD2, but induced by FANCD2 cDNA (Figures 6 C, D). Meanwhile, TMZ + Y15 treatment and FANCD2 knockdown also facilitated the induction of GBM cell apoptosis, while FANCD2 overexpression reduced the apoptosis rate of U87 cells (Figures 6 E, F). These results indicated that FANCD2 positively affected the growth of U87 cells, while TMZ + Y15 treatment was effective in suppressing cancer cell growth and FANCD2 knockdown could enhance the anti-tumor effect of TMZ + Y15 in U87 cells.
Figure 6
FANCD2 knockdown and TMZ + Y15 treatment inhibited growth of U87 cells. A – Relative mRNA expression of FANCD2 detected by qRT-PCR was decreased in U87 cells after treatment of TMZ and Y15. FANCD2 expression was significantly decreased in the si-FANCD2 group, but increased in the FANCD2 cDNA group in both untreated and TMZ + Y15 treated cells. B – Viability of U87 cells detected by MTT assay was decreased after treatment of TMZ and Y15. The cell viability was significantly decreased in the si-FANCD2 group, but increased in the FANCD2 cDNA group in both untreated and TMZ + Y15 treated cells. C, D – Colony formation of U87 cells was reduced after treatment of TMZ and Y15. The clone numbers of untreated and TMZ + Y15 treated cells were significantly decreased in the si-FANCD2 group, but increased in the FANCD2 cDNA group. E – Apoptosis of U87 cells detected by flow cytometry was increased after treatment of TMZ and Y15. The apoptosis rates of untreated and TMZ + Y15 treated cells were significantly increased in the si-FANCD2 group, but decreased in the FANCD2 cDNA group. F – Apoptosis of U87 cells detected by flow cytometry was increased after treatment of TMZ and Y15. The apoptosis rates of untreated and TMZ + Y15 treated cells were significantly increased in the si-FANCD2 group, but decreased in the FANCD2 cDNA group
*p < 0.05, **p < 0.01 compared with NC.
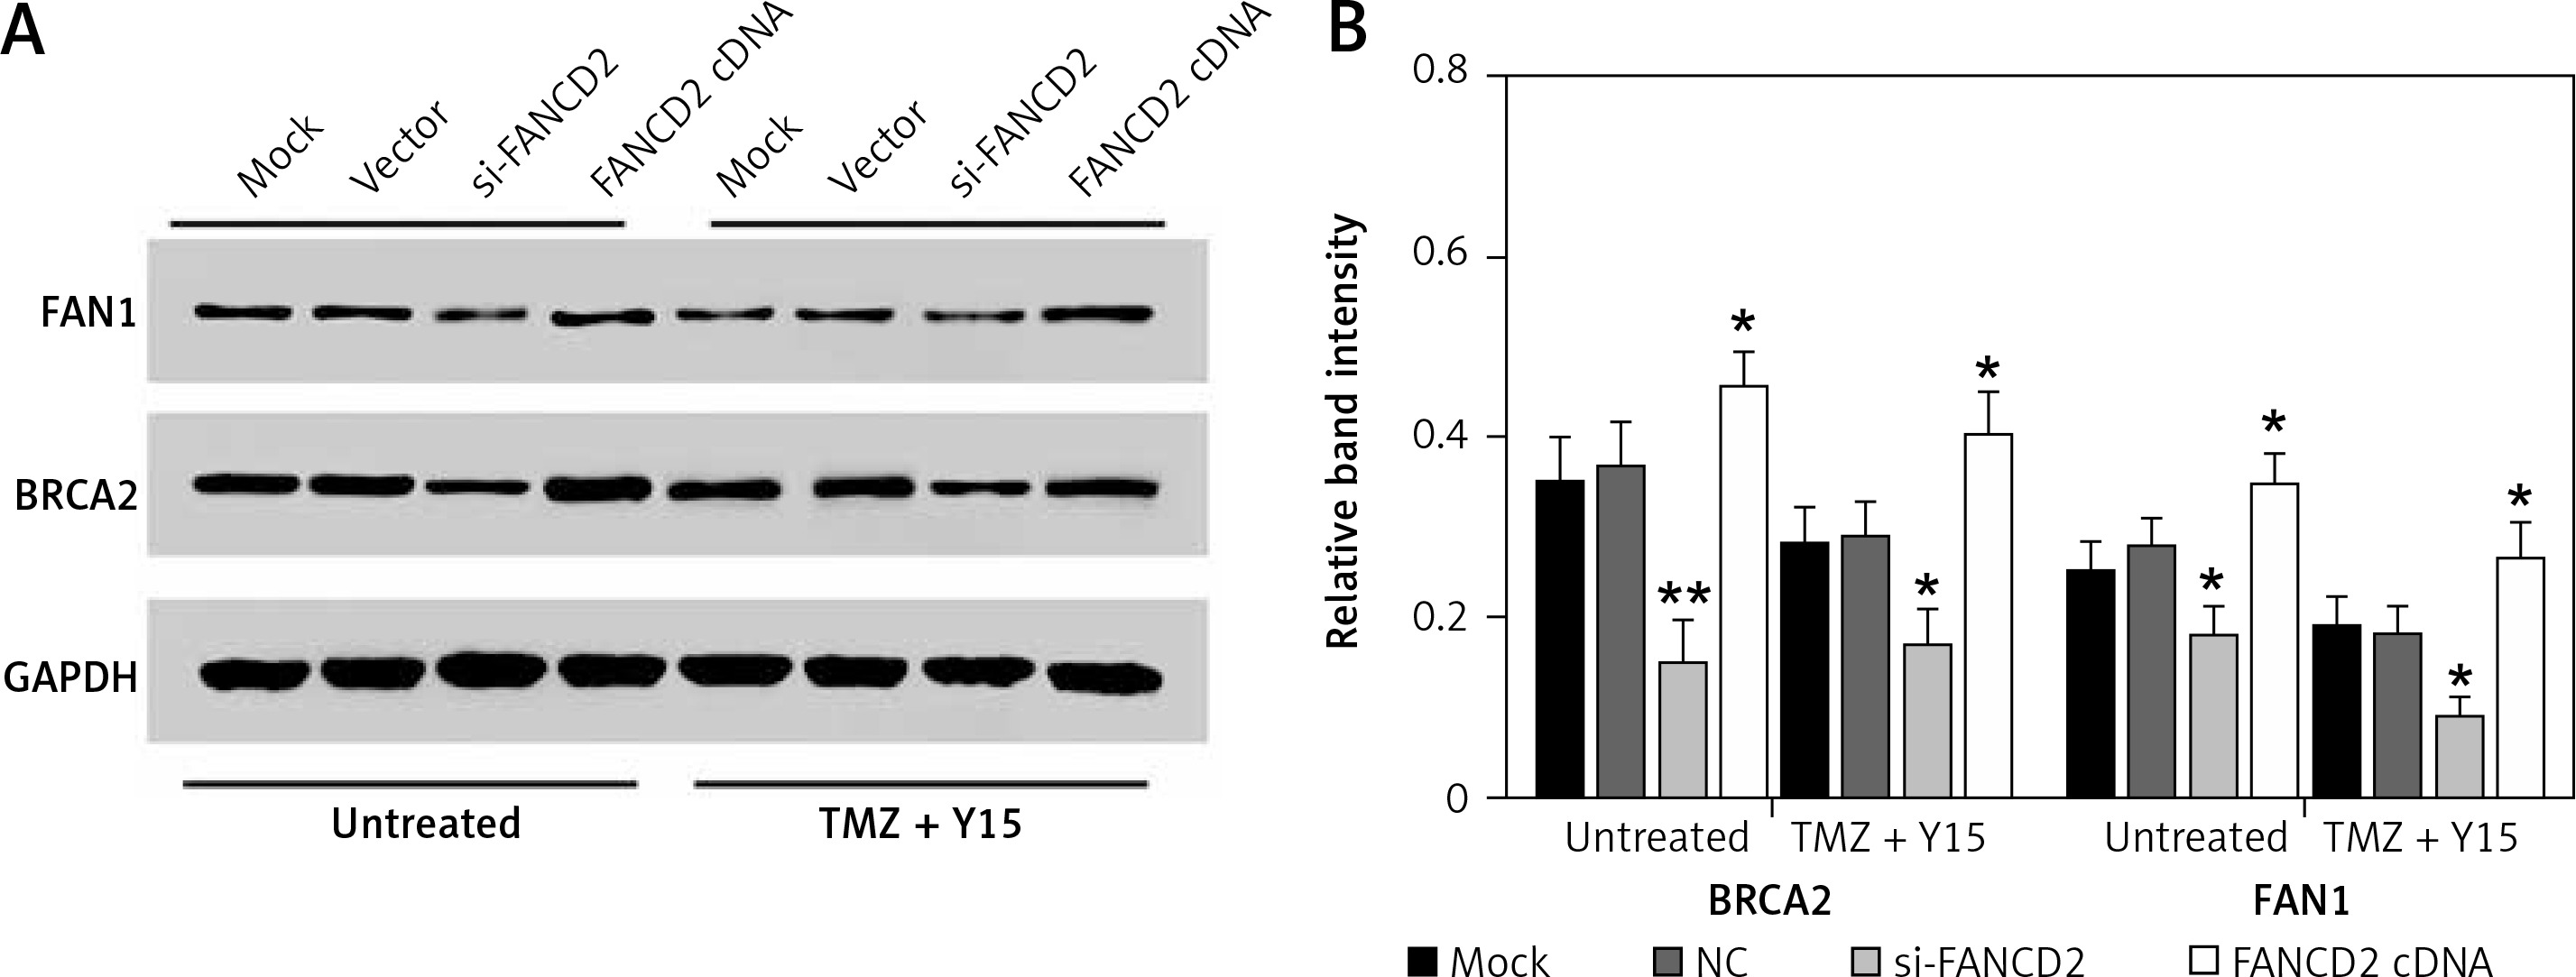
FANCD2 knockdown inhibited the Fanconi anemia pathway
Compared with untreated U87 cells, the expression levels of the downstream proteins of the FA pathway, FAN1 and BRCA2, were decreased in TMZ + Y15 treated U87 cells (Figures 7 A, B), suggesting that the combination treatment of TMZ and Y15 could suppress the FA pathway. FAN1/BRCA2 expression was also reduced in both untreated and TMZ + Y15 treated U87 cells after knocking down FANCD2, while overexpression of FANCD2 elevated the protein expression of FAN1/BRCA2 (Figures 7 A, B). Consequently, FANCD2 knockdown could inhibit the FA pathway in U87 cells.
Figure 7
FANCD2 knockdown inhibited the Fanconi anemia pathway. A – Protein bands of the downstream proteins of the FA pathway, FAN1 and BRCA2, detected by western blot. B – Relative band intensities of BRCA2 and FAN1 in TMZ treated U87 cells were lower than those in untreated U87 cells. The relative band intensities of BRCA2 and FAN1 in both untreated and TMZ + Y15 treated cells were significantly decreased in the si-FANCD2 group, but increased in the FANCD2 cDNA group
*p < 0.05 compared with NC.
Discussion
Through GSEA, we identified the significantly down-regulated pathway, the FA pathway, in TMZ + Y15 treated U87 cells. FANCD2, the gene participating in this pathway, was also down-regulated in U87 cells. The in vitro experiments verified that knockdown of FANCD2 enhanced the inhibitory effect of TMZ + Y15 on the growth of U87 cells and led to suppression of the FA pathway. Therefore, the down-regulation of FANCD2 and the FA pathway by combination treatment of TMZ and Y15 inhibited the development of GBM.
Gene set enrichment analysis has become an important method to determine the dysregulated GO terms and KEGG pathways in glioma. For instance, the KEGG pathways positively related to the oncogene TMER2 in glioma were screened out, including KEGG apoptosis, Cromer metastasis and chemokine pathways [14]. GO analysis showed that GBM patients with high risk of an unfavorable outcome tended to exhibit higher expression of proteins related to apoptosis, immune response, cell adhesion and motion and vasculature development [15]. The driving pathways and molecular characteristics of different subtypes of GBM could also be identified by GSEA [16, 17]. The activated inflammatory/immune response pathways were believed to be related to the mesenchymal subtype in high-risk GBM [18]. Gene set enrichment analysis could also analyze the effect of chemo treatment on the molecular and pathway expression in GBM. Li et al. revealed that after being treated with tachyplesin I, proteins significantly altered in GBM were cytoskeleton proteins and acid hydrolases, and the biological process altered was associated with cellular metabolism [19]. Our study also identified several GO terms and KEGG pathways that were distinctively altered in TMZ + Y15 treated GBM cells. Among them, the FA pathway aroused our interest as it was significantly suppressed in treated U87 cells and was the most enriched pathway in untreated ones.
The FA pathway is involved in the complex mechanism of the DNA damage response, participating in DNA replication and the replication-blocking lesion response [20]. Previous studies suggested that for chemo-resistant cancer cells, inhibition of the FA pathway could improve their sensitivity to chemotherapy. For instance, suppression of the FA pathway by curcumin could reverse the cisplatin resistance of cisplatin-resistant lung cancer cells [21]. Inhibition of the FA pathway sensitizes glioma to chemotherapeutic agents, including TMZ [22]. FANCD2 is a member of the Fanconi anemia complementation group and is pivotal in the FA pathway [23]. It is known that higher FANCD2 expression predicted higher tumor grade of GBM, and inhibition of the FA pathway could sensitize glioma cells to TMZ and carmustine [22]. Also, inhibition of FANCD2 monoubiquitination made the glioma cells more sensitive to the cytotoxic effect of TMZ [24]. Putting the evidence together, we speculated that FANCD2 and the FA pathway played crucial roles in the combination treatment of TMZ and Y15 in GBM.
In our study, the FA pathway and FANCD2 were down-regulated in GBM cells treated with TMZ + Y15. FANCD2 knockdown led to suppression of the FA pathway, while it reduced cell viability, induced apoptosis and enhanced the suppressive effect of TMZ + Y15 in GBM cells. Our findings suggested that FANCD2 and the FA pathways might be potential targets for TMZ + Y15 treated GBM. As a result, FANCD2 and the FA pathway have great potential to serve as novel targets to improve the treatment effect of TMZ + Y15 in GBM.
Although we have studied the expression levels and the biological functions of FANCD2 and the FA pathway in U87 cells, there still exist several drawbacks in our study. For example, since the FA pathway was reported to be able to mediate the resistance of chemo-resistant cancer cells, its effect on TMZ-resistant cells should be investigated to understand its function in GBM more deeply. In addition, the lacking in vivo experiments should be supplemented in future to verify the in vitro results.
In conclusion, our study indicated that inhibition of the FA pathway by FANCD2 knockdown could reduce the viability and promote the apoptosis of TMZ + Y15 treated U87 cells, suggesting that FANCD2 knockdown could suppress the proliferation of both untreated and TMZ + Y15 treated U87 cells and supporting the conclusions from previous studies.