

Introduction
Acute lymphoblastic leukemias (ALL) are a heterogeneous group of diseases characterized by rapid and uncontrolled clonal expansion of hematopoietic progenitor cells [1]. They can be further divided into two main types: B-cell precursor acute lymphoblastic leukemia (BCP-ALL), which represents up to 85% of ALL cases, and T-cell acute lymphoblastic leukemia (T-ALL), which constitutes the remaining 15% of ALL cases in children [2, 3]. Approximately 15-20% of patients with leukemia still die as a consequence of relapse [4, 5]. Cytogenetic analysis of leukemic blasts plays an important role in risk stratification and prognosis in ALL patients. One of the most frequent abnormalities in ALL is hyperdiploidy, which has been considered as a favorable prognostic factor. Hyperdiploid leukemic blasts bear additional chromosomes on top of the diploid chromosome complement. High hyperdiploidy with 51-65 chromosomes and DNA index > 1.16 is usually associated with gain of chromosomes 4, 6, 10, 14, 17, 18, 21 and X. This phenomenon in childhood ALL is a good prognostic factor [6, 7], which may be explained by increased incidence of spontaneous apoptosis of hyperdiploid leukemia cells. However, the mechanism of increased sensitivity to treatment is not fully understood [8]. In contrast, hypodiploidy with the number of chromosomes below 45, occurring in about 1% of patients, is associated with an adverse prognosis [9, 10].
Appropriate patient stratification into ploidy-based risk groups requires prior determination of the DNA ploidy status of leukemic cells. The gold standard in ploidy evaluation is metaphase karyotyping of cultured bone marrow cells. This technique is, however, time-consuming because it requires culturing of leukemic blasts. Moreover, it is not always possible to obtain a sufficient number of metaphases for credible cytogenetic evaluation [11]. When karyotyping is not successful, assessment of the DNA ploidy by FC can be a useful substitute method. Measurement of cell DNA content using FC provides rapid and objective information about clonal abnormalities in cell DNA and cell cycle distribution. Over three decades, this type of analysis has been performed in many tumors, including leukemia [12-14]. With the use of FC, it is possible to objectively detect the aneuploid clones by determination of the DNA index (DI) and quantitative analysis of individual phases of the cell cycle [15-17]. Importantly, both methods give highly comparable results [11, 18, 19].
Specific immunophenotypic profiles have been associated with prognosis and cytogenetic and molecular abnormalities in ALL [20, 21]. Overexpression of CD123 is strongly associated with high hyperdiploid and represents an additional marker of good prognosis in pediatric ALL [22]. BCP-ALL carrying the t(12;21) translocation is also associated with good outcome and immunophenotype with higher CD10 and HLA-DR expression [23]. There is a need to discover additional markers that could help determine a patient’s risk group before treatment. Thus, the re-evaluation of currently assessed as well as new markers at the diagnosis of ALL and their association with aneuploidy might be useful in risk stratification in clinical practice. The aim of this study was to determine the incidence of DNA aneuploidy using the DNA index in Polish children with BCP-ALL and its relationship with immunological phenotype, age, leukocyte count, S-phase fraction (SPF) and early response to induction chemotherapy assessed by the percentage of residual blast cells in bone marrow aspirates at days 15 and 33 of treatment. The immunophenotypes were evaluated by multicolor flow cytometry with a 20-antibody panel enabling detailed characterization of blast populations in BM: CD9, CD10, CD13, CD20, CD21, CD22, CD24, CD33, CD34, CD38, CD45, CD58, CD66c, CD73, cytCD79a, CD81, CD86, CD123, CD304 and TdT. Our data indicate that there exists a specific immunophenotypic signature associated with high hyperdiploid BCP-ALL among Polish pediatric patients, which distinguishes them from other groups of ploidy.
Material and methods
Patients and controls
Flow cytometry DNA analysis was performed on BM samples obtained from 267 consecutive ALL patients from August 2014 to April 2019 in the clinical centers of the Polish Pediatric Leukemia/Lymphoma Study Group. In the examined patient BM samples, blasts were identified and the BCP-ALL subtypes were defined according to the European Group for the Immunological Classification of Leukemias (EGIL) classification. Patients with mature B-cell ALL and biphenotypic AL were not included. Cases for which a poor quality DI histogram was obtained (CV > 7%) were also excluded from this study. Not all studied antigens were assessed in every patients (Table 1), which explains the differences in the total number of cases per specific subgroup.
The experimental setup was approved by the Bioethics Committee of Medical University of Silesia in Katowice, No. KNW/0022/KB1/145/II/11/12/15.
Table 1
Overall profile of antigen expression on leukemic blasts in BCP-ALL at diagnosis expressed as nMFI
Sample preparation and immunophenotyping
The immunophenotype of leukemic blasts from all ALL patients was centrally determined by an 8-color or 10-color flow cytometry protocol based on a standardized staining protocol developed by the EuroFlow consortium at the Department of Pediatric Hematology and Oncology, Medical University of Silesia in Zabrze [24]. The immunophenotype of blasts was assessed first with Acute Leukemia Orientation Tube (ALOT), containing fluorochrome-conjugated antibodies against: MPO/FITC, cytCD79a/PE, CD34/PerCP-Cy5.5, CD19/PE-Cy7, CD7/APC, CD3/APC-H7, cytCD3/PB, CD45/PacificOrange, to determine the blast cell line of origin. Subsequently, for BCP-ALL cases an extended 8-color EuroFlow BCP-ALL panel was applied, containing: CD34/PerCP-Cy5.5, CD45/PacificOrange, CD58/FITC, CD66c/PE, CD10/APC, CD20/PB, CD38/APC-H7, cytIgM/FITC, CD33/PE, lambda-APC/H7, κ/PB, TdT/FITC, CD13/PE, CD22/APC, CD24/APC-H7, CD9/PB, CD15/FITC, NG2/PE, CD123/APC, CD81/APC-H7, CD21/PB or CD34/PercP-Cy5, CD45/AF700, CD10/BV605, CD38/APC-H7, CD20/PB, CD33/APC, TdT/FITC, CD13/BV510, CD22/APC, CD24/BV605, CD9/PB, CD15/FITC, CD123/FITC, CD81/APC-H7, CD86/BV510, CD73/BV510, CD304/PE for the 10-color BCP-ALL panel variant.
The standard technique of antibody staining by 30-minute incubation at room temperature was used. FACS Lyse solution (BD) was used for erythrocyte lysis. Stained BM samples were analyzed using BD FACS Canto II or BD FACS Canto 10 flow cytometers, which were set up and calibrated according to the EuroFlow guidelines [25, 26]. At least 50,000 cells were recorded from each stained sample at diagnosis. For data analysis BD FACS Diva and Infinicyt software (Cytognos) were used.
The reference MFI values of the antigens of interest on appropriately selected positive and negative reference populations (see below) were obtained after averaging the MFI values observed in 18 normal BM samples of hematologically normal individuals. Then, per individual marker, the two mean MFI values for both control types, i.e., the positive reference population (with the highest observable expression on normal cells) and the negative reference population (not expressing a given antigen) were subtracted and divided into 10 equal intervals in order to calculate a single step of the normalized antigen expression scale (the nMFI scale), separately for the 8-color and 10-color panel, as described by Sędek et al. [27, 28]. For almost all studied B-lineage markers, mature T and NK cells served as a negative reference population. The exceptions were CD45, CD38 and CD81, for which erythroblasts were the negative control population. Mature T and NK cells were identified by high expression of CD45 and lack of CD19. Erythroblasts were identified on FSC/SSC and CD45/SSC density dot plots which enabled a regularly shaped, CD45-negative population to be identified in the lymphoid region. In turn, the positive reference cell type depended on the marker: for CD20, CD21, CD22, CD24, CD45, CD73 and cyCD79a mature B lymphocytes were chosen, for CD10, CD34, CD58, TdT – pre-B-I cells, for CD9 and CD81 – immature B-cells, for CD13 and CD66 – granulocytes, for CD38 and CD86 – plasma cells, for CD304 – dendritic cells, for CD123 – basophils. According to the above described approach, the nMFI score of 0 corresponded to the negative reference cell population, while for the positive reference cell population the nMFI score was 10. Expression (MFI) of a particular marker on leukemic blasts was further compared against the nMFI scale created in this way and was assigned a score of 0-10. Since the antigen-specific MFI intervals could be extrapolated beyond the maximal value for normal cells, antigen overexpression could be revealed on leukemic blasts.
DNA ploidy status analysis by flow cytometry
To determine the DNA content in BM samples at the time of diagnosis, the cells were stained with propidium iodide using the Cycle Test Plus DNA Reagent Kit (Becton Dickinson) following the protocol provided by the manufacturer. Subsequently, 12,000 events per sample were recorded with the flow cytometer at an average rate of 100 events/s. The samples were filtered through a 50 µl filter immediately before analysis. Human peripheral blood lymphocytes from healthy individuals were similarly prepared and served as a control to identify the peak of diploid cells. The data were recorded with BD FACS Diva software and the cell cycle analysis with ModFit software version 5.0 (Verity Software House). Then, the DNA index (DI) of aneuploid samples, the percentage of cells in the S phase (SPF) and the coefficient of variation (CV) were determined. The presence of two G0/G1 peaks was considered as evidence of aneuploidy and the DNA index was calculated for the aneuploid peak. DI was measured according to the standard techniques based on Vindelov’s guidelines [29]. The patients were categorized into four groups depending on DI score: as diploid (DI 0.95-1.05) and aneuploid: low-hyperdiploid (DI 1.06-1.15), high-hyperdiploid (DI 1.16-1.41) and near-tetraploid (DI 1.79-2.28), based on published literature [30-33].
Statistical analysis
All statistical analyses were performed using Statistica 13.3 (StatSoft, Tulsa, USA). The normality of results distribution was examined by the Shapiro-Wilk test. To determine the statistical significance of differences observed between groups, either the Kruskal-Wallis test or the Mann-Whitney U test was used. P-values < 0.05 were considered significant. All statistical analyses were performed at the Medical University of Silesia in Katowice (Zabrze, Poland).
Results
Data on the EGIL immunological subtype of BCP-ALL were available for 267 patients, out of which 73% (n = 194) had common, 22% (n = 59) pre-B-ALL and 5% (n = 14) pro-B-ALL. The sex ratio was 1.21 (boys/girls). In this study aneuploidy was seen most frequently in patients with common and pre-B-ALL in 21% (41/194) and 15% (9/59), respectively. Aneuploidy in the pro-B-ALL subgroup was not observed.
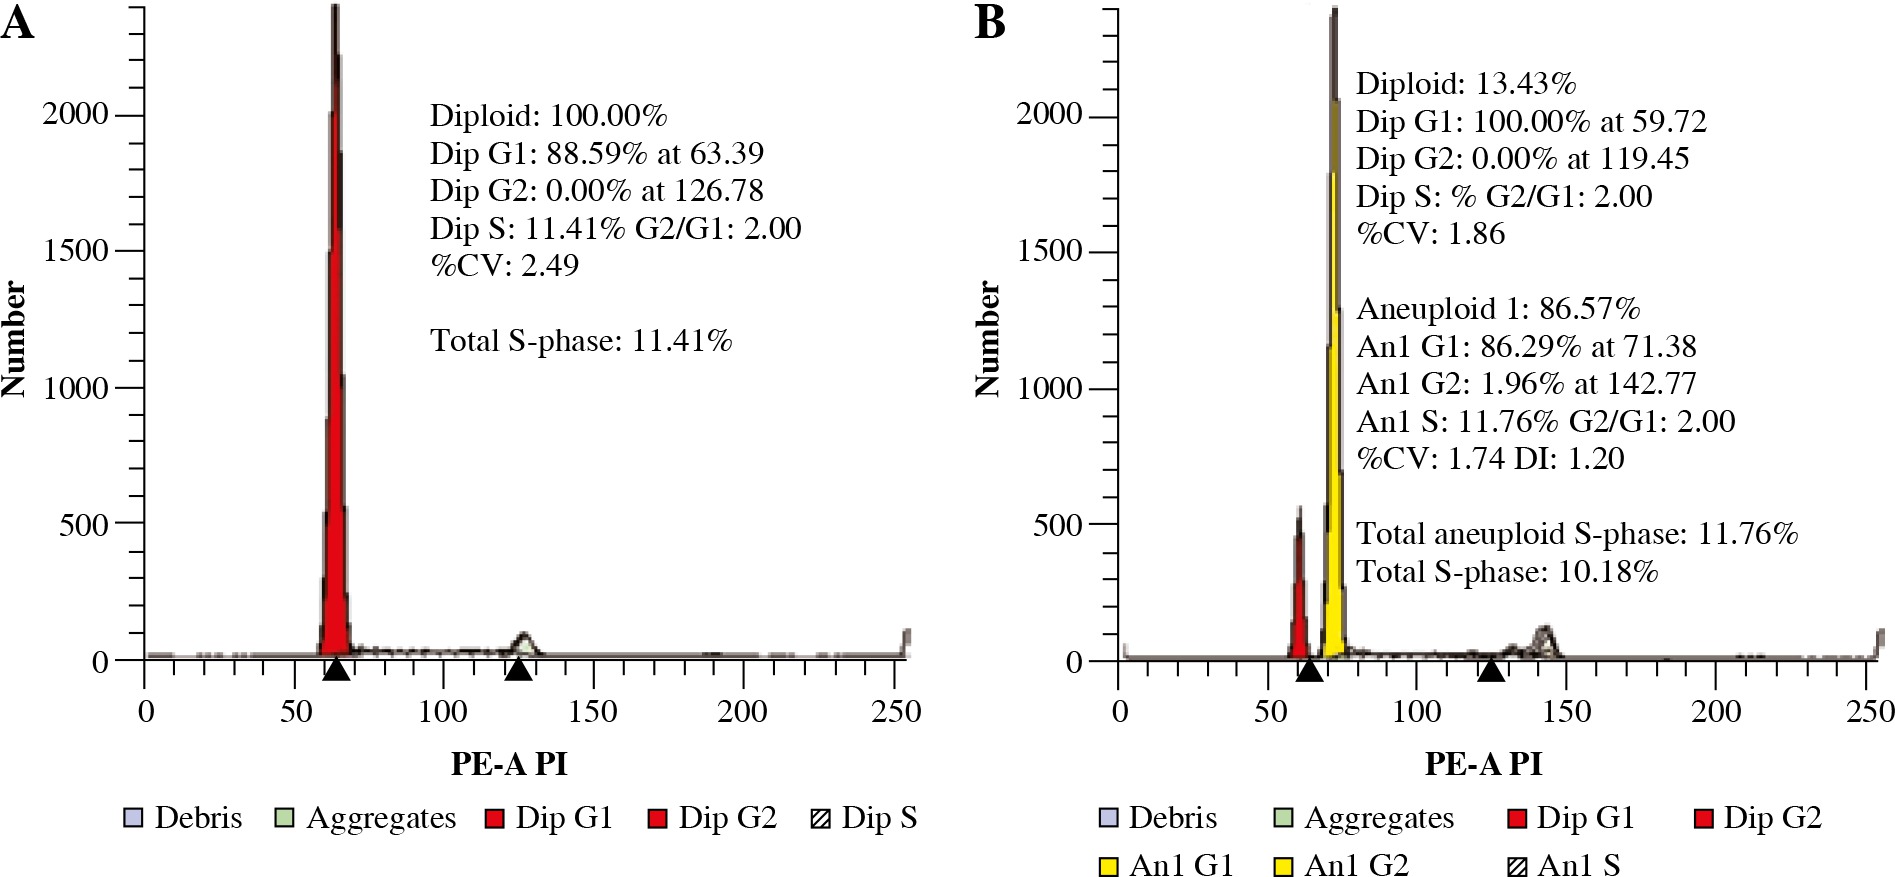
Determination of the DI was done for all patients. The presence of the aneuploid peak with an increased DNA content was identified in 50/267 (19%) of BCP-ALL patients (DI value ranged from 1.07 to 2.00). Diploidy was seen in 81.3% (n = 217), low hyperdiploidy in 2.6% (n = 7), high hyperdiploidy in 14.2% (n = 38) and near-tetraploidy in 1.5% (n = 4). There was only a single hypodiploid case documented. Because of the limited number, this subgroup was not further evaluated. In most of the aneuploid cases, a single population was detected, while in 1 case more than one blast cell clone was detected. The percentage of cells in the S phase (SPF) was automatically determined with the ModFit software. Examples of histograms are presented in Figure 1.
Fig. 1
Representative histograms showing absence (A) and presence (B) of hyperdiploidy. A) Diploid peak of BCPALL blasts in G0/G1 phase with normal DNA content. B) Coexistence of blasts with diploid (red) and hyperdiploid DNA content (yellow)
We then examined the correlation of ploidy status with the biological and clinical features of these patients, as well as their early response to treatment. The percentage of leukemic blasts at diagnosis was lower in high hyperdiploid BCP-ALL cases than in diploid (79% vs. 85.7%, p = 0.001). The high hyperdiploid BCP-ALL patients had a significantly lower WBC count as compared to other groups of ploidy (p = 0.006). No significant differences were observed with respect to the age, SPF and MRD level at days 15 and 33. The clinical and biological characteristics of the disease in diploid and aneuploid BCP-ALL cases are shown in Table 2.
Table 2
BCP-ALL patient characteristics according to ploidy group
The comparison between diploidy and aneuploidy for all analyzed antibodies assessed as nMFI, separately for the 8-color and 10-color panel, is shown in Table 1. For CD21 and CD58 the differences were due to a lack of antigens in the 10-color panel. Conversely, CD73, CD86 and CD304 were not measured in the 8-color panel. It can be noted that statistical significance of CD24 was observed only in the 8-color antibody panel. Data indicate that the high hyperdiploid BCP-ALL patients showed significantly higher expression of CD9, CD20, CD22, CD58, CD66, CD86 and CD123 as compared to other groups of ploidy. However, CD45 showed decreased expression. The expression profile expressed as nMFI values according to ploidy status is shown in Table 3 and Figure 2. Additionally, expression of antigens was analyzed in specific subtypes of leukemia, separately for common and pre-B-ALL. Significant differences in expression of CD9 (p = 0.001), CD20 (p < 0.001), CD22 (p = 0.016), CD45 (p = 0.005), CD58 (p < 0.001), CD66c (p < 0.001), CD86 (p < 0.001) and CD123 (p < 0.001) were found between aneuploid and diploid common ALL patient. However, in pre-B-ALL cases significant differences were found only in CD22 (p = 0.024) and CD123 (p = 0.016). All other differences were non-significant. Aneuploidy in pro-B-ALL subtype was not observed. Altogether, these data suggest an immunophenotypic difference between the leukemia subtypes. However, these differences may be due to group size differences as the common ALL subtype was the most common aneuploidy subtype in the study group. Expression profile assessed as nMFI values according BCP-ALL subtypes is shown in Table 4.
Fig. 2
Antigen expression according to ploidy status on leukemic BCP-ALL blasts at diagnosis expressed as nMFI values
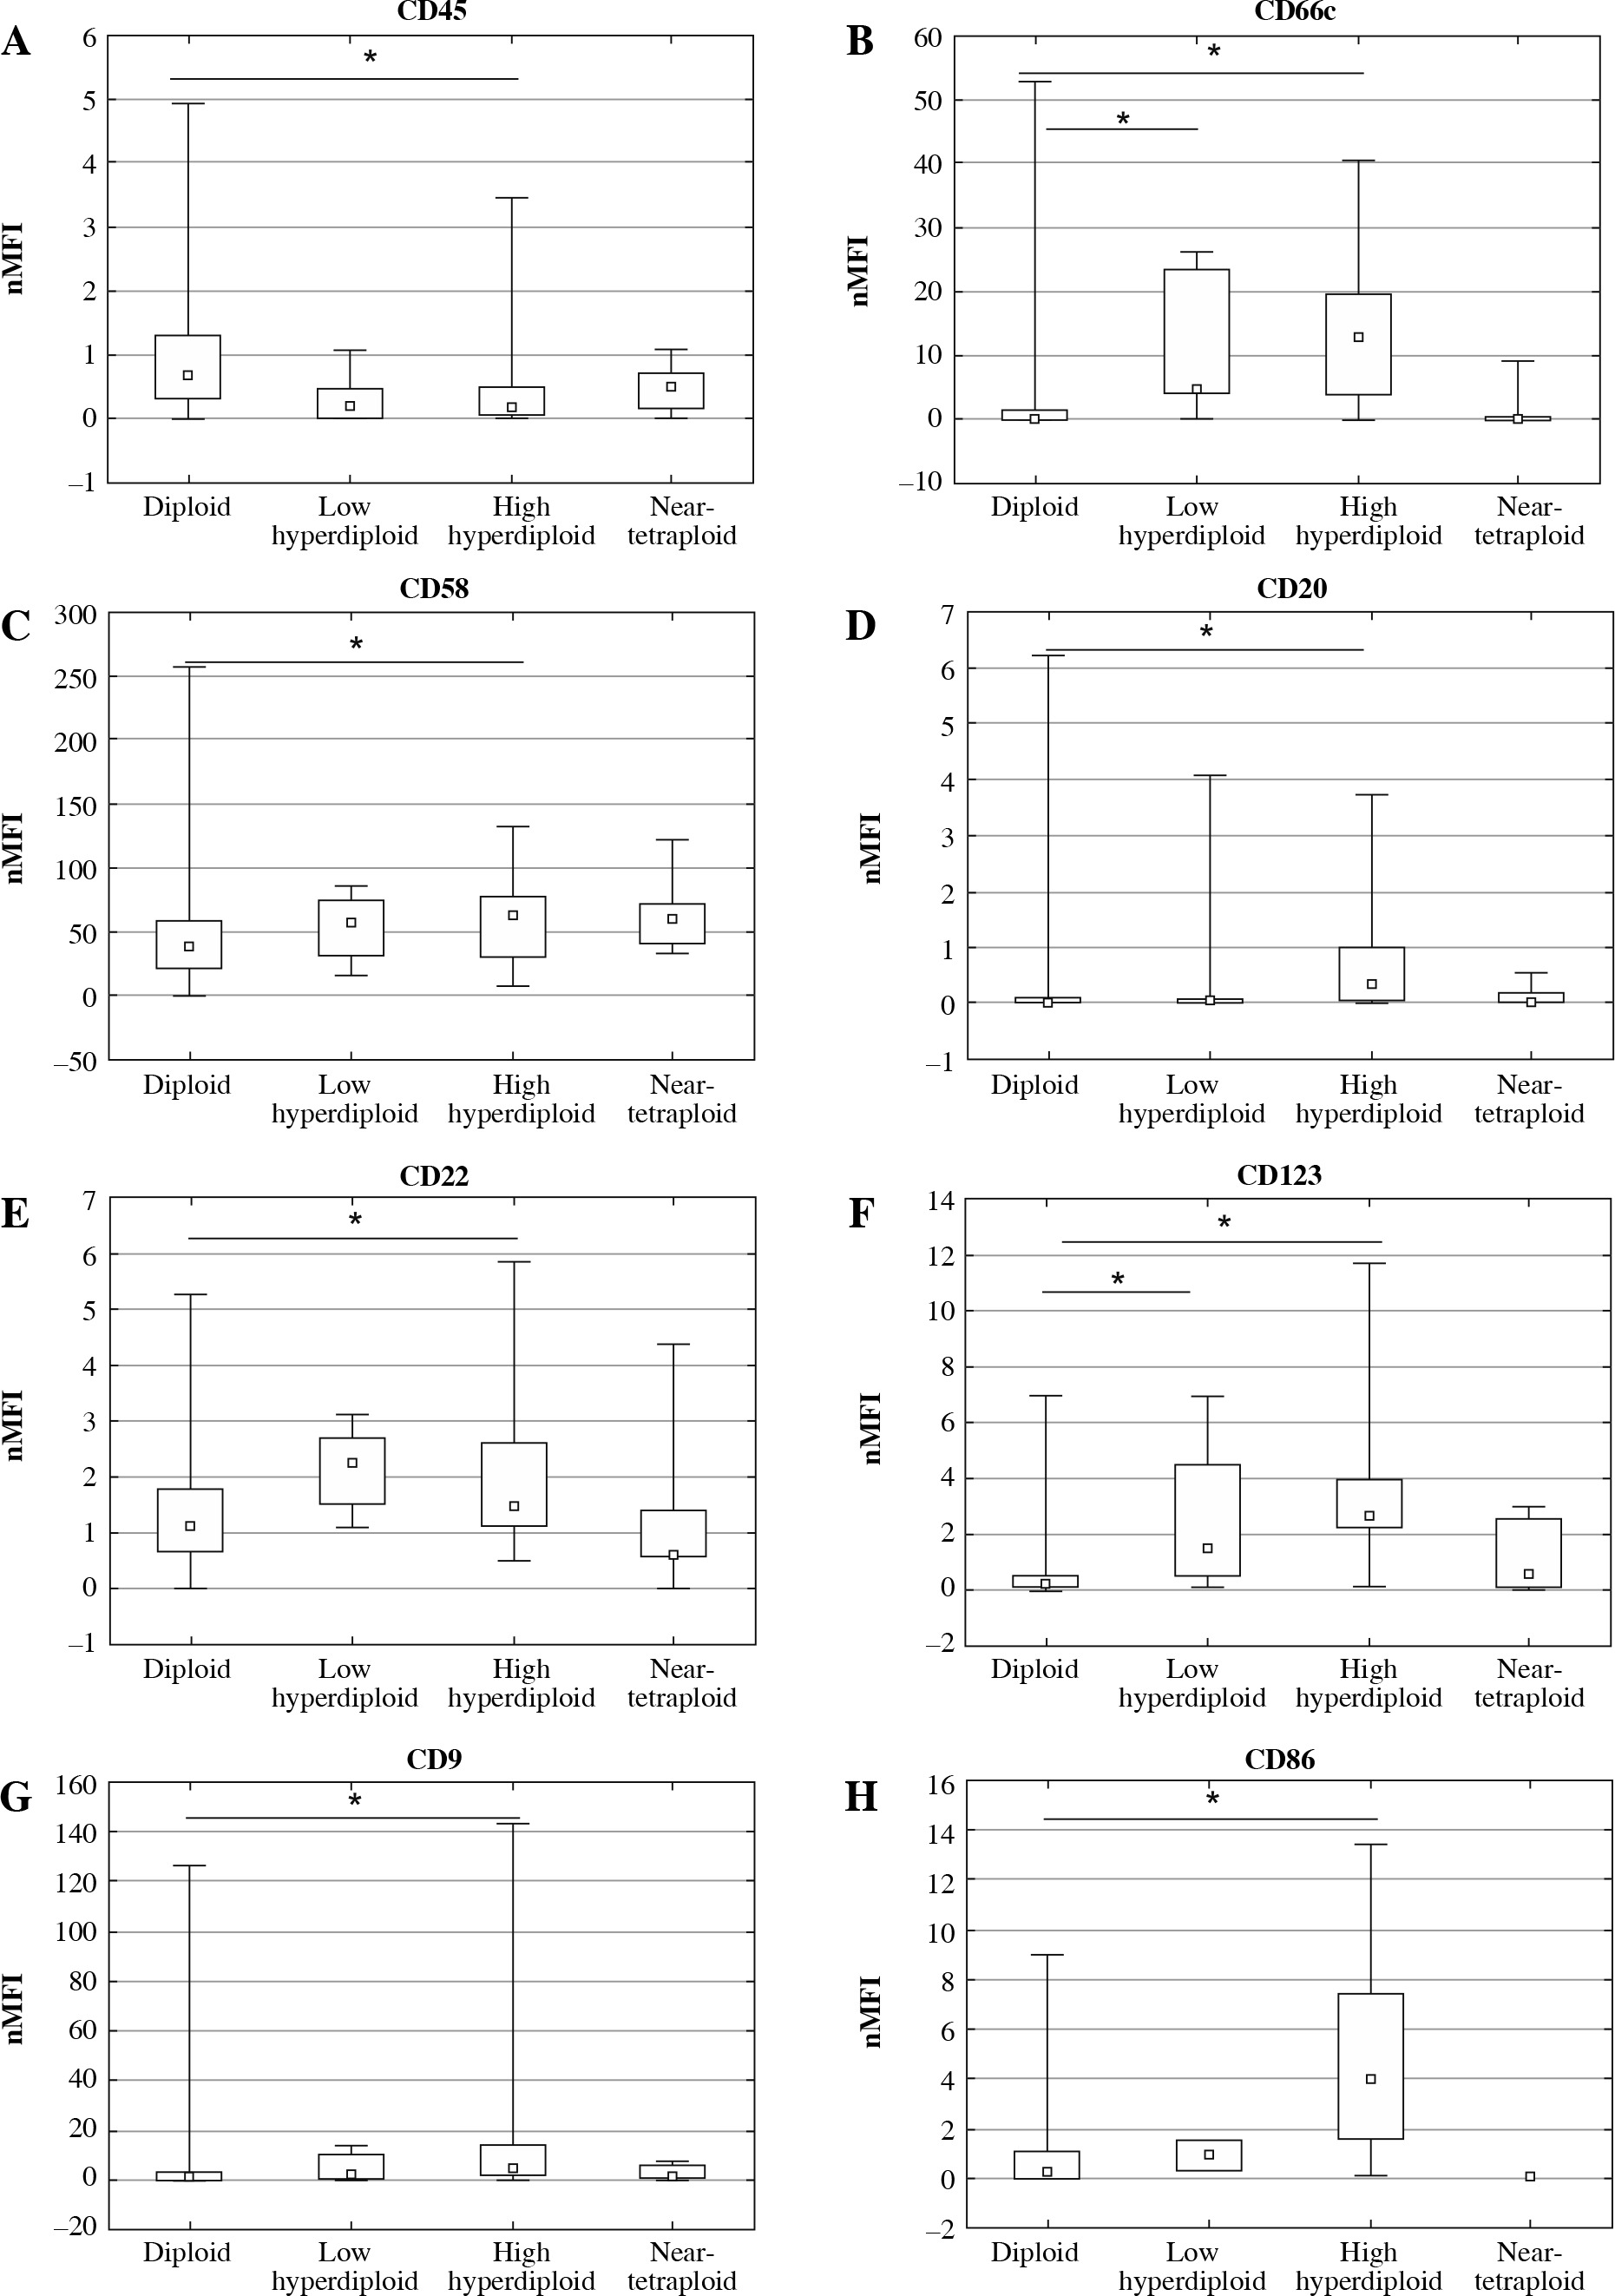
Table 3
Expression of district markers on blast cells from BCP-ALL cases expressed as nMFI values according to the ploidy group
Table 4
Expression of district markers on blast cells from BCP-ALL cases expressed as nMFI values in specific BCP-ALL subtypes
Discussion
The most frequent cytogenetic abnormality in children with BCP-ALL is hyperdiploidy. Numerous studies confirm that specific immunophenotypic profiles, as well as cytogenetic and molecular abnormalities, have been associated with prognosis [20, 21]. In this study we performed an analysis of the incidence of DNA aneuploidy in 267 Polish children with BCP-ALL. In this series, 19% of BCP-ALL patients had aneuploidy, most of which were common ALL cases. This rate is similar to that reported by others, ranging between 19% and 30% [14, 34, 35].
It was of interest to determine whether any specific immunophenotypic profiles were associated with numerical changes in BCP-ALL patients. Therefore, we evaluated 20 antibodies currently used in diagnosis of BCP-ALL. In our study, the expression of CD123 (IL-3 receptor α chain) was associated with hyperdiploidy (p < 0.001), which remains in accordance with the literature data reporting higher rates of CD123 overexpression in 81% of high hyperdiploid BCP-ALL patients [22, 36]. In this series, expression of CD123 was significantly higher in high hyperdiploid and in low hyperdiploidy as compared with other ploidy groups. High hyperdiploid BCP-ALL cases were also more frequently associated with CD58 overexpression, CD66c positivity and the absence of CD45. These findings are in agreement with the literature data [20, 22, 37]. Among myeloid markers coexpressed on blast cells in BCP-ALL, only CD66c (clone KOR-SA3544) was observed [38]. In our study, higher expression of CD66c was observed in both low hyperdiploidy and high hyperdiploidy cases. Coustan-Smith et al. [39] reported an association between hyperdiploidy and expression level of CD86, which was also confirmed in our study. Also, CD9 expression correlated with high hyperdiploidy. Data available on CD22 expression are currently more limited. Despite this, Seegmiller et al. [40] previously reported expression of this marker in BCP-ALL with hyperdiploidy, as also confirmed here. We also observed more frequently expression of CD20 in high hyperdiploid BCP-ALL patients as compared to other groups of ploidy. However, its expression was dependent on the BCP-ALL subtype, as reported in Table 4. Furthermore, expression of CD45 was decreased for all patients with aneuploidy, especially in the high hyperdiploidy subgroup.
In this study, significantly lower WBC values were found in high hyperdiploid BCP-ALL patients as compared with other groups (p = 0.006) which is in accordance with other authors [7, 41].
In the present study we also analyzed the relationship between ploidy group and the S-phase fraction (SPF) in patients with BCP-ALL. SPF is considered as an additional objective parameter for predicting the therapeutic response. A large number of studies have demonstrated the prognostic significance of FC analyses of SPF in many cancer types [42, 43]. Smets et al. reported that ALL patients with SPF higher than 6% have worse outcome than those with lower SPF [30]. In our series, however, no significant correlations of SPF between ploidy group were found.
Many studies have confirmed that hyperdiploid BCP-ALL patients are more sensitive to treatment [44, 45]. We tried to address this in our study by comparing the initial response to treatment measured as MRD levels at days 15 and 33. The results did not reveal significant differences between MRD levels (either at day 15 or at day 33) between the 4 different groups of ploidy. This may suggest that currently used therapeutic protocols are equally effective for both diploid and hyperdiploid patients.
In our study, we demonstrated the utility of selected antigens to identify high hyperdiploidy. The most significant differences between high hyperdiploid and diploid cases concerned the expression of CD9, CD20, CD22, CD45, CD58, CD66c, CD86 and CD123 antigens. This proves that high hyperdiploid childhood BCP-ALL with 51-65 chromosomes constitutes a biologically distinct subtype of childhood ALL. Furthermore, the combination of herein proposed antigens may serve as a target for treatment with monoclonal antibodies for leukemia therapy. Overall, DNA ploidy analysis by FC is a simple technique, which can be used for patient stratification at the time of diagnosis, before genetic testing is performed. Nevertheless, extended studies on larger series of patients are required to determine the role of aneuploidy in leukemia initiation and progression, and its potential meaningfulness for targeted therapies.
Conclusions
The findings of the current study suggest that aneuploidy in BCP-ALL patients can be characterized by specific immunophenotypic signatures, not only limited to CD123 (over)expression. Differential expression of such markers as CD9, CD20, CD22, CD58, CD66c, CD86, CD123 and CD45 may indicate the presence of high hyperdiploidy, thus aneuploidy detection-oriented panels should contain these markers. The normalized system of quantitative antigen expression presented herein is more precise and more suitable for statistical analyses than antigen percentage positivity or qualitative annotations (i.e., positive, dim, negative, heterogeneous, etc.) used so far. Therefore this newly developed system was applied to analyze the correlations between different genetic abnormalities and quantitative expression of particular markers. Even though high hyperdiploidy is currently not used for patient stratification, it is usually associated with a favorable prognosis, especially in the absence of other genetic abnormalities and defined markers of adverse prognosis, which might be useful for treating clinicians. Understanding the phenotypic diversity of aneuploid B-ALL may contribute to the design of targeted therapies against this subtype.