Introduction
Multiple sclerosis (MS) is the most common autoimmune disease of the central nervous system (CNS) exhibiting heterogeneous immunopathological and clinical phenotypes [1]. Although all factors contributing to this heterogeneity have not been fully elucidated, it is strongly believed that genetic factors influencing immune-mediated inflammation play the major role in shaping clinical phenotype of the disease [2]. Consistently, the clinical course of experimental autoimmune encephalomyelitis (EAE), the most frequently used experimental model of MS [3], can be variable depending on the animal species, strain, and commercial source [4-6]. The incidence of MS and its clinical presentation also vary with age [7, 8]. This phenomenon most likely reflects not yet completely understood age-related immune changes [7, 8]. Typically, the first MS symptoms appear between the ages of 20 and 40 years, whereas they rarely occur after age of 60 years [9]. Like MS, aging influences an individual animal’s susceptibility to the induction of EAE [10-14]. Given that in most models of immunization with autoantigens, the autoantigen-specific immune responses can be detected even if clinical disease does not follow immunization, it has been assumed that mechanisms controlling effector cell activation and damaging capacity are responsible for the progression to clinical disease [15, 16]. Thus, apart from autoreactive neuroantigen-specific CD4+ T lymphocytes, which are major initiators and mediators of the disease in most EAE models, many other types of immune cells are suggested to contribute to EAE development exerting either detrimental or protective role [3]. Natural killer (NK) cells, which are known to interact with various components of the immune system, have been suggested to participate in both early preclinical and late effector stages of EAE pathogenesis by affecting self-reactive CD4+ T cell priming in draining lymph nodes (dLNs) [17] and their survival in the CNS [18, 19], respectively.
Animal studies have shown that upon stimulation with adjuvants, NK cells are rapidly recruited to LNs [17] and accumulating in the areas where naive CD4+ T lymphocytes encounter migratory dendritic cells (DCs) presenting antigens taken up in peripheral tissues to initiate CD4+ T lymphocyte response [20]. This localization enables them to prime DCs, and thereby influences the outcome of DC/CD4+ T cell interactions [17, 21]. Consistently, the signals generated by intricate NK cell/DC interplay in dLNs during the initial phase of EAE impacts the downstream (auto)immune CD4+ T lymphocyte response in experimental animals upon inoculation with spinal cord (SC) homogenate, or many of the CNS proteins or peptides that myelin comprises in complete Freund’s adjuvant (CFA), and thereby the outcome of immunization [22]. However, it is also clear that the outcome of an (auto)immune response cannot be predicted solely by the events occurring in dLNs. The appearance of clinical manifestations in EAE requires the homing of neuroantigen-reactive CD4+ T cells to the CNS, where they undergo reactivation, further differentiation and expansion, recruit other types of immune cells from blood into the CNS and activate microglia to damage the tissue and initiate inflammation [3]. It has been shown that NK cells infiltrating the CNS could influence the severity of nervous tissue damage [18, 19]. Additionally, what has become clear over the last years is that the impact of NK cells on the immune response is highly dependent on the subset involved, as well as the site and milieu in which the interactions occur [23]. Therefore, even though initially NK cells have been thought to promote adaptive immune responses, emerging evidence from in vitro and in vivo analyses suggest that they can also prevent, terminate, and/or limit adaptive immune responses [18, 19, 22, 24]. Consistently, there is accumulating body of evidence suggesting that NK cells, depending on the subset and site of action, could have not only promoting, but also protective role in EAE [19, 22, 24]. The protective role of NK cells in EAE was linked with their action in the target tissue, as impaired recruitment of mature NK cells to the CNS in CX3CR1-deficient mice leads to more severe EAE, when compared with wild-type controls [18, 19].
It should also be noted that NK cell number and functional capacity may vary depending on genetic background of experimental animals [25-28]. A higher frequency of NK cells was observed among splenic mononuclear cells from young Dark Agouti (DA) rats compared with Albino Oxford (AO) rats [25]. Strain-specific differences in NK cell functional capacity are shown to contribute to differences in mouse susceptibility to lung cancer [28] and cytomegalovirus tissue damage [27]. In the same vein are data indicating that NK cells from AO rats lyse allogeneic lymphocytes of most MHC constitutions in vivo, whereas those from DA rats do not kill any allotargets [26]. Additionally, aging increases the count of NK cells in human peripheral blood and affects the ratio between CD56dim (cytotoxic) and CD56bright cells (responsible for cytokine production) among them [29]. Moreover, it was shown that: i) aging in C57BL/6 mice affects ability of mature NK cells to migrate from blood to LN draining the site of infection, and ii) this defect is critical for their age-dependent loss of natural resistance to mouse pox infection [30]. There is also ample evidence suggesting that NK cell cytotoxicity at the single cell level diminishes with aging [29, 31]. Finally, it should be emphasized that the putative significance of either age-related changes in NK cell number and function, or strain differences in these immune parameters for development of autoimmune diseases has not been investigated yet.
Considering all the aforementioned, we hypothesized that age- and strain-specific differences in NK cell number and action in dLNs and/or SC target tissue could contribute to strain-related specificities in age-associated changes in rat susceptibility to EAE. To test the hypothesis, we examined the number and functional properties of NK cells in dLNs and SCs from two rat strains exhibiting relative resistance (AO rats) and susceptibility to EAE induction (DA rats) in young adult age, and age-related changes in the susceptibility to EAE induction in the opposite direction [6, 14].
Material and methods
Experimental animals, EAE induction and evaluation
In the hereby presented study young (2- to 3-month-old) and aged (22- to 24-month-old) female DA and AO rats were used. In the study, were included animals without any apparent clinical signs of neural disorders. All rats were from breeding colonies at the Immunology Research Center “Branislav JankoviĆ” in Belgrade. The animals were maintained under standard laboratory conditions and monitored on a daily basis by animal care staff and a veterinarian. Animal care and all experimental procedures were performed in accordance with the Directive 2010/63/EU of the European Parliament and of the Council on the protection of animals used for scientific purposes (revising Directive 86/609/EEC), and approved by the Institutional Animal Care and Use Committee.
EAE was induced by a hind footpad injection of 100 µl of rat SC homogenate in phosphate-buffered saline (PBS), mixed with equal volume of CFA containing 1 mg/ml of heat-killed and dried Mycobacterium tuberculosis H37Ra (Sigma-Aldrich Chemie GmbH, Taufkirchen, Germany), supplemented by an injection of 0.25 ml of 5 × 10⁸ Bordetella pertussis (Institute of Virology, Vaccines and Sera “Torlak”, Belgrade, Serbia). Rats were weighed and graded daily (by two independent experienced observers) for neurological deficit, as follows: 0 = no clinical signs; 0.5 = distal tail atony; 1 = complete tail atony; 2 = paraparesis; 3 = paraplegia; 4 = tetraplegia, moribund state, or death. None of the rats reached moribundity during the study. For those which developed neurological signs of EAE, to facilitate access to food and hydration, mashed food and water were positioned lower. None of rats experienced reduction in body weight greater that 10%.
Immunized animals were sacrificed by intracardial perfusion in either the inductive phase of EAE, on the 7th day post-immunization (d.p.i.), or in the effector phase, when the neurological deficit reached the maximum/plateau value, i.e. on the 13th and 16th d.p.i. in DA and AO rats, respectively [14]. None of old animals showed macroscopic signs of illness at necropsy.
Isolation of mononuclear cells
For isolation of mononuclear cells from dLNs and SCs, rats were deeply anesthetized with an i.p. injection of ketamine/xylazine anesthetizing cocktail (80 mg/kg body weight/ 8 mg/kg body weight). After perfusion, their dLNs and/or SCs were collected for analyses. To obtain single cell mononuclear cell suspensions, SCs and dLNs were grinded on 70 µm nylon cell strainer (BD Biosciences, Erembodegem, Belgium) and collected in either PBS supplemented with 2% fetal calf serum (FCS, Gibco, Grand Island, NY, USA) and 0.01 % NaN3 (Sigma-Aldrich Chemie GmbH) (FACS buffer) (dLN cells), or RPMI 1640 medium (Sigma-Aldrich Chemie GmbH) supplemented with 5% FCS (SC cells). SC cells were fractioned on a discontinuous 40/70% percoll (Sigma-Aldrich Chemie GmbH) gradient at 1,000 × g for 50 min, and mononuclear cells from the interface were collected. In that way obtained mononuclear dLN and SC cells were counted in 0.2% trypan blue solution using an improved Neubauer hemacytometer.
Stimulation of dLN mononuclear cells for analyses of IFN-γ or IL-10 production
Mononuclear dLN cells were cultured at a density of 1 × 10⁶/ml in complete RPMI 1640 culture medium [RPMI 1640 medium supplemented with 2 mM L-glutamine (Serva, Heidelberg, Germany), 1 mM sodium pyruvate (Serva), 100 units/ml penicillin (ICN,Costa Mesa, CA, USA), 100 µg/ml streptomycin (ICN), and 10% FCS], with the addition of 200 ng/ml phorbol 12-myristate 13-acetate (PMA, Sigma-Aldrich Chemie GmbH) and 400 ng/ml ionomycin (Sigma-Aldrich Chemie GmbH) in the presence of 3 µg/ml of brefeldin A (eBioscience, San Diego, CA, USA) in a 5% CO2 humidified atmosphere for 4 h at 37°C. Following the incubation, the cells were harvested and subjected to intracellular IFN-γ or IL-10 immunostaining.
Cultivation of dLN cells for analyses of cell proliferation
Mononuclear dLN cells were cultured in 96-well plates at a density of 2 × 10⁵/ml without or with 2.5 µg/ml of concanavalin A (ConA, Sigma-Aldrich Chemie GmbH) or 20 µg/ml of myelin basic protein (MBP, Sigma-Aldrich Chemie GmbH) for 72 h, in a 5% CO2 humidified air atmosphere at 37°C.
Cell immunostaining and flow cytometry analysis
Antibodies and immunoconjugates
For immunolabeling, the following monoclonal antibodies (mAbs) were used: fluorescein isothiocyanate (FITC)/phycoerythrin (PE)-conjugated anti-CD161a (clone 10/78), FITC/PE/allophycocyanin (APC)-conjugated anti-CD8 (clone OX-8), peridinin-chlorophyll-protein (PerCP)-conjugated anti-TCRαβ (clone R73), PE-conjugated anti-CD4 (clone OX-38), biotin-conjugated anti-CD80 (clone 3H5), FITC-conjugated anti-RT1B (MHC II, clone OX-6), biotin-conjugated anti-CD86 (clone 24F), FITC-conjugated anti-IFN-γ (clone DB-1), and PE-conjugated anti-IL-10 (clone A5-4). These mAbs as well as PerCP-conjugated streptavidin and PE-conjugated donkey anti-rabbit F(ab’)2 IgG as a second step reagents were obtained from BD Biosciences (Mountain View, CA, USA). Following mAbs were also used: PE-conjugated anti-αOX-62 integrin subunit (anti-OX62; clone OX-62) from Serotec (Oxford, UK), PerCP-eFluor® 710-conjugated anti-CD25 (clone OX39) and FITC-conjugated anti-Foxp3 (clone FJK-16s) from eBioscience, FITC-conjugated anti-granzyme B (clone GB11) from BioLegend (San Diego, CA, USA) and APC-conjugated anti-CXCR3 (clone 868013, R&D Systems, Inc., Minneapolis, MN, USA). Rabbit anti-CX3CR1 was purchased from Abcam (Cambridge, UK).
Surface antigen immunostaining
Cells were incubated with saturating concentrations of either fluorochrome-labeled mAbs or unconjugated/biotin-conjugated Abs for 30 min and washed in FACS buffer. When biotin-conjugated/unconjugated Abs were applied, cells were incubated with appropriate second step reagents for additional 30 min, washed and collected for flow cytometry analysis. All incubation steps were performed at 4°C in the dark.
Intracellular antigen immunostaining
For intracellular staining of IFN-γ, IL-10, Foxp3, and granzyme B, dLN and/or SC mononuclear cells were stained for surface antigens; then fixed/permeabilized overnight at 4°C, using the fixation/permeabilization buffer kit (eBioscience). Following fixation/permeabilization, the cells were washed and then stained with fluorochrome-conjugated mAbs for 30 min at room temperature in the dark, washed again and collected for flow cytometry analysis. Intracellular antigens were stained with appropriate monoclonal antibodies according to the manufacturers’ instructions.
7-AAD staining for cell cycle analysis
Following 72 h culture, dLN cells were surface-stained for CD4/CD8, resuspended in 50% FCS in PBS, and then fixed/permeabilized overnight at 4°C using 70% ethanol. Next, the cells were washed and incubated with 7-AAD (BD Biosciences) at 4°C for 30 min. Doublets were excluded by analyzing the correlated area against the width signals of 7-AAD fluorescence on doublet discrimination module (DDM) dot plot. The frequency of proliferating CD4+ cells was determined using Dean-Jet-Fox model of the cell cycle platform generated by the FlowJo software version 7.8. (TreeStar Inc., Ashland, OR, USA).
Flow cytometry analysis
For flow cytometry analysis, 20,000-50,000 cellular events per sample were acquired on analog FACSCalibur and/or digital FACSVerse flow cytometers. The comparability of data obtained on the two flow cytometers was proven by acquiring cells from the same sample side-by-side on both the instruments. The data were analyzed for frequency of a marker positive cells using FlowJo software version 7.8 (TreeStar Inc., Ashland, OR, USA). IgG isotype-matched controls were used for each fluorochrome type, and fluorescence minus one controls were applied to settle gating boundaries.
Statistical analysis
Two-way analysis of variance (ANOVA) was performed on data sets with “rat strain” and “rat age” as interaction factors. Post hoc Bonferroni test was also performed as part of two-way ANOVA. All statistics were performed using GraphPad Prism 5 software (GraphPad Software, Inc., La Jolla, CA, USA). Results were expressed as means ±SEM. Differences were considered significant at p ≤ 0.05.
Ethics approval and consent to participate
The animal facilities were accredited by the Ministry of Agriculture and Enviromental protection of the Republic of Serbia (Veterinary Department), and the animals were bred and housed according to EU directive 2010/63/EU and the governmental regulations (Law on Animal Welfare, “Official Gazette of RS”, no. 14/2009). All animals were handled and treated in complete compliance with the Directive 2010/63/EU, as approved by the Institutional Animal Care and Use Committee of the Faculty of Pharmacy (permit number 6/12).
Results
Influence of aging on NK cell numbers in dLNs from DA and AO rats immunized for EAE
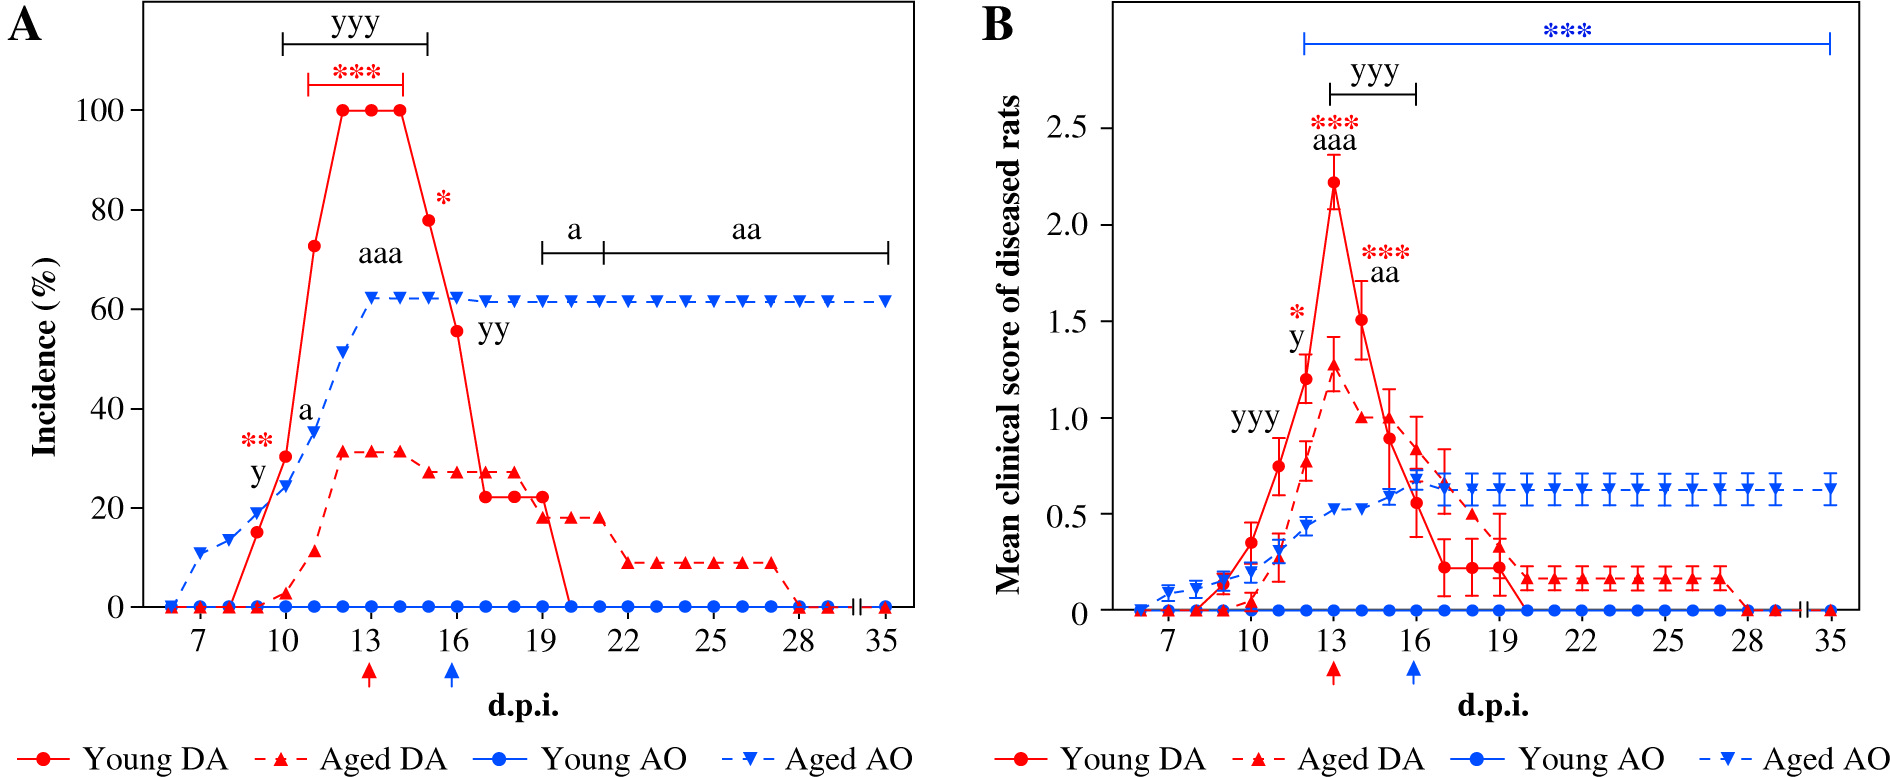
On the 7th d.p.i. the number of NK cells in dLNs from young and aged DA and AO rats was examined using flow cytometry analysis. NK cells were also enumerated in LNs isolated from age- and strain-matched non-immunized rats. As already reported [6, 14], all young DA rats developed monophasic self-limiting disease, whereas age-matched AO rats did not show signs of any neurological deficit (Fig. 1). With aging, the incidence and severity of EAE diminished in DA rats, whereas AO rats exhibited increased susceptibility to the development of clinical EAE (Fig. 1). In aged AO rats, milder but protracted neurological signs of the disease were observed when compared with their DA counterparts (Fig. 1). Additionally, differently from aged AO rats, which did not show any signs of recovery during the observation (until the 35th d.p.i.), aged DA rats exhibited spontaneous recovery after short duration of neurological signs (Fig. 1).
Fig. 1
Influence of aging on DA and AO rat susceptibility to EAE. Rats of DA (33 young and 35 aged) and AO (37 young and 37 aged) strains were immunized with homologous SC homogenate in complete Freund’s adjuvant and co-injected with Bordetella pertussis. Line graphs present (A) the daily incidence and (B) the daily clinical score of EAE (mean ±SEM) in diseased rats from four experiments showing independent clinical course of EAE. In the first experiment, rats of both strains (9 young and 11 aged DA rats; 13 young and 13 aged AO rats) were daily examined for the appearance of the neurological signs of EAE up to 35th d.p.i. In the next three experiments, rats (24 rats in each experiment, 6 rats per strain and age group) were sacrificed on the 13th (DA rats, indicated by red arrow) and the 16th d.p.i. (AO rats, indicated by blue arrow), i.e. on the d.p.i. when the rats reached maximal neurological score. DA young vs. DA aged: * p ≤ 0.05, ** p ≤ 0.01, *** p ≤ 0.001; AO young vs. AO aged: *** p ≤ 0.001; AO aged vs. DA aged: a p ≤ 0.05, aa p ≤ 0.01, aaa p ≤ 0.001; AO young vs. DA young: y p ≤ 0.05, yy p ≤ 0.01, yyy p ≤ 0.001
Next, as previously suggested [25], NK cells were identified by characteristic constellation of the surface CD161/CD8/TCRαβ markers (CD161+CD8+TCRαβ- cells), using flow cytometry (Fig. 2A).
As expected [17], irrespective of rat strain, small numbers of NK cells were retrieved from LNs of young non-immunized rats (Fig. 2A). However, fewer (p ≤ 0.001) cells were recovered from LNs of AO rats compared with DA ones (Fig. 2A). In rats of both strains, NK cell number diminished (p ≤ 0.001) with aging, but this decrease was particularly prominent in AO rats (Fig. 2A). Consequently, in non-immunized aged rats, NK cell number was fewer (p ≤ 0.001) in LNs from AO rats, when compared with that in DA rats (Fig. 2A).
Irrespective of age and strain, the number of NK cells increased (p ≤ 0.001) in dLNs following the immunization (Fig. 2A). In young immunized (EAE) rats their number was less (p ≤ 0.001) in AO rats compared with DA rats (Fig. 2A). Irrespective of rat strain, in EAE rats dLN NK cell number increased (p ≤ 0.05 and p ≤ 0.001 for DA and AO rats, respectively) with aging (Fig. 2A). This increase was more prominent in AO rats (approximately 4-fold) than in DA (approximately 1.2-fold) ones (Fig. 2A). Thus, more (p ≤ 0.05) NK cells were retrieved from dLNs of aged AO rats compared with age-matched DA ones (Fig. 2A).
Considering data indicating that NK cells are swiftly recruited to LNs draining sites of immunization or infection, in a CXCR3-dependent manner [17], dLN NK cells were examined for CXCR3 expression. In young EAE rats, the frequency of CXCR3+ cells was lower (p ≤ 0.001) among NK cells from AO rats compared with their DA counterparts (Fig. 2B). The frequency of CXCR3+ NK cells increased (p ≤ 0.001) in rats of both strains with aging, but in aged rats it was higher (p ≤ 0.001) in AO rats compared with DA rats (Fig. 2B). It is noteworthy that age- and strain-related differences in the frequency of CXCR3+ cells among dLN NK cells correlated with those observed in the number of NK cells in dLNs (Fig. 2).
Fig. 2
NK cell number and DC/NK cell ratio in EAE rat dLNs on the 7th d.p.i. (A) Bar graph shows NK cell numbers in dLNs from young and aged DA and AO rats immunized for EAE and in LNs from strain- and age-matched non-immunized rats. The number of CD161+CD8+TCRαβ- NK cells was determined using flow cytometry analysis. Gating strategy for NK cells was shown in the representative dot plot profiles (CD161+ cells were examined within gated CD8+TCRαβ- lymphocytes following live cell gating and elimination of cellular debris). (B) Representative flow cytometry contour plots indicate CXCR3 expression on NK cells from dLNs of (left) young and (right) aged (upper) DA and (lower) AO rats immunized for EAE (NK cells were gated as shown in dot plot flow cytometry profiles in A). Bar graph shows the percentage of CXCR3+ cells within NK cells from dLNs from young and aged rats of DA and AO strain immunized for EAE. (C) Bar graph shows the number of DCs. The number of OX62+ DCs was determined using flow cytometry. Gating strategy for OX62+ cells was shown in the representative dot plot (live mononuclear cells [MNC] were gated as shown in A). (D) Bar graph shows DC/NK cell ratio in dLNs from young and aged rats of DA and AO strain immunized for EAE. Results are from one of three independent experiments. Data are presented as means ±SEM (n = 6). * p ≤ 0.05; *** p ≤ 0.001; +++ p ≤ 0.001. + vs. age- and strain-matched non-immunized rats. Two-way ANOVA (strain × age) showed significant interactions between the factors for (A) NK cell number in non-immunized (F1,20 = 15.8, p ≤ 0.001) and rats immunized for EAE (F1,20 = 79.88, p ≤ 0.001), (B) the frequency of CXCR3 cells in NK cells from immunized rats (F1,20= 347, p ≤ 0.001), and (C) DC number in immunized rats (F1,20 = 109.4, p ≤ 0.001). (D) For DC/NK cell ratio significant (F1,20 = 34.74, p ≤ 0.001) main effect of strain was shown
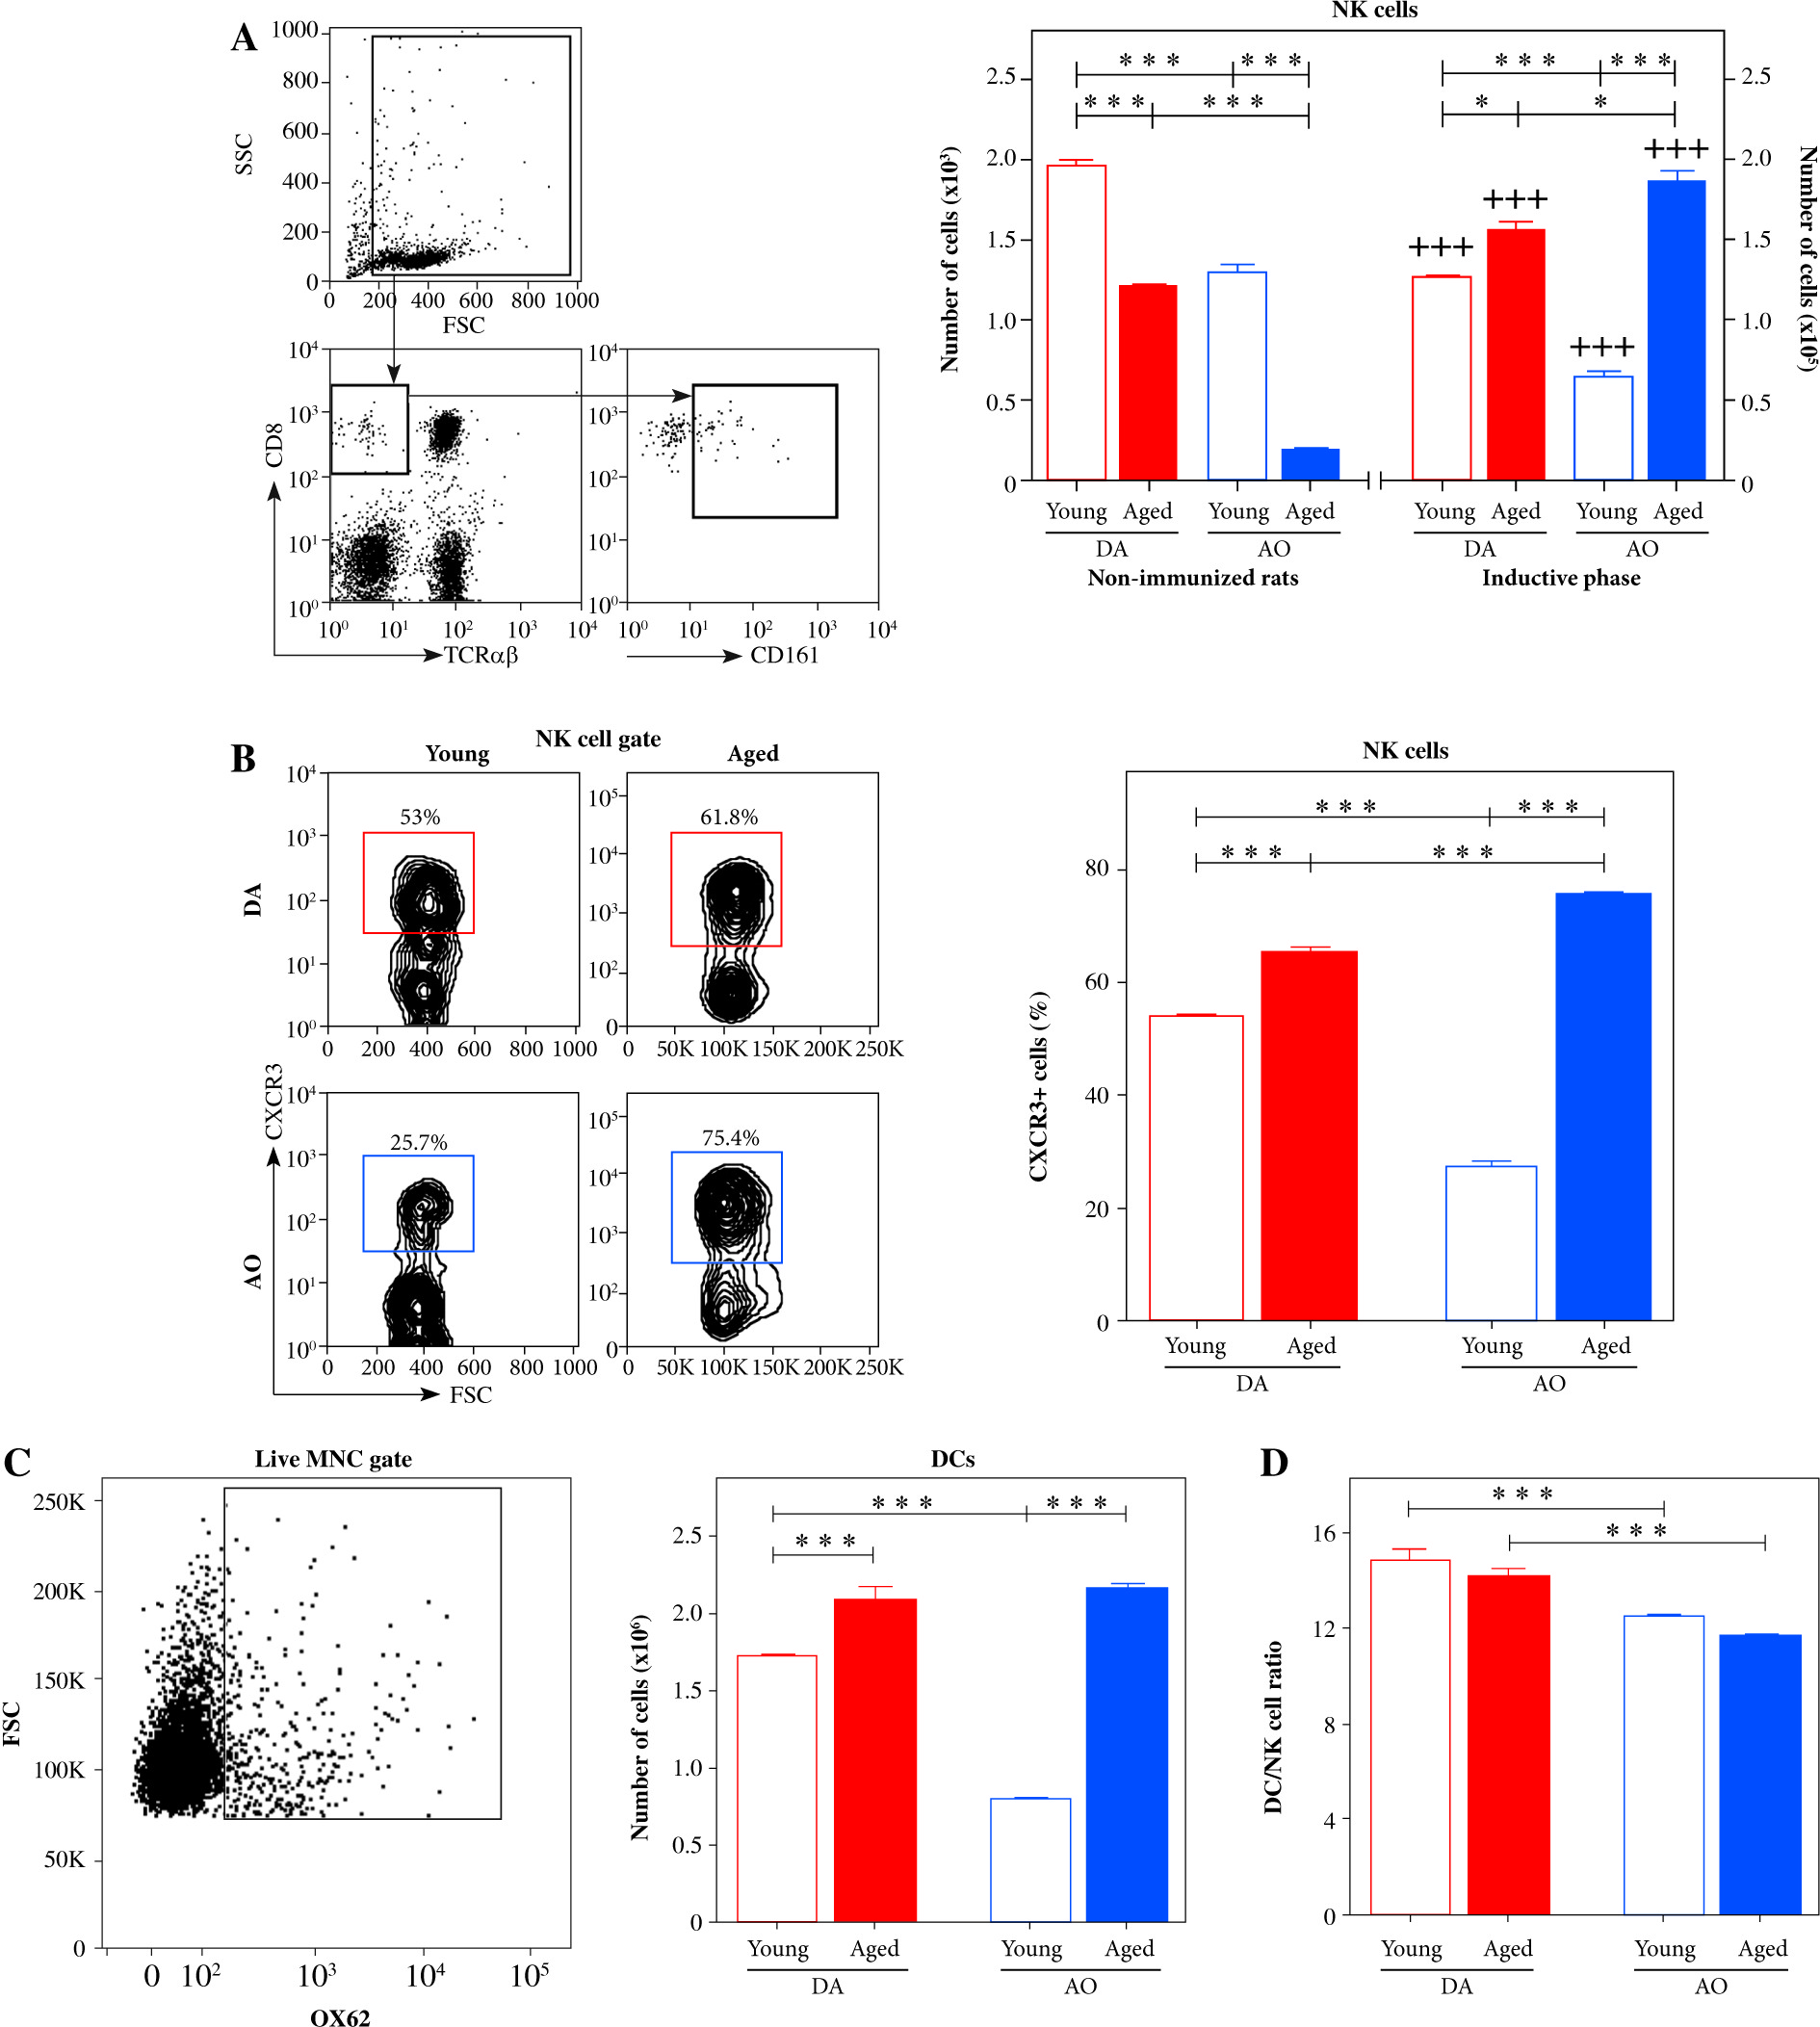
Influence of aging on DC/NK cell ratio, IFN-γ expression in NK cells, and activation/maturation of DCs in dLNs from DA and AO rats immunized for EAE on the 7th d.p.i
Next, we considered data indicating that: 1) the interaction between NK cells recruited into dLNs and antigen-carrying DCs is a critical point not only for DC maturation, but also for the fate of undergoing the antigen-specific CD4+ T lymphocyte response [32], and 2) DC/NK cell ratio is important for the outcome of this interaction [32]. Consequently, mononuclear cell suspensions recovered from dLNs were examined for the number of DCs using flow cytometry (Fig. 2C), and DC/NK cell ratio was determined. We focused on conventional DCs given that: 1) they are highly efficient in priming and polarizing encephalitogenic CD4+ T lymphocytes in EAE caused by immunization with myelin-associated peptide antigens [33], and 2) re-expression of MHC class II molecules on these cells in MHC class II-deficient mice was sufficient to mediate myelin peptide-induced EAE [34]. To identify conventional DCs (in further text DCs), anti-OX62 mAb was used [35], as shown in Figure 2C. On the 7th d.p.i., their number was lower (p ≤ 0.001) in dLNs from young AO rats than in those from age-matched DA rats (Fig. 2C). Irrespective of rat strain, DC number increased (p ≤ 0.001) with aging, but to a greater extent in AO rats (approximately 2.5-fold) than in their DA counterparts (approximately 1.3-fold). Consequently, the number of DCs did not significantly differ between aged DA and AO rat dLNs (Fig. 2C).
The ratio between DCs and NK cells was lower (p ≤ 0.001) in dLNs from young AO compared with DA rats (Fig. 2D). Aging influenced DC/NK cell ratio in neither DA nor AO rats (Fig. 2D). Thus, in aged rats, this ratio was lower (p ≤ 0.001) in AO compared with DA rats (Fig. 2D).
Next, considering that NK cells influence DC activation/maturation not only through direct cell-to-cell contact [32] but also through release of soluble cytokines, including IFN-γ [21], NK cells were examined for IFN-γ production. It is noteworthy that IFN-γ synthesis by NK cells requires direct cell contact between the infected DC and responding NK cells, indicating that IFN-γ-producing (IFN-γ+) NK cells are, in fact, those cells that formed successful synaptic contacts with DCs [36]. In young rats, the frequency of IFN-γ+ cells was lower (p ≤ 0.001) among dLN NK cells from AO rats when compared with DA ones (Fig. 3A). With aging, it decreased (p ≤ 0.001) in DA rats, while it remained unaltered in AO rats (Fig. 3A). Consequently, in aged rats, the frequency of IFN-γ+ cells was comparable among NK cells from dLNs of AO and DA rats (Fig. 3A). The number of IFN-γ+ NK cells was greater (p ≤ 0.001) in young DA rats than in their AO counterparts (Fig. 3A). With aging, their number raised (p ≤ 0.001) in AO rats, whereas it decreased in DA rats, but the reduction did not reach statistical significance (Fig. 3A). The number of dLN IFN-γ+ NK cells did not statistically significantly differ between aged AO and DA rats (Fig. 3A).
Fig. 3
IFN-γ- and IL-10-producing cells among NK cells from EAE rat dLNs on the 7th d.p.i. Representative flow cytometry contour plots indicate (A) IFN-γ and (B) IL-10 expression in NK cells from dLNs of (left) young and (right) aged (upper) DA and (lower) AO rats immunized for EAE (NK cells were gated as shown in dot plot flow cytometry profiles in Figure 2A). Intracellular cytokine expression was determined following 4-hour-long in vitro stimulation of mononuclear cells with PMA and ionomycin in the presence of brefeldin A (Material and Methods). Bar graphs show (A) the percentage of IFN-γ+ cells among NK cells and number of IFN-γ+ NK cells, and (B) the percentage of IL-10+ cells among NK cells from dLNs of young and aged DA and AO rats immunized for EAE. Results are from one of three independent experiments. Data are presented as means ±SEM (n = 6). *** p ≤ 0.001. Two-way ANOVA (strain × age) showed significant interaction between the factors for IFN-γ+ cell frequency (F1,20 = 342.1, p ≤ 0.001) and IFN-γ+ NK cell number (F1,20 = 134.1, p ≤ 0.001)
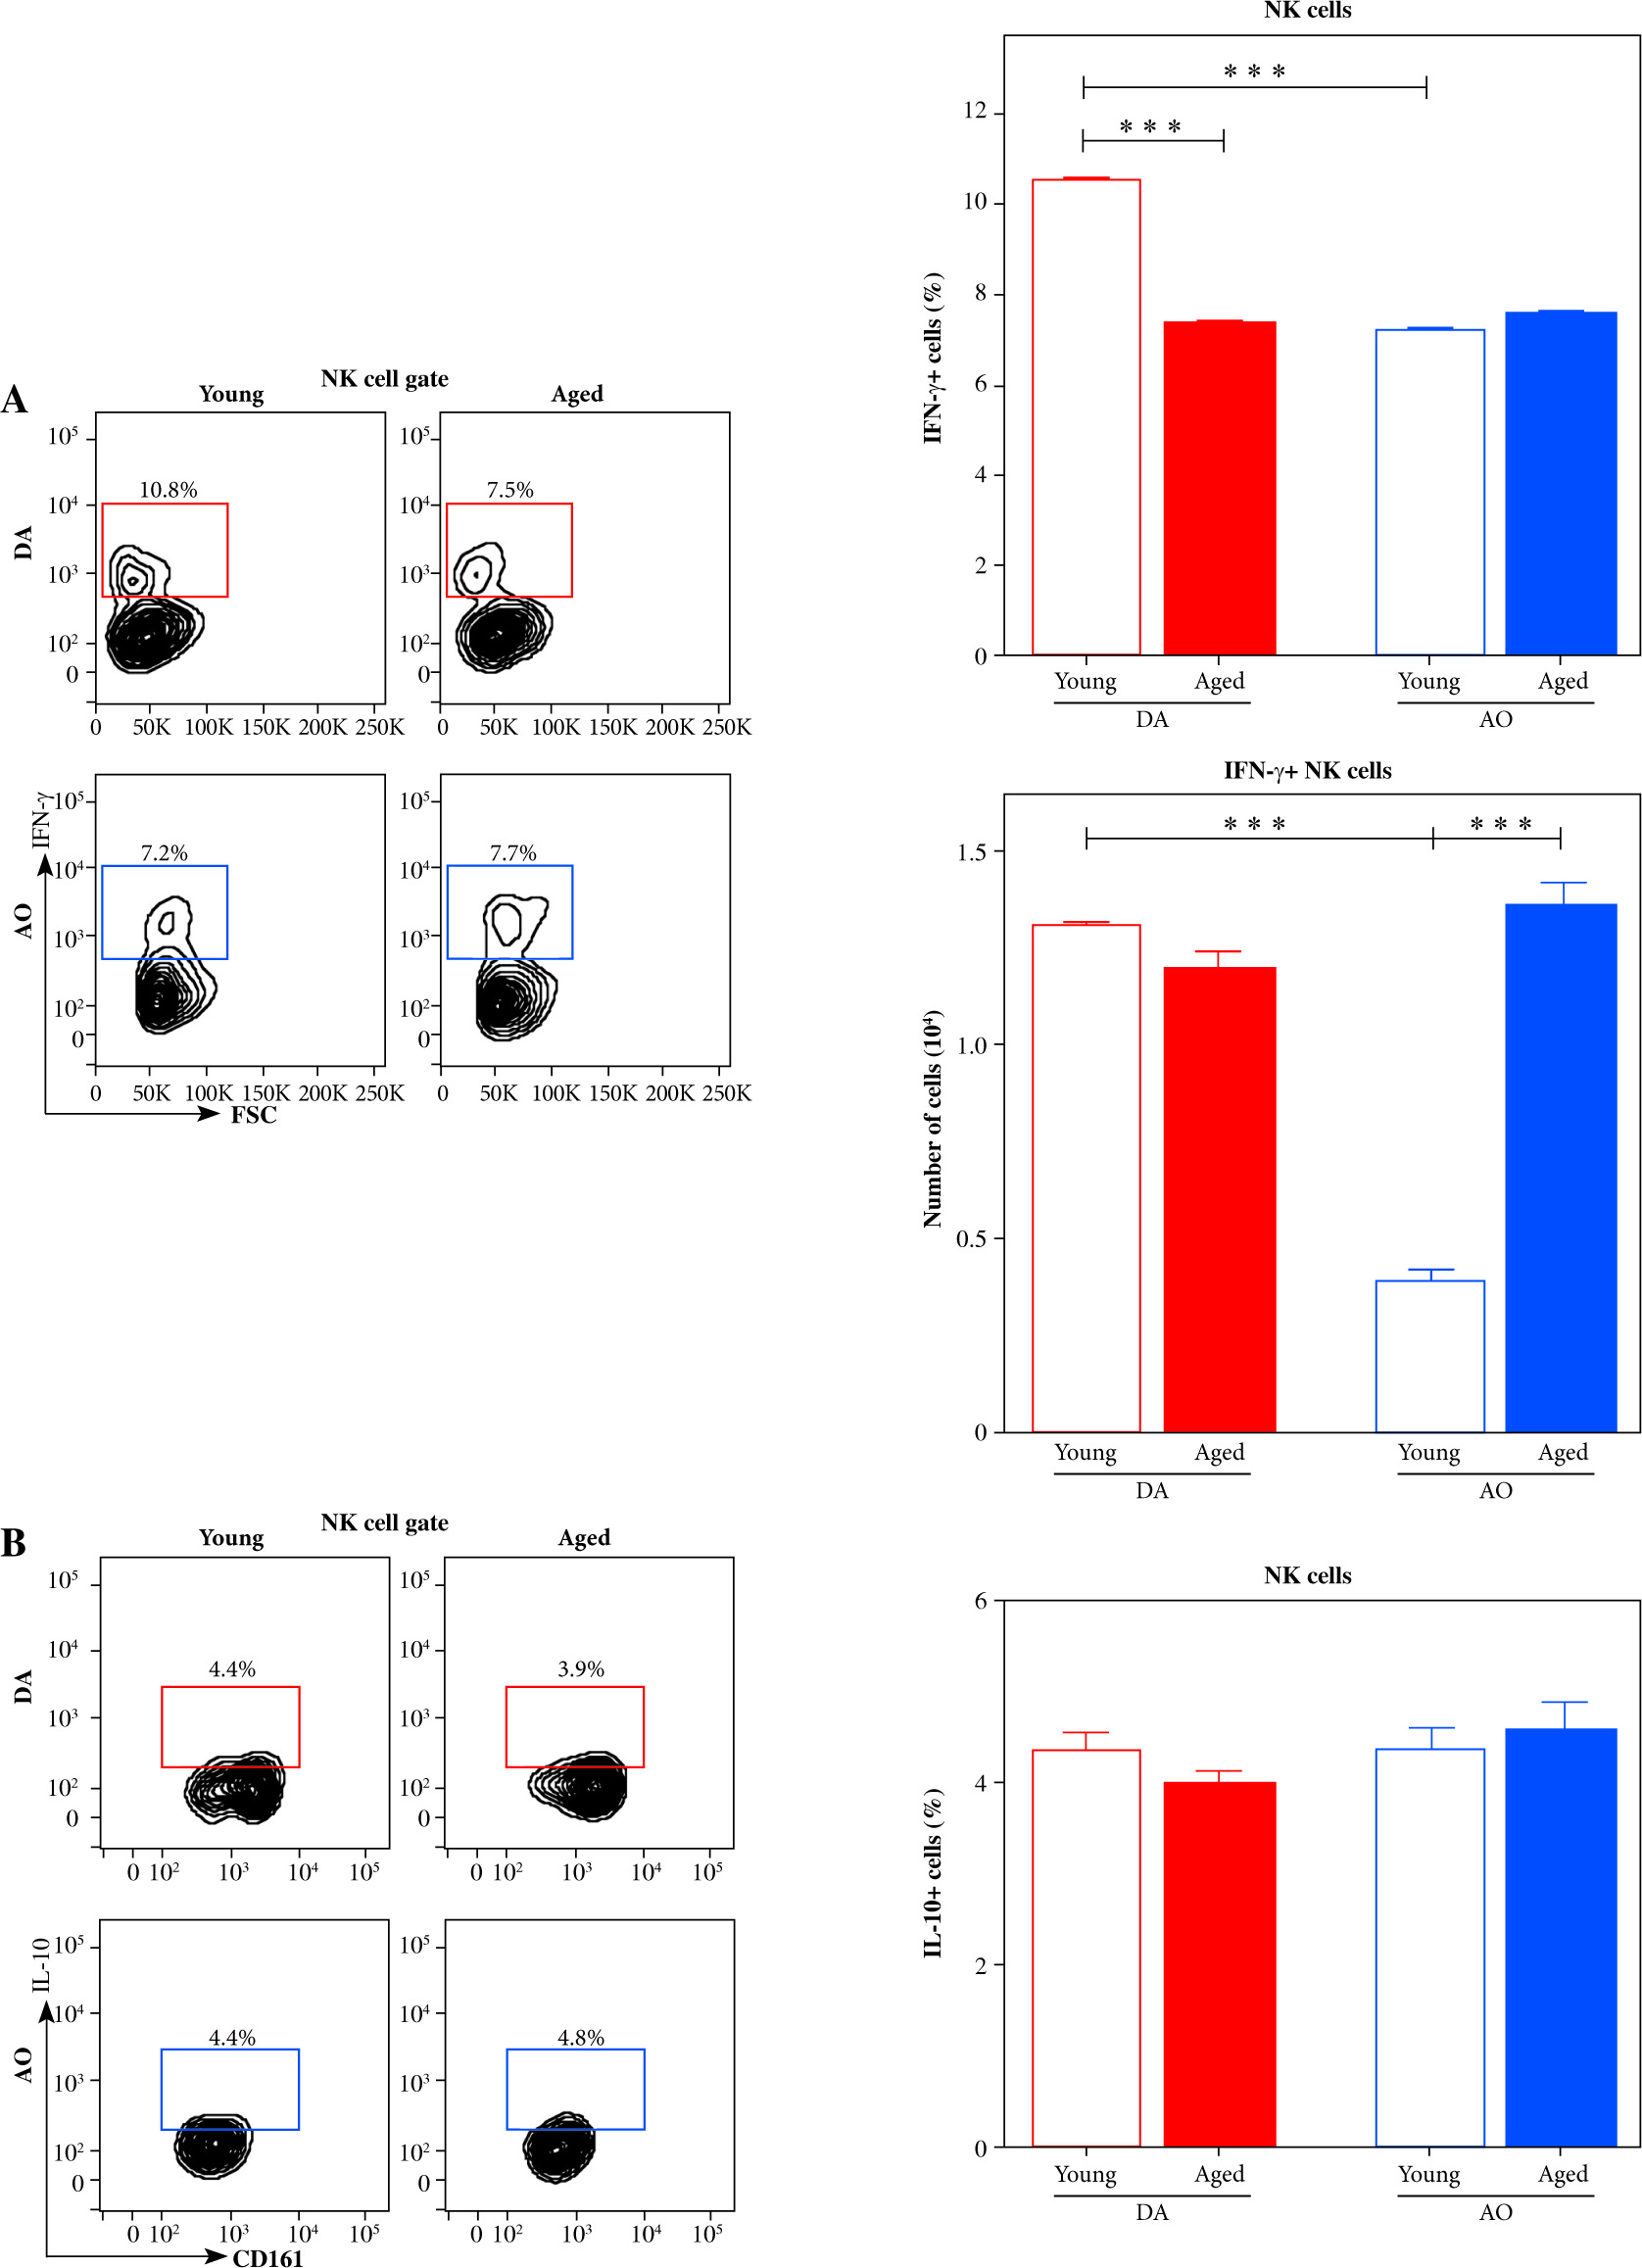
Given that depending on duration of stimulation in vitro and strength of antigen stimulation in vivo, NK cells are shown to begin to produce IL-10, which then in turn, regulate DC activation [37-39], the proportion of IL-10-producing (IL-10+) cells among NK cells was also investigated. We found that, irrespective of rat age and strain, their frequency among NK cells was significantly lower than the frequency of IFN-γ+ cells (Fig. 3B). Additionally, their proportion was similar across all examined groups of rats (Fig. 3B). Therefore, it may be assumed that IL-10+ NK cells did not contribute to putative strain- and age-dependent differences in DC activation/maturation and CD4+ lymphocyte activation.
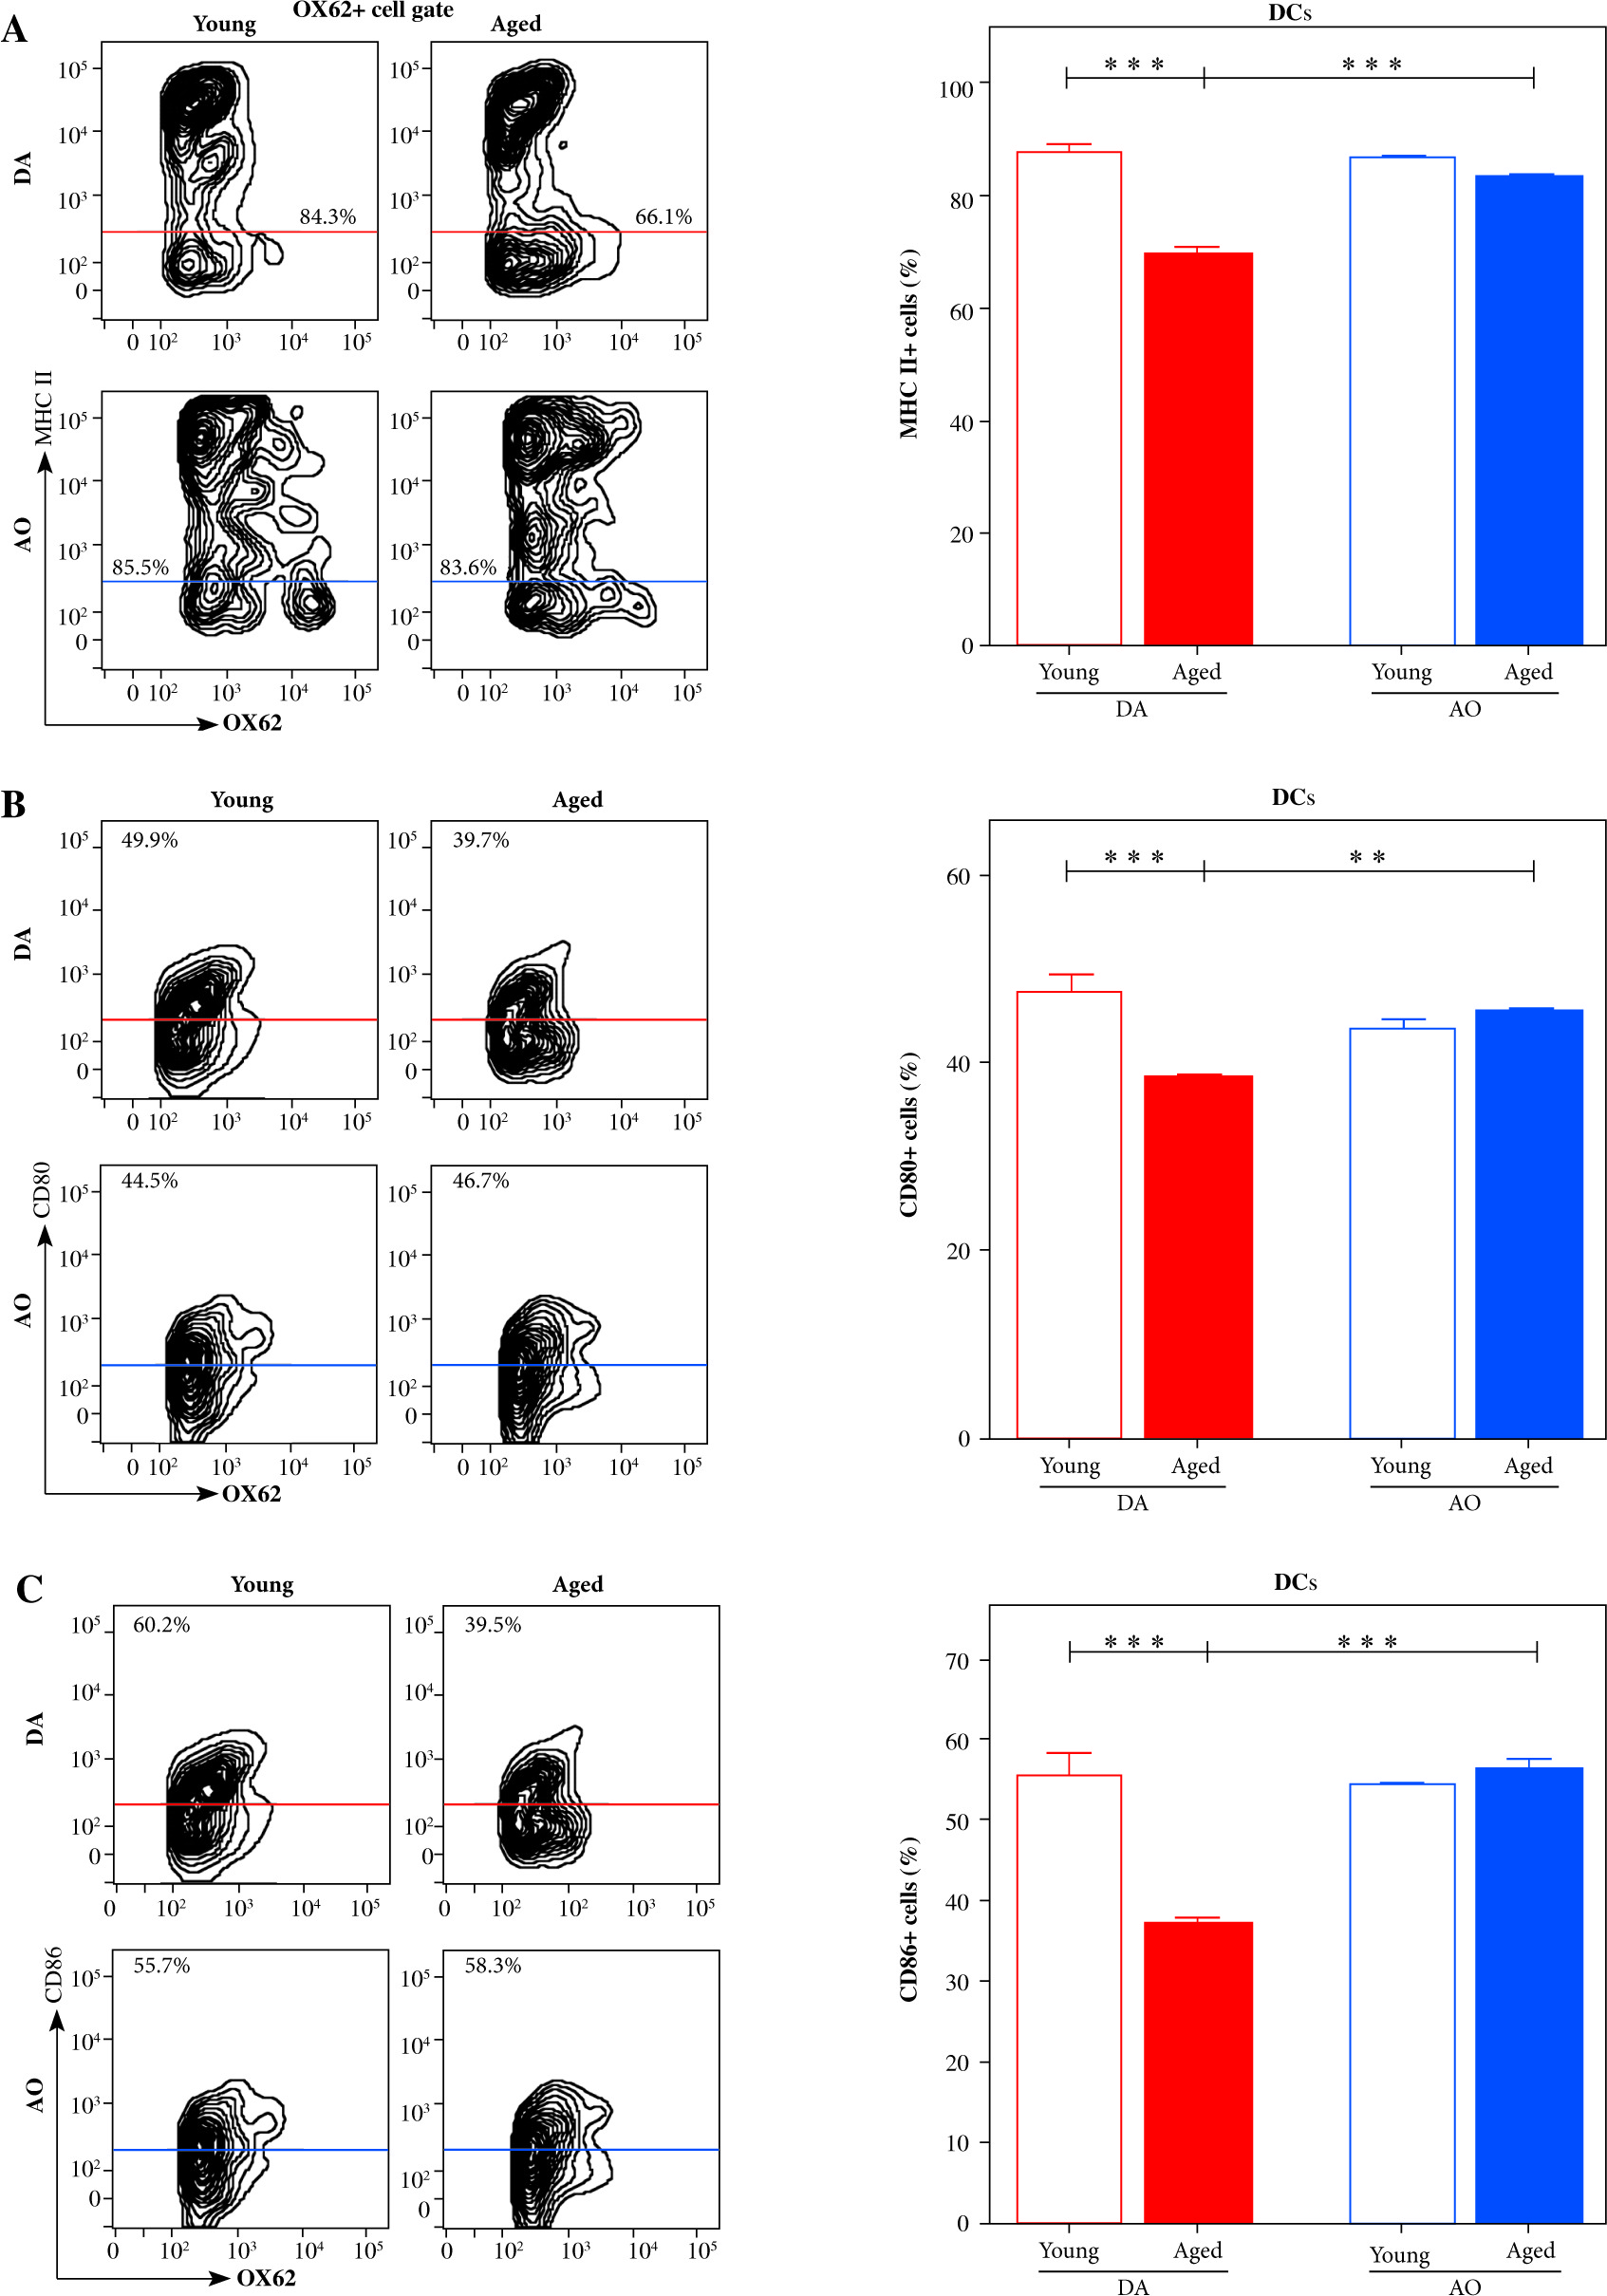
To assess significance of strain- and age-specific differences in dLN DC/NK cell ratio and, in particular, the number of IFN-γ+ cells for DC activation/maturation, DCs were examined for the expression of MHC class II molecules and co-stimulatory molecules (CD80, CD86) as activated/maturing DCs upregulate their expression to become potent antigen-presenting cells [40]. The frequency of cells expressing MHC II as well as CD80 and CD86 co-stimulatory molecules was comparable among dLN DCs from young DA and AO rats (Fig. 4). With aging, their frequencies decreased (p ≤ 0.001) among DCs from dLNs of DA rats, but remained stable among DCs from dLNs of AO rats (Fig. 4). Consequently, in aged rats, the frequencies of MHC II+ (p ≤ 0.001), CD80+ (p ≤ 0.01), and CD86+ (p ≤ 0.001) cells were higher among DCs from AO rats, when compared with age-matched DA rats (Fig. 4).
Fig. 4
DC activation/maturation in EAE rat dLNs on the 7th d.p.i. Representative flow cytometry contour plots indicate expression of (A) MHC II, (B) CD80 and (C) CD86 on the surface of NK cells from dLNs of (left) young and (right) aged (upper) DA and (lower) AO rats immunized for EAE. Bar graph shows the percentage of (A) MHC II+ cells, (B) CD80+ cells, and (C) CD86+ cells among DCs from dLNs of young and aged DA and AO rats immunized for EAE (OX62+ cells were gated as shown in dot plot flow cytometry profile in Figure 2C). Results are from one of three independent experiments. Data are presented as means ±SEM (n = 6). ** p ≤ 0.01; *** p ≤ 0.001. Two-way ANOVA (strain × age) showed significant interaction between the factors for (A) MHC II+ (F1,20 = 35.30, p ≤ 0.001), (B) CD80+ (F1,20 = 17.21, p ≤ 0.001), and (C) CD86+ (F1,20 = 33.45, p ≤ 0.001) cell frequencies
Given that the ratio between activated/matured antigen-carrying DCs and their conventional/effector CD4+ T lymphocyte partners determines the outcome of their encounter [41], dLN cells recovered on the 7th d.p.i. were also examined for the number of activated/matured DCs and Foxp3-, presumably conventional CD4+ T cells using flow cytometry, and activated/matured DC/Foxp3-CD4+ cell ratio was calculated (Fig. 5). The numbers of CD80+ DCs (p ≤ 0.001) and Foxp3-CD4+ T cells (p ≤ 0.05) were greater in dLNs from young DA rats than in age-matched AO rats. In DA rats, with aging, the number of CD80+ DCs decreased, but this decrease did not reach statistical significance. The number of Foxp3-CD4+ T cells in dLNs from DA rats did not change with aging (Figs. 5A and B). On the other hand, in aged AO rats, the numbers of CD80+ DCs (p ≤ 0.001) and Foxp3-CD4+ T cells (p ≤ 0.01) were greater than in strain-matched young rats (Figs. 5A and B). Consequently, their numbers were comparable in dLNs from aged DA and AO rats (Figs. 5A and B).
Fig. 5
CD80+ DC and Foxp3-CD4+ cell numbers, activated/matured DC/Foxp3-CD4+ cell ratio, and CD25+- Foxp3-CD4+ cell number in EAE rat dLNs on the 7th d.p.i. (A) Bar graph indicates the number of CD80+ DCs in dLNs from young and aged DA and AO rats immunized for EAE as determined using flow cytometry analysis (shown in Fig. 4). (B) Bar graph shows the number of Foxp3-CD4+ cells. It was calculated based on the frequency of conventional Foxp3-CD4+ lymphocytes determined using flow cytometry analysis. Gating strategy for Foxp3-CD4+ cells was shown in the representative dot plot profile (live mononuclear cells [MNC] were gated as shown in Figure 2A). (C) Bar graph shows activated/matured CD80+ DC/Foxp3-CD4+ cell ratio in dLNs of young and aged DA and AO rats immunized for EAE. (D) Bar graph shows the number of CD25+Foxp3-CD4+ cells in dLNs of young and aged DA and AO rats immunized for EAE as determined using flow cytometry. Gating strategy for CD25+Foxp3-CD4+ cells was shown in the representative dot plot profile (CD25 expression was examined on Foxp3-CD4+ cells gated as shown in dot plot flow cytometry profile in B). Data are presented as means ±SEM (n = 6). * p ≤ 0.05; ** p ≤ 0.01; *** p ≤ 0.001. Two-way ANOVA (strain × age) showed significant interaction between the factors for (A) CD80+ DCs number (F1,20 = 28.37, p ≤ 0.001), (B) Foxp3-CD4+ cell number (F1,20 = 8.55, p ≤ 0.01), (C) CD80+ DC/Foxp3-CD4+ cell ratio (F1,20 = 95, p ≤ 0.001), (D) CD25+Foxp3-CD4+ cell number (F1,20 = 465.9, p ≤ 0.001)

In young rats, activated/matured DC/Foxp3-CD4+ cell ratio was shifted (p ≤ 0.001) toward activated/matured DCs in DA compared with AO rats (Fig. 5C). With aging, contrary to DA rats, in AO rats this ratio raised (p ≤ 0.001) becoming more favorable for the CD4+ cell response (Fig. 5C). Therefore, in aged AO rats, it shifted (p ≤ 0.05) towards CD80+ DCs when compared with age-matched DA rats (Fig. 5C). The similar pattern of strain- and age-specific differences exhibited CD86+ DC/Foxp3-CD4+ and MHC II+ DC/Foxp3- CD4+ cell ratios in dLNs (data not shown).
Influence of aging on the number of activated CD4+ T cells in dLNs of AO and DA rats immunized for EAE and on their proliferation in vitro
The number of CD25+Foxp3-CD4+ cells, presumably activated conventional/effector CD4+ lymphocytes, was determined in dLNs using flow cytometry (Fig. 5D). In young rats, their number was higher (p ≤ 0.001) in dLNs from DA rats compared with AO rats (Fig. 5D). With aging, the number of CD25+Foxp3-CD4+ cells changed in opposite direction in DA and AO rats. The number of CD25+Foxp3-CD4+ cells diminished (p ≤ 0.001) in DA rats, but increased (p ≤ 0.01) in AO rats (Fig. 5D). In aged rats, their number was greater (p ≤ 0.001) in AO rats compared with DA ones (Fig. 5D).
Additionally, in cultures of dLN cells recovered on the 7th d.p.i. proliferation of CD4+ lymphocytes in response to stimulation with MBP and ConA was examined using flow cytometry (Fig. 6A). It should be pointed out that across all dLN cell cultures, the frequency of proliferating cells increased (p ≤ 0.01) in the presence of MBP, when compared with basal proliferation (proliferation in culture medium alone) (Fig. 6B). The frequency of proliferating cells (cells in S+G2/M phases of cell cycle) among CD4+ lymphocytes was lower (p ≤ 0.001) in dLN cell cultures from young AO rats compared with those from age-matched DA rats (Fig. 6B). Aging differently affected ability of CD4+ T lymphocytes from rats immunized for EAE to proliferate in response to MBP in dLN cell cultures. Specifically, it diminished (p ≤ 0.001) proliferative capacity of CD4+ T lymphocytes from DA rats, but did not significantly affect that of CD4+ T lymphocytes from AO rats (Fig. 6B). Therefore, the frequency of proliferating cells was lower (p ≤ 0.001) in dLN cell cultures from aged AO compared with age-matched DA rats. The analysis of the percentage increase in MBP-stimulated CD4+ lymphocyte proliferation over their basal proliferation revealed that the percentage increase was greater (p ≤ 0.001) in dLN cell cultures from young DA rats compared with age-matched AO rats (Fig. 6B). This percentage increase was also greater (p ≤ 0.001) in dLN cell cultures from aged DA rats compared with young DA rats, but did not statistically significantly differ between dLN cell cultures from young and aged AO rats (Fig. 6B). Consequently, the percentage increase in CD4+ lymphocyte proliferation was greater (p ≤ 0.001) in MBP-stimulated dLN cell cultures from aged DA rats compared with age-matched AO rats (Fig. 6B).
Fig. 6
The frequency of proliferating cells among CD4+ lymphocytes from EAE rat dLNs. (A) Flow cytometry histogram indicates the gating strategy for cells in S+G2/M phases of the cell cycle, as determined by 7-AAD DNA staining (Material and Methods), within CD4+ lymphocytes (gated as shown in right flow cytometry dot plot) following (left flow cytometry dot plot) elimination of cellular debris and doublets using pulse processing. (B, C) Bar graphs show the frequency of proliferating cells (cells in S+G2/M phases of cell cycle) among CD4+ lymphocytes in (B, C) Basal (without any cognate stimulator) and (B) MBP- and (C) ConA-stimulated dLN cell cultures from young and aged DA and AO rats immunized for EAE. (B, C insert) Bar graphs show the percentage increase in (B) MBP- and (C) ConA-stimulated CD4+ lymphocyte proliferation over their basal proliferation in dLN cell cultures from age- and strain-matched rats immunized for EAE. Results are from one of three independent experiments. Data are presented as means ±SEM (n = 6). * p ≤ 0.05, ** p ≤ 0.01, *** p ≤ 0.001, ++ p ≤ 0.01, +++ p ≤ 0.001 + vs. basal proliferation in dLN cell cultures from age- and strainmatched rats. Two-way ANOVA (strain × age) showed significant interaction between the factors for (B) the frequency of proliferating cells among CD4+ cells from MBP-stimulated cultures (F1,20 = 173.1, p ≤ 0.001) and the percentage increase in proliferation (F1,20 = 18.39, p ≤ 0.001) and (C) the frequency of proliferating cells among CD4+ cells from ConA-stimulated cultures (F1,20= 17.78, p ≤ 0.001) and the percentage increase in proliferation (F1,20 = 27.39, p ≤ 0.001)
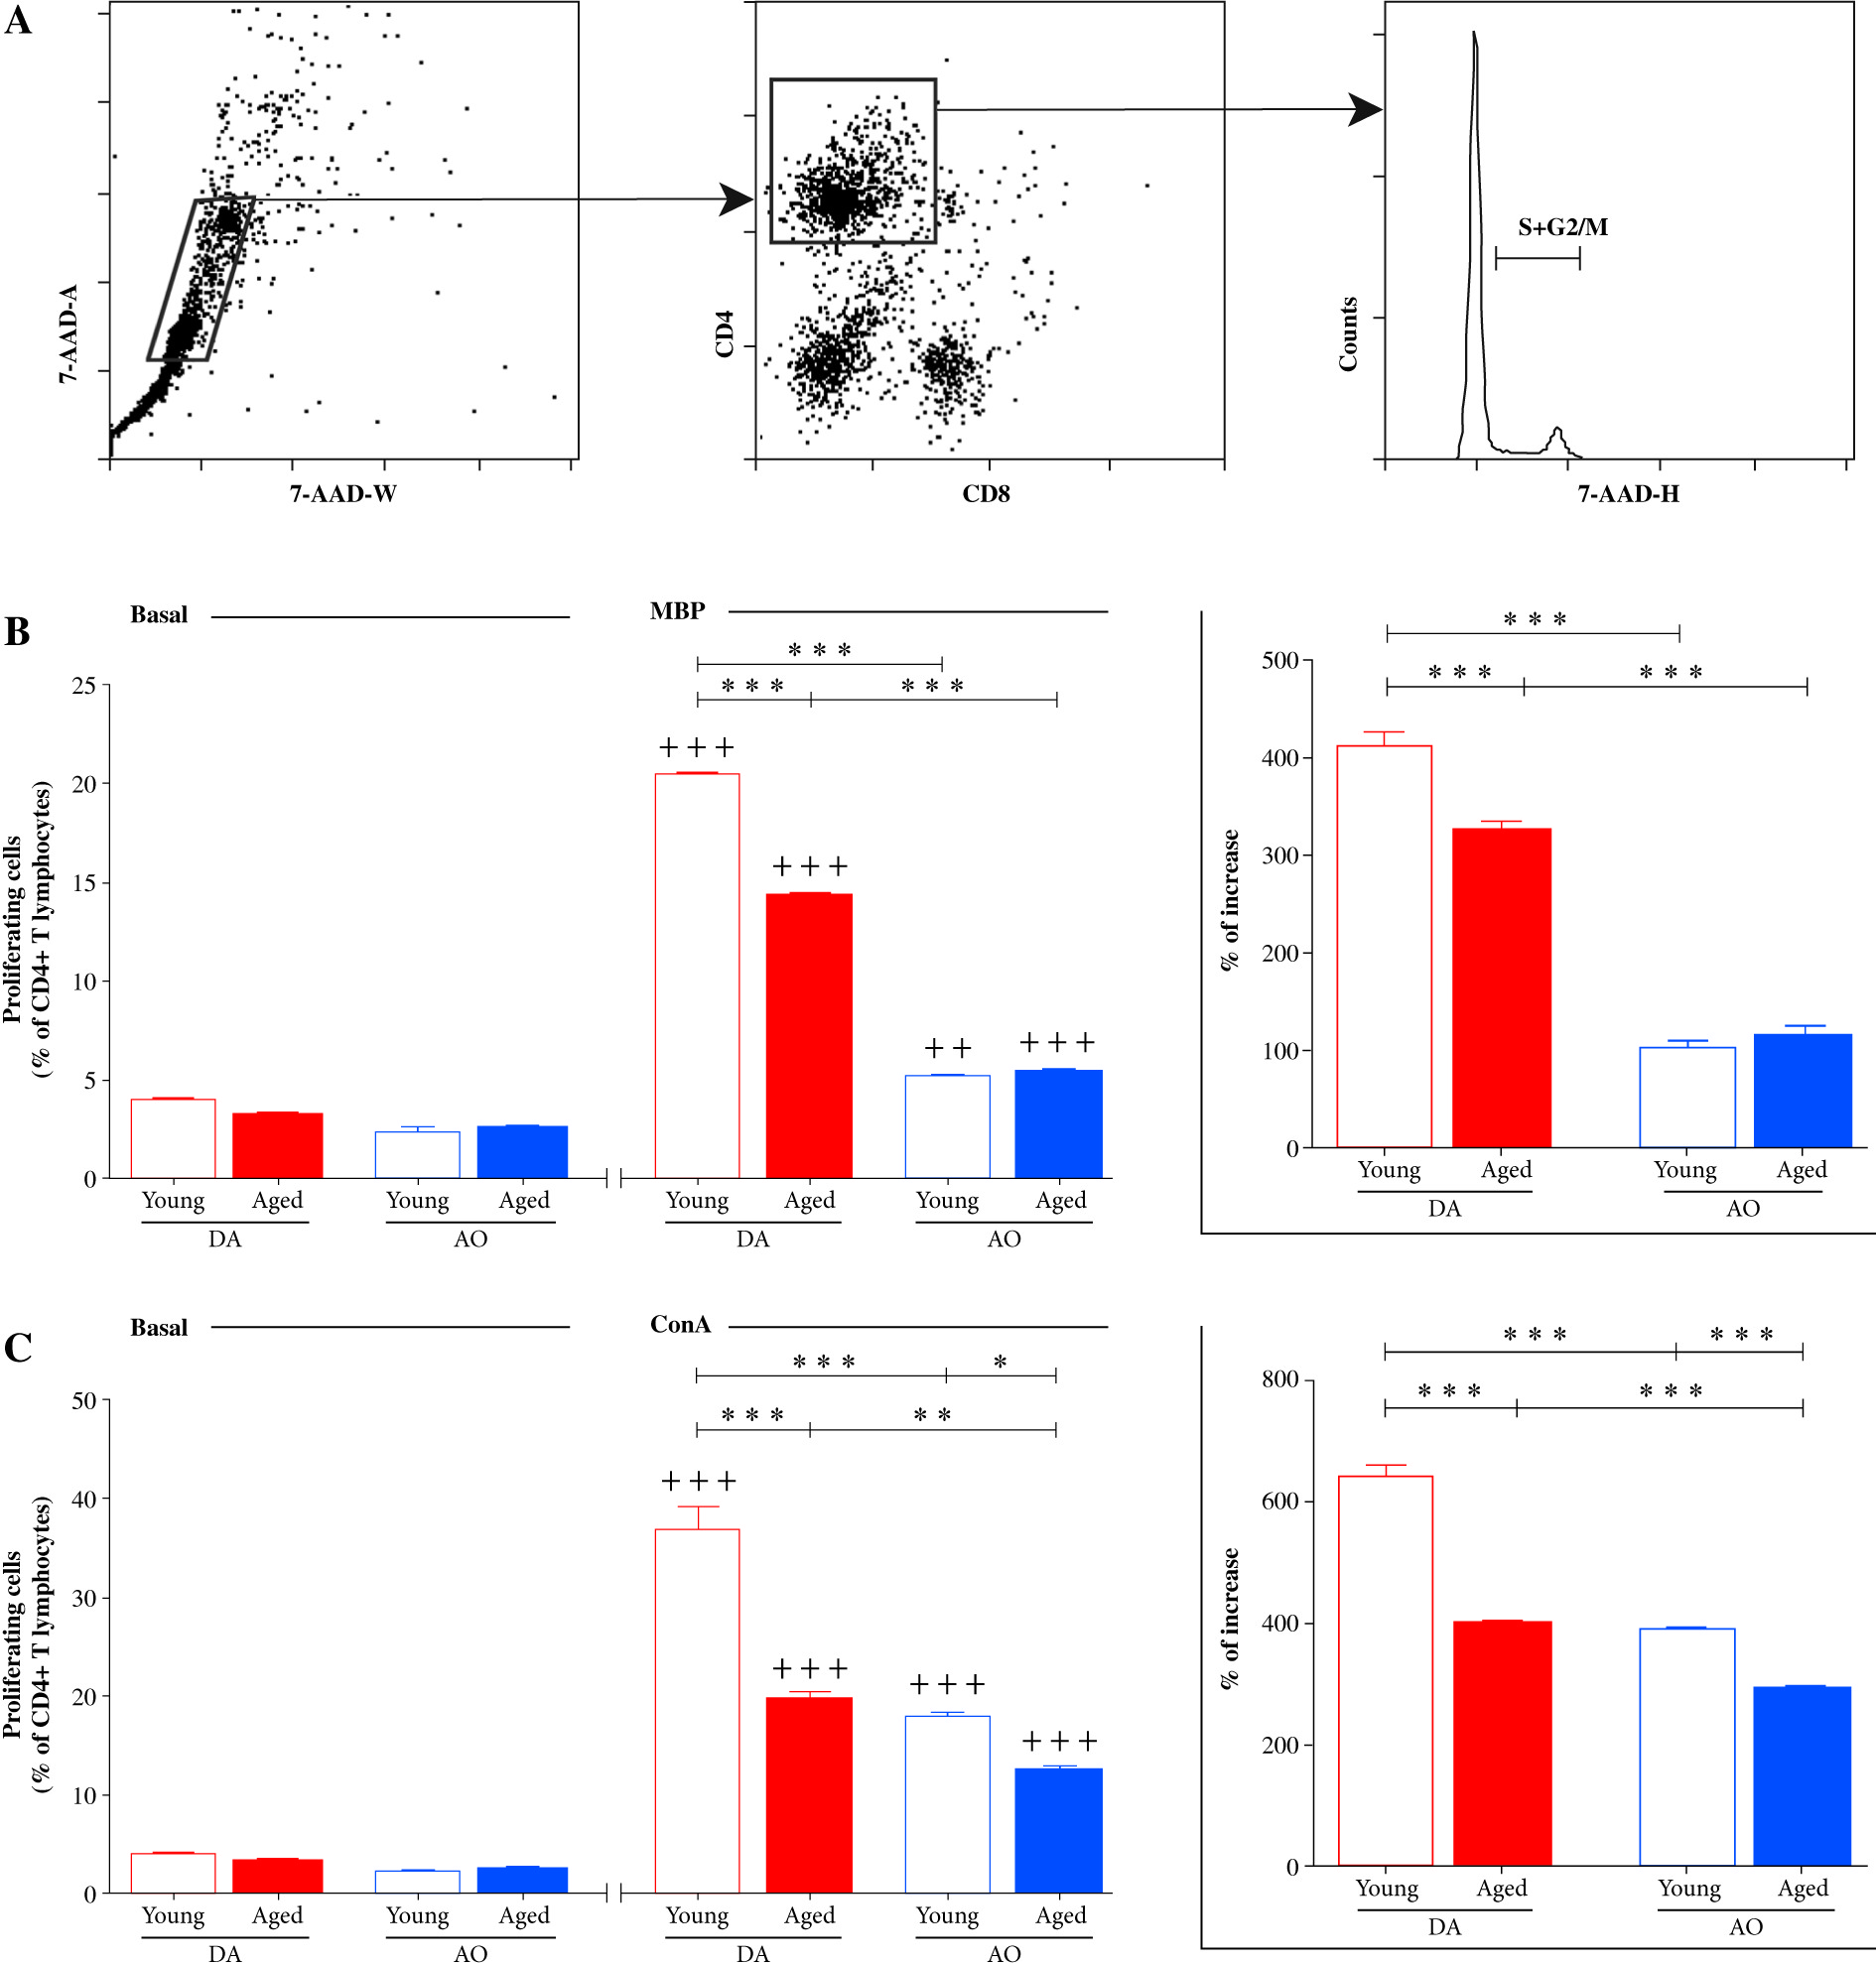
Next, the proliferation of CD4+ lymphocytes in ConA-stimulated cultures of dLN cells recovered on the 7th d.p.i. was explored. In all dLN cell cultures, ConA stimulated (p ≤ 0.001) CD4+ lymphocyte proliferation (Fig. 6C). Irrespective of age, the frequency of proliferating cells was lower (p ≤ 0.001 and p ≤ 0.01 in young and aged rat dLN cell cultures, respectively) in dLN cell cultures from AO rats compared with DA rats (Fig. 6C). In dLN cell cultures from aged DA (p ≤ 0.001) and AO (p ≤ 0.05) rats was lower than in the corresponding cultures from strain-matched young rats (Fig. 6C). The analysis of the percentage increase in ConA-stimulated CD4+ lymphocyte proliferation over their basal proliferation revealed greater (p ≤ 0.001) increase in dLN cell cultures from young DA rats compared with age-matched AO rats (Fig. 6C). The percentage increase in ConA-stimulated CD4+ lymphocyte proliferation was less (p ≤ 0.001) in dLN cell cultures from aged DA and AO rats, when compared with the corresponding cultures from strain-matched young rats, and it remained less (p ≤ 0.001) in dLN cell cultures from aged AO compared with DA rats (Fig. 6C).
Considering that CD4+CD25+Foxp3+ T regulatory cells (Tregs) are shown to influence DC stimulatory capacity and therefore the outcome of DC/CD4+ lymphocyte interaction [42], dLNs were examined for the expression of Treg markers using flow cytometry (Fig. 7A). The frequency of Tregs was comparable in dLNs from young DA and AO rats (Fig. 7A). With aging, it increased (p ≤ 0.01) in dLNs from AO rats, whereas it did not change in those from DA rats (Fig. 7A). Thus, in aged rats the frequency of Tregs was higher (p ≤ 0.01) in dLNs from AO rats compared with their DA counterparts (Fig. 7A).
Fig. 7
The frequency of CD25+Foxp3+CD4+ cells and IL-10-producing cells among them in EAE rat dLNs. (A) Bar graph shows the frequency of CD25+Foxp3+CD4+ T regulatory cells (Tregs) in dLNs of young and aged DA and AO rats immunized for EAE. Their frequency was determined using flow cytometry. Gating strategy for CD25+Foxp3+CD4+ Tregs within live mononuclear cells (MNC) was shown in the representative dot plot profiles. (B) Representative flow cytometry contour plots indicate IL-10 expression in Tregs from dLNs of (left) young and (right) aged (upper) DA, and (lower) AO rats immunized for EAE. Intracellular cytokine expression was determined following 4-hour-long in vitro stimulation of mononuclear cells with PMA and ionomycin in the presence of brefeldin A (Material and methods). Bar graph shows the percentage of IL-10+ cells among Tregs from dLNs of young and aged DA and AO rats immunized for EAE. Results are from one of three independent experiments. Data are presented as means ± SEM (n = 6). * p ≤ 0.05, ** p ≤ 0.01. Two-way ANOVA (strain × age) showed significant interaction between the factors for (A) CD25+Foxp3+ CD4+ Treg (F1,20= 15.43, p ≤ 0.001) and (B) IL-10+ (F1,20 = 5.058, p ≤ 0.05) cell frequencies
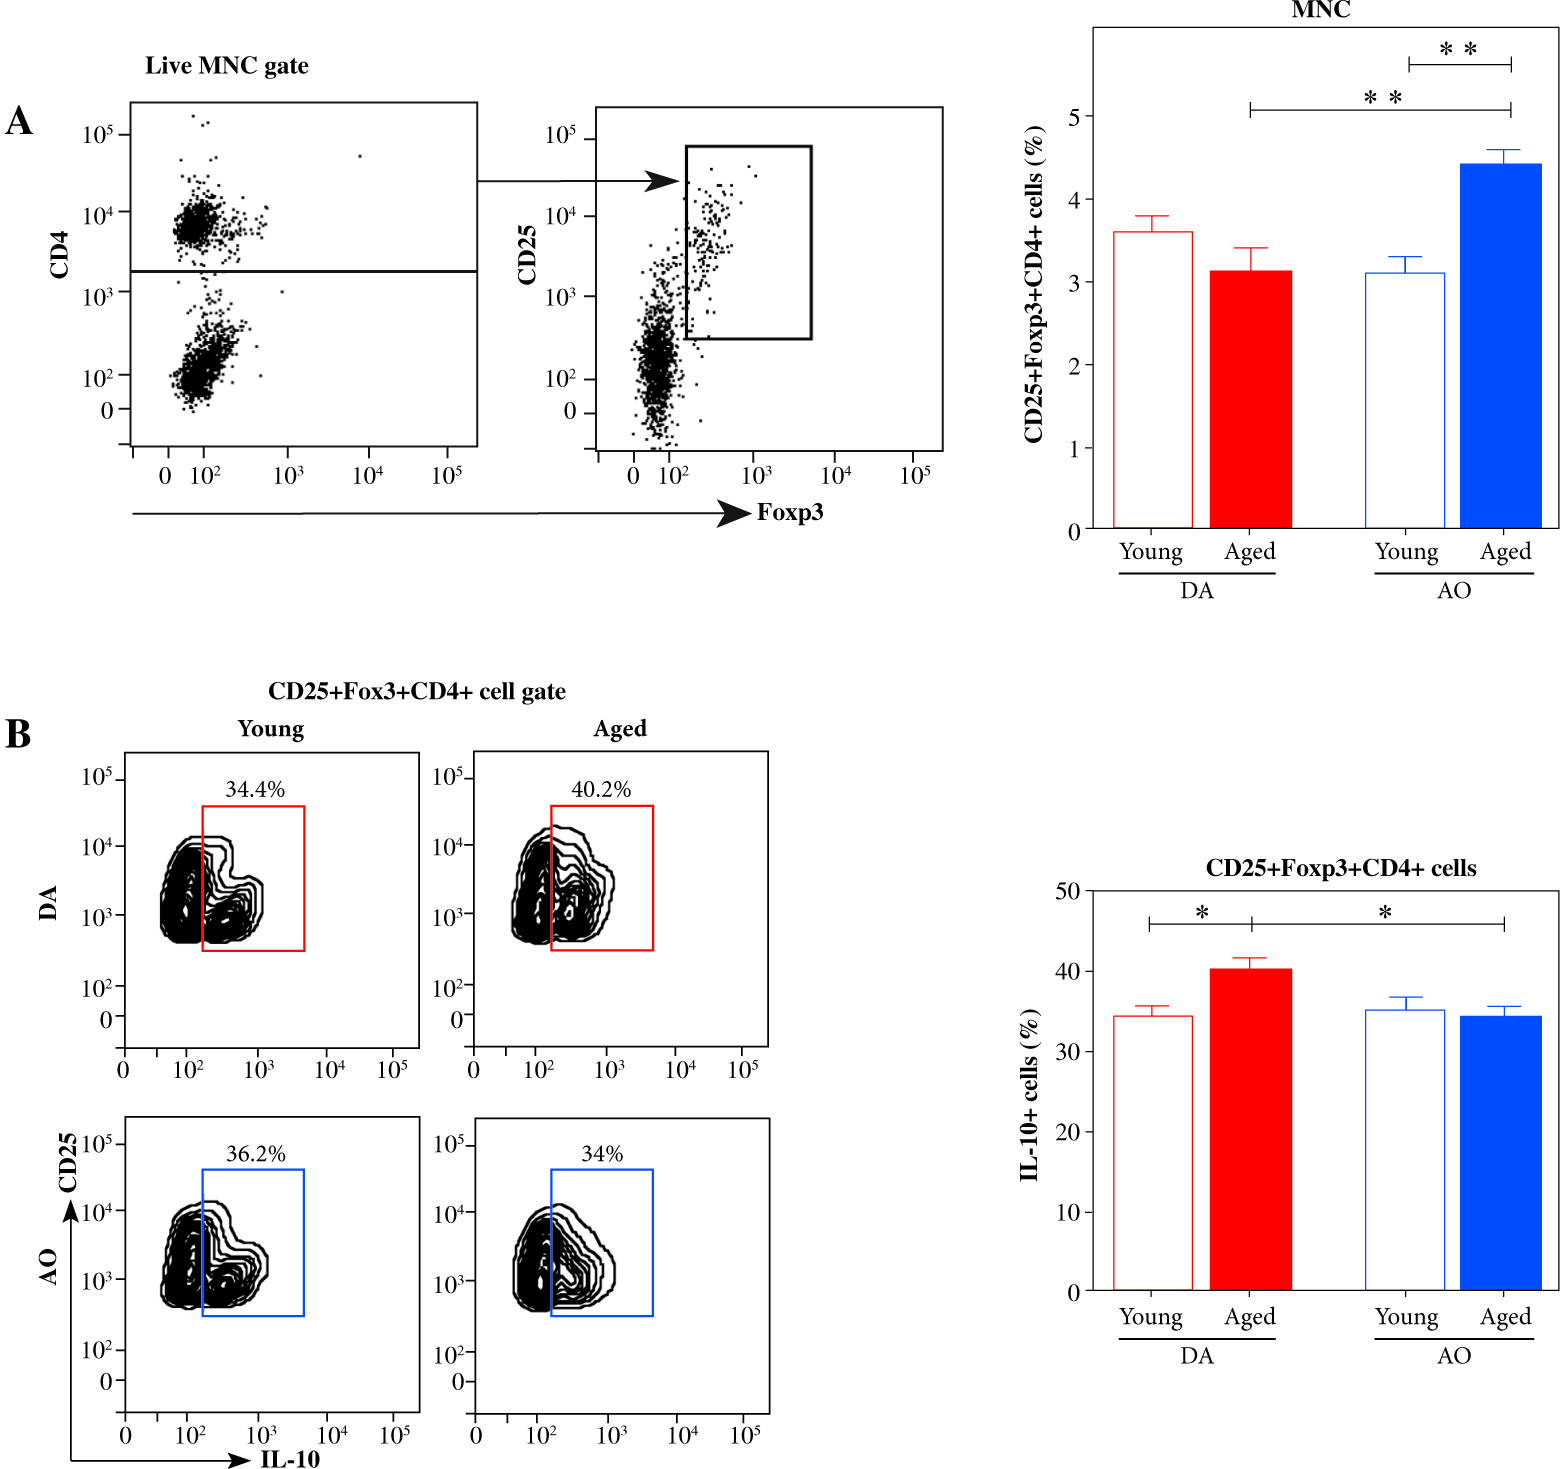
Next, considering data indicating that with aging, depending on mouse strain, Treg capacity to suppress CD4+ T cell proliferation either does not change [43, 44] or increases reflecting age-related increase in their capacity to produce IL-10 [45], we examined the frequency of IL-10-producing cells among Tregs. We found similar frequency of IL-10+ cells among Tregs in young DA and AO rats (Fig. 7B). With aging, their frequency increased (p ≤ 0.05) in DA rats, but remained stable in AO rats. Therefore, the frequency of IL-10+ cells was lower (p ≤ 0.05) among Tregs from aged AO rats compared with age-matched DA rats (Fig. 7B).
Age- and strain-specific differences in the numbers of NK cells retrieved from SC of DA and AO rats immunized for EAE in effector phase of the disease and their CX3CR1 expression
Given that NK cells are shown to influence EAE development acting also at SC level [18, 19], the infiltration of SC with NK cells was examined using flow cytometry (Fig. 8A). In the effector phase of the disease (at the peak of neurological deficit), fewer (p ≤ 0.001) NK cells were recovered from SC of young AO compared with age-matched DA rats (Fig. 8A). Additionally, at the same point of EAE development, lower (p ≤ 0.001) number of NK cells was isolated from SC of aged DA rats compared with their young counterparts (Fig. 8A). On the contrary, more (p ≤ 0.05) NK cells were recovered from SC of aged AO rats compared with young ones (Fig. 8A). However, despite opposing effects of aging on the number of NK cells infiltrating SC of DA and AO rats, fewer (p ≤ 0.001) NK cells was recovered from SC of aged AO compared with age-matched DA rats (Fig. 8A).
Fig. 8
NK cell number and phenotypic characteristics, and Foxp3-CD4+/CX3CR1+ NK cell ratio in EAE rat SC. Mononuclear SC cells recovered in the effector phase of EAE were examined for NK cell number, CX3CR1 and granzyme B expression, and Foxp3-CD4+/CX3CR1+ NK cell ratio. (A) Bar graph shows the number of CD161+CD8+TCRαβ- NK cells in SC of young and aged DA and AO rats immunized for EAE. The number of CD161+CD8+TCRαβ- NK cells was determined using flow cytometry analysis. Gating strategy for NK cells was shown in the representative dot plot profiles (CD161+ cells were examined within gated CD8+TCRαβ- lymphocytes, following live cell gating and elimination of cellular debris). (B, C) Representative flow cytometry contour plots indicate expression of (B) CX3CR1 and (C) granzyme B on and in NK cells from SCs of (left) young and (right) aged (upper) DA, and (lower) AO rats immunized for EAE, respectively. (B, C) Bar graphs indicate (B) the frequency of CX3CR1+ cells among NK cells and number of CX3CR1+ NK cells and (C) the frequency of granzyme B+ cells among NK cells in SCs from young and aged DA and AO rats immunized for EAE, as determined using flow cytometry analysis. (D) Bar graphs show Foxp3-CD4+ cell number and Foxp3-CD4+/CX3CR1+ NK cell ratio in SCs of young and aged DA and AO rats immunized for EAE. Gating strategy for Foxp3-CD4+ was shown in the representative dot plot profile (live mononuclear cells [MNC] were gated as shown in dot plot flow cytometry profile in A). Results are from one of three independent experiments. Data are presented as means ±SEM (n = 6). * p ≤ 0.05, *** p ≤ 0.001. Two-way ANOVA (strain × age) showed significant interaction between the factors for (A) NK cell number (F1,20 = 132.6, p ≤ 0.001), (B) the frequency of CX3CR1+ cells (F1,20 = 74.54, p ≤ 0.001) and CX3CR1+ NK cell number (F1,20=108, p ≤ 0.001), (D) Foxp3-CD4+/CX3CR1+ NK cell ratio (F1,20 = 123.7, p ≤ 0.001)

Since it has been suggested that: 1) CX3CR1 mediates NK cell migration to the CNS [19], and 2) CX3CR1-deficient mice are more susceptible to EAE than wild-type mice [18, 19], NK cells from SC of EAE rats were examined for the expression of CX3CR1. The frequency of CX3CR1+ cells among NK cells and their number were lower (p ≤ 0.001) in SC of young AO rats compared with their DA counterparts (Fig. 8B). Aging increased (p ≤ 0.001) the frequency of CX3CR1+ cells among NK cells infiltrating SC of both AO and DA rats (Fig. 8B). Given that the number of NK cells infiltrating SC changes in the opposite direction in DA and AO rats with age, lower (p ≤ 0.001) and comparable CX3CR1+ NK cell number in SC of aged DA rats and AO rats compared with strain-matched young rats was found, respectively (Fig. 8B). However, in aged rats, the frequency of CX3CR1+ cells among NK cells and their number were lower (p ≤ 0.001) in SC of AO compared with DA rats (Fig. 8B).
Considering that CX3CR1+ NK cells, presumably mature NK cells, are suggested to be involved in control of EAE development through their cytotoxic action on encephalitogenic CD4+ T lymphocytes through production of cytolytic enzymes [18], NK cells recovered from SC were also examined for the expression of granzyme B. The frequency of granzyme B+ cells among NK cells infiltrating SC exhibited the same pattern of age- and strain-specific differences to that described for CX3CR1+ cells. Thus, their frequency was lower (p ≤ 0.001) among NK cells from young AO rats when compared with age-matched DA rats (Fig. 8C). Their frequency increased (p ≤ 0.001) with aging in rats of both strains (Fig. 8C). In aged rats, the frequency of granzyme B+ cells was lower (p ≤ 0.001) among NK cells from AO rats compared with DA ones (Fig. 8C).
Finally, considering the proposed mechanism of CX3CR1+ NK cell action [18], SC was examined for the number of conventional Foxp3-CD4+ cells, and Foxp3-CD4+ lymphocyte/CX3CR1+ NK cell ratio in SC was calculated. The number of Foxp3-CD4+ cells was higher (p ≤ 0.001) in SC of young DA rats compared with age-matched AO rats (Fig. 8D). With age, their number decreased (p ≤ 0.001) and increased (p ≤ 0.001) in DA and AO rats, respectively (Fig. 8D). There was no significant difference in the number of Foxp3-CD4+ cells infiltrating SC of aged DA and AO rats (Fig. 8D).
In young rats, conventional Foxp3-CD4+ lymphocyte/CX3CR1+ NK cell ratio was higher (p ≤ 0.001) in AO rats compared with their DA counterparts (Fig. 8D). With aging, Foxp3-CD4+ lymphocyte/CX3CR1+ NK cell ratio diminished (p ≤ 0.05 and p ≤ 0.001 in DA and AO rats, respectively) in rats of both strains (Fig. 8D). However, it remained higher (p ≤ 0.001) in AO than in DA rats suggesting a less efficient NK cell-mediated control of encepahalitogenic CD4+ lymphocytes in AO rats (Fig. 8D).
Discussion
The study revealed strain- and age-related differences in the number and functional capacity of NK cells in dLNs of DA and AO rats immunized for EAE. As expected from previous studies [17, 20, 22], the inoculation of rats of both strains and ages with SC homogenate in CFA increased NK cell migration to dLNs, and consequently the number of all NK cells and the frequency of cells expressing CXCR3 the chemokine receptor that is essential for NK cell recruitment into LNs draining sites of infection or immunization [17], among them. Irrespective of rat strain, this effect of immunization was more prominent in aged rats compared with their young counterparts, and it was particularly pronounced in aged AO rats. These findings are consistent with data indicating that aging affects egress of NK cells from bone marrow and their homing in the peripheral lymphoid tissues following immunization or infection [46, 47]. However, to the best of our knowledge, there are no data on the influence of genetic factors on the efficacy of NK cell migration to inflamed dLNs.
In rats of both strains, similar to the number of NK cells, the number of DCs increased in dLNs with aging, and this effect of aging was also more prominent in dLNs of AO rats. In favor of age-associated increase in the number of DCs in dLNs there are data showing that their number increases in autoimmune-prone (NZWxBXSB)F1 mice facilitating/accelerating progression of autoimmune diseases [48]. This increase was associated with the enhanced production of GM-CSF by activated autoreactive cells [48]. Additionally, peripheral DCs from the elderly showed augmented proliferation after in vitro incubation with GM-CSF, compared with those from young adults [49]. In the light of previous data, the age-related changes in DC numbers at least in dLN of AO rats could be linked with upregulated expression of GM-CSF in CD4+ T lymphocytes recovered from dLNs of aged AO rats on the 7th d.p.i. for EAE when compared with those cells from their young counterparts [50]. To corroborate strain-specific differences in influence of aging on the number of DCs there is data indicating that DC counts in mouse peripheral lymphoid tissues change with immunization, in a strain-specific manner [51]. On the other hand, similar pattern of age- and strain-specific differences in the number of NK cells and DCs could be related to data indicating that DC-NK cell interactions are not a one sided affair, as mature/activated DCs promote the recruitment of NK cells into LNs [17, 20] and, vice versa, the increased number of NK cells in dLNs potentiate DC recruitment to dLNs [22, 52, 53].
Apart from reciprocally modulating each others’ immigration into dLNs, NK cells and DCs activate each other [20, 54]. NK cells are suggested to modulate DC activation/maturation acting through direct cell-to-cell contact at DC/NK cell ratios higher than five [32]. In our study, this ratio across all experimental groups was above this critical number. Given that NK cells influence DC activation/maturation not only through direct cell-to-cell contacts, but also through IFN-γ secretion [21], and that synaptic contact between NK cells and DCs is necessary for IFN-γ production by NK cells [36], we expected that differences in the number of IFN-γ+ NK cells correlated with the number of activated/matured DCs. Indeed, the less number of dLN IFN-γ+ NK cells in young AO rats compared with age-matched DA rats and aged AO rats correlated with the differences in the number of activated/matured DCs in their dLN. On the other hand, in dLNs from DA rats, neither age-related decrease in the number of IFN-γ+ NK cells nor that in the number of activated/matured DCs cells reached statistical significance. To the best of our knowledge, there is no data on the influence of aging on the number of IFN-γ+ NK cells in dLNs following immunization. However, to corroborate previous findings, our earlier studies showed differential effect of aging on the ability of splenic myeloid DCs from AO and DA rats to activate/mature in culture in response to stimulation [55, 56].
Given that ratio between activated/matured antigen-carrying DCs and conventional Foxp3-CD4+ lymphocytes in dLNs rather than solely the number of activated/matured DCs determines the outcome of the DCs and CD4+ T cells encounter [41], this ratio was calculated. Contrary to aged AO rats, in aged DA rats, this ratio was shifted towards Foxp3-CD4+ lymphocytes when compared with strain-matched young rats. Considering that aging diminishes DA rat susceptibility to EAE induction, whereas it has the opposite effect in AO rats, the previous findings seemed to be consistent with hypothesis that NK cells modulating DC activation of autoreactive T cells contribute to development of autoimmune diseases [57]. To test the hypothesis, the number of activated CD25+ Foxp3-CD4+ lymphocytes in dLNs was determined. Indeed, it was lower in aged DA rats compared with strain-matched young DA rats, but higher in aged AO rats than in their young counterparts. However, considering that not all activated CD4+ lymphocytes proliferate [58, 59], their proliferation in dLN cell cultures was also examined. The proliferation of CD4+ T lymphocytes in MBP-stimulated dLN cell cultures from aged DA rats was diminished when compared with corresponding cultures from young rats of the same strain. This most likely reflects not only less favorable activated DC/Foxp3-CD4+ lymphocyte ratio, but also age-related decline in CD4+ lymphocyte proliferative capacity, as shown in dLN cell cultures stimulated with ConA (where their proliferation was not dependent on DCs) and higher frequency of IL-10-producing cells among Tregs [45]. Age-related decrease in intrinsic CD4+ T lymphocyte capacity to proliferate has already been shown in other studies [60]. On the other hand, despite data indicating age-related decline in the proliferative capacity of CD4+ lymphocyte from AO rats (mirrored in the less percentage increase in ConA-stimulated CD4+ lymphocyte proliferation over their basal proliferation in cultures of dLN cells from aged AO rats compared with strain-matched young rats), the frequency of proliferating cells among CD4+ T lymphocytes in MBP-stimulated dLN cell cultures from young and aged AO rats was comparable. This could be linked with more favorable activated DC/Foxp3- CD4+ T lymphocyte ratio in LNs from aged compared with young AO rats. Alternatively, but not mutually exclusive, it may be supposed that accumulation of autoreactive CD4+ T cells, which is shown to occur with aging [61], contributed to the observed phenomenon. To corroborate this option there is data indicating strain differences in the accumulation of autoreactive T cells due to thymus clock [62]. However, given that in accordance with data obtained in some mouse strains [63], the frequency of Tregs in dLNs from aged AO rats was higher when compared with that in young AO rats, while the frequency of IL-10+ cells among them was comparable, it seemed likely that the lack of difference in CD4+ T cell proliferation in dLN cell cultures from young and aged AO rats reflected the net effect of age-related changes in several types of cells being involved in the primary T cell response. Strain specificites in age-related differences in Treg frequency have also been observed in mouse studies [43-45, 63, 64]. On the other hand, the frequency of proliferating CD4+ T lymphocytes in MBP-stimulated dLN cell cultures from aged AO rats was lower than that in the corresponding cultures from aged DA rats. This most likely reflected lower proliferative capacity of CD4+ T lymphocytes from aged AO compared with age-matched DA rats, as shown in the present and our previous study [65], by the analysis of their proliferation in ConA-stimulated cultures. However, the lower proliferation of CD4+ T lymphocytes from aged AO rats compared with age-matched DA rats in MBP-stimulated dLN cell cultures could also be attributed to differences in the overall regulatory Treg capacity reflecting both their frequency and suppressive capacity. It should be pointed out that strain differences in Treg frequency in young mouse dLNs are suggested to contribute to differences in their susceptibility to EAE [66]. Collectively, the previous findings indicated that, differently from DA rats (showing decline in DC stimulatory capacity, CD4+ T lymphocyte proliferative capacity, and possibly increased Treg suppressive capacity with aging), in AO rats, age-related increase in DC stimulatory capacity was abrogated by decline in CD4+ T lymphocyte proliferative capacity and increase in Treg frequency. However, considering age-related increase in AO rat sensitivity to the induction of EAE, it is noteworthy that, as previously shown [14], the number of dLN CD4+ T lymphocytes was markedly greater in aged immunized AO rats compared with their young counterparts and that in rats of both ages it was greater in immunized than in age-matched adjuvant-administered rats [14]. Moreover, our results showed that not only the number of NK cells infiltrating SC, but also the frequency of CX3CR1+ NK cells, presumably fully mature NK cells [18, 67], substantially differ depending on rat strain and age. It is noteworthy that the number of NK cells infiltrating SC was the greatest in young DA rats developing the most severe disease, whereas it was negligible in young AO rats, which did not exhibit clinically manifested disease. Additionally, in aged rats it was lower in AO rats exhibiting milder neurological deficit of prolonged duration than in DA rats. It was found that NK cell depletion or selective blockade of NK cell homing to the CNS exacerbate EAE [24, 68, 69], whereas their expansion (after IL-2 monoclonal antibody complexes injection) reduces the number of encephalitogenic CD4+ T cells in CNS and attenuates EAE [70]. Additionally, it was shown that: 1) the recruitment of NK cells to the CNS is impaired in CX3CR1 deficient mice immunized for EAE [19] and 2) EAE is more severe in mice lacking CX3CR1 than in wild-type mice [18]. Thus, it was supposed that CX3CR1+ NK cells have a protective/regulatory role in EAE development [18, 19, 24, 68, 69]. Moreover, data obtained in vitro and in vivo suggest that CX3CR1+ NK cells exert regulatory/protective role through cytolytic enzyme-mediated direct cytotoxic action on encephalitogenic myelin antigen-specific CD4+ T lymphocytes [18, 24, 67]. In accordance with previous findings, the frequency of granzyme B+ cells within NK cell population exhibited the same pattern of strain- and age-dependent differences to that described for the frequency of CX3CR1+ NK cells. Having in mind the proposed mechanism of CX3CR1+ NK cell action, Foxp3-CD4+/CX3CR1+ NK cell ratio in SC was determined. In DA rats this ratio decreased with age, suggesting the greater overall capacity of NK cells to restrict (neuro)antigen-specific CD4+ T lymphocyte response. Additionally, consistent with prolonged mild neurological deficit in aged AO rats compared with age-matched DA rats, this ratio in aged AO rats was shifted towards Foxp3-CD4+ cells, suggesting less efficient NK cell regulatory action.
Conclusions
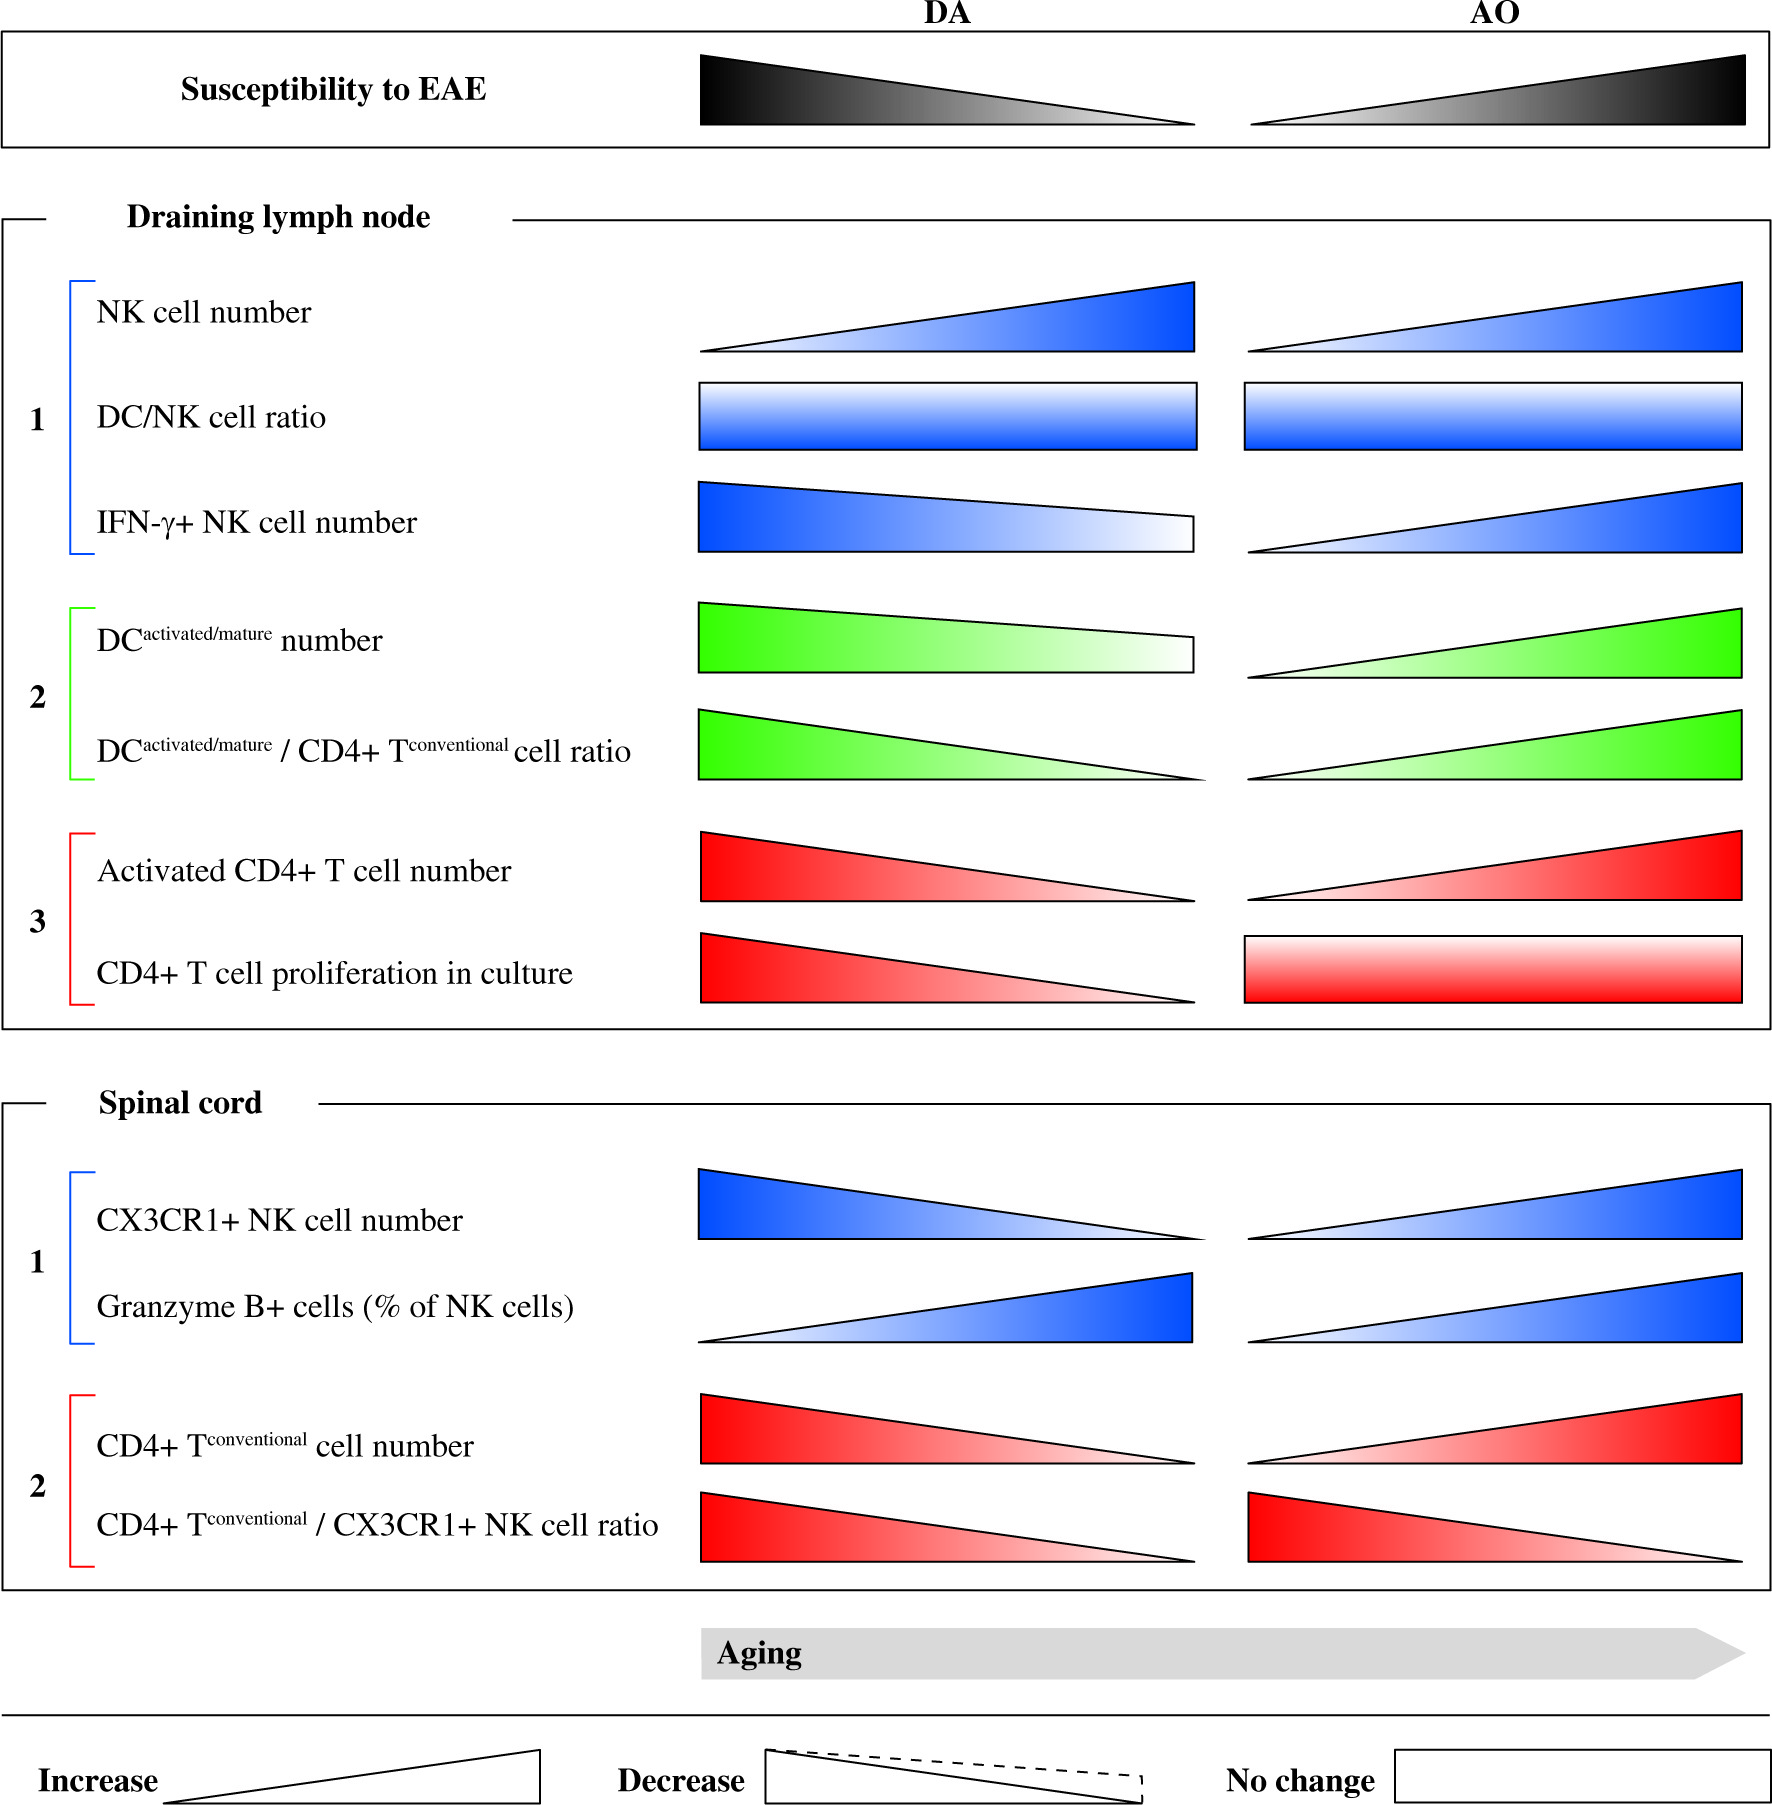
The study indicated that: 1) aging, influencing DC/NK cell ratio and NK cell ability to produce IFN-γ affects DC capacity to stimulate (neuro)antigen-specific CD4+ T lymphocytes in EAE rat dLNs, in a strain-specific way, and 2) the ultimate effect of these changes on the magnitude of (neuro)antigen-specific CD4+ T lymphocyte response in rat EAE model is also dependent on strain-based effector CD4+ T lymphocyte intrinsic changes and/or alterations in Treg frequency in dLNs. Thus, as previously hypothesized [71], the clinical outcome of EAE in aged rats depends on which component/s involved in its pathogenesis (effector T cells, regulatory cells, and accesory cells) is/are dominantly affected by aging. Moreover, the study indicated that enhanced infiltration of aged DA rat SC with mature NK cells relative to that with effector CD4+ T lymphocytes compared with their young counterparts could contribute to milder neurological deficit in aged DA rats. On the other hand, the shift in Foxp3-CD4+/CX3CR1+ NK cell ratio toward Foxp3-CD4+ lymphocytes in aged AO rats compared with age-matched DA rats could be linked with prolonged duration of mild neurological deficit in AO rats. The study as a whole contributes to the understanding of intricate mechanisms controlling development of (auto)immune CD4+ T lymphocyte response in EAE (Fig. 9), and in a long-term perspective it could be important for modeling of personalized strategy for specific groups of MS patients.
Fig. 9
Shematic representation of strain-specific changes in contribution of NK cells from draining lymph node and spinal cord to the immunopathogenesis of EAE in DA rats and AO rats. Draining lymph nodes: (1) Although natural killer (NK), the cell number in draining lymph nodes raised with aging, NK/dendritic cell (DC) ratio changed in neither DA (exhibiting age-related decrease in susceptibility to the disease), or AO rats (exhibiting age-related increase in susceptibility to EAE), whereas the number of NK cells that formed productive contacts with DCs (IFN-γ+) increased only in AO rats (in DA rats it slightly decreased). (2) Age-dependent changes in the number of IFN-γ+ NK cells in rats of both strains correlated with the changes in number of activated/matured DCs and activated/matured DC/conventional CD4+ T cell ratio, and (3) the number of activated conventional CD4+ T cells in their draining lymph nodes. Additionally, consistent with strain-dependent age-related changes in the susceptibility to EAE, (3) neuroantigen-specific CD4+ T cell proliferation diminished and remained unaltered with aging in draining lymph node cell cultures from DA and AO rats, respectively. Spinal cord: (1) Despite the opposing effect of aging on the number of spinal cord infiltrating (CX3CR1+) NK cells (decrease in DA rats vs. increase in AO rats), the frequency of cytotoxic (granzyme B+) cells among NK cells increased with aging in rats of both strains. (2) However, differently from aged DA rats, in their AO counterparts these changes were insufficient to provide favourable conventional CD4+ T/CX3CR1+ NK cell ratio, so it was shifted towards the former cells. Consequently, aged AO rats displayed prolonged neurological deficit compared with their DA counterparts