Introduction
Chronic kidney disease (CKD) is considered as a major public health burden [1]. The number of patients reaching the end-stage renal disease (ESRD) and requiring haemodialysis is constantly increasing, mainly in elderly people in developed countries [2]. Indeed, aging represents a major risk factor for CKD and ESRD by increasing the occurrence of diabetic and vascular nephropathies [3–5].
CKD is often associated with cardiovascular complications [6]. Age, sex, high blood pressure, diabetes, smoking, obesity, and dyslipidaemia are considered as common risk factors for classic cardiovascular diseases and CKD and may explain the high mortality level reported in CKD patients [7–11]. Several risk factors for non-traditional cardiovascular diseases were reported in CKD, among which oxidative stress [12], malnutrition, inflammation, hyperhomocysteinaemia, phosphocalcic metabolism abnormalities, and anaemia were more often implicated [13].
Oxidative stress is simply defined as all the molecular alterations within the organism cells induced by an increased production of reactive oxygen species (ROS), which escape to mechanisms of antioxidant stress regulation [12].
We believe that detecting oxidative stress in CKD patients at an early stage would help to effectively manage the disease and prevent severe complications [14]. Oxidative stress is diagnosed by measuring several markers in blood, mainly malondialdehyde (MDA) for lipid peroxidation [15], advanced oxidation protein product (AOPP) for protein oxidation [16], oxidized low-density lipoprotein (oxLDL) for lipoproteins oxidation, and various markers for nucleic acid oxidation – mainly 8-hydroyguanine [17]. Also, it is of major interest to monitor the effectiveness of antioxidant mechanism by measuring enzymatic, such superoxide dismutase (SOD) and glutathione peroxidase (GPX) [18] and non-enzymatic antioxidant markers such as vitamins C and E and coenzyme Q10 (CoQ10) [19].
For ideal functioning of different organs, cells structure and functions must be well kept and controlled for toxin accumulation and membrane integrity. Likewise, vascular endothelium plays a key role in the vascular tone regulation in response to different stimuli such as prostacyclin, endothelin, and nitric oxide (NO) [20]. The various cell types constituting the vascular wall produce in abundance radical and non-radical ROS and reactive nitrogen species (RNS) [21], responsible for oxidative stress development. ROS and RNS are important modulators of signal transduction pathways and gene expression, which are implicated in the normal vascular homeostasis [22]. Any disruption of this balance will induce endothelial problems [23]. Oxidative stress and inflammation are two major proatherogenic factors, responsible for modification of vascular wall integrity [24].
The vascular wall integrity and cellular function can be compromised by several factors such as hypertension, hypercholesterolaemia, and diabetes, which induce harmful oxidative stress through the activation of nicotinamide adenine dinucleotide phosphate NAD(P)H oxidases and the mitochondrial respiratory chain, and by decreasing NO bioavailability [25].
Atherosclerotic lesions begin following a pro-oxidant imbalance, leading to oxLDL formation and multiple cellular dysfunctions such as synthesis of pro-inflammatory mediators and promotion of cell proliferation factors, in addition to the adhesion of monocytes to the endothelial cells, platelet aggregation, cellular apoptosis or necrosis, and finally the rupture of atherosclerotic plaques [26].
In the atheroma plaque, several macrophage populations were identified with different phenotypes linked to inflammation (pro-inflammatory: M1, anti-inflammatory: M2) or with redox changes in the environment (Mox), increased oxidative stress markers such as AOPP, myeloperoxidases (MPO), and decreased antioxidant markers such as gluthations [27]. It seems that oxidative stress and inflammation are crosslinked and play an important role in (i) endothelial dysfunction, by decreasing endothelial NO (eNO) bioavailability and increasing inducible NO (iNO), (ii) LDL oxidation, (iii) lesion remodelling by proteases and antiproteases regulation, and (iv) smooth muscle cell (CML) proliferation, because CML are the second most abundant cell type in atherosclerotic damage after macrophages. CML hyperproliferation results from cells dedifferentiation from a contractile secretory phenotype, increasing their proliferative and migratory capacity [28].
Intracellular lipids oxidation such as malondialdehyde (MDA) is a common pathophysiological response to oxidative stress and hyperlipidaemia. oxLDL contains hundreds of different oxidised lipid molecules [29]. oxLDL can be found in various abnormal cells such as apoptotic cells and in pathological tissues and in the blood stream in the case of different diseases [30]. Therefore, we believe that oxLDL is a valuable biomarker for hyperlipidaemia and atherosclerosis. oxLDL molecules penetrate the subendothelial space where they undergo many oxidative modifications induced by ROS produced by the wide cell population of blood vessels, mainly monocytes, endothelial cells, and vascular smooth muscle cells (VSMCs) [31], leading to the development of atherosclerosis.
The aim of the study is to determine the relationship between candidate oxidative stress markers and the acceleration of the carotid atherosclerosis process in patients with CKD.
Material and methods
A descriptive longitudinal study with prospective collection was conducted on 162 patients with CKD within the nephrology service of Parnet hospital during the period of 2015–2017. All CKD patients had blood samples taken to measure oxidative stress markers. Furthermore, paraclinical explorations were conducted for all CKD patients using supra-aortic trunk echo-Doppler (TSA) and echocardiography to diagnose possible cardiovascular complications. Patients were medically controlled every three months for 2 years to control the cardiovascular activity and possible complications. As a control group, 40 people were recruited for the study.
Study population
We included in the study all CKD patients, over the age of 18 years, of various aetiologies, and at different stages of development, including haemodialysis patients. As inclusion criteria, CKD patients were in a stable clinical situation and were not receiving injectable iron during the 3 months before the onset of the study. Injectable iron was an exclusion criterion because it generates high levels of oxygenated free radicals [32]. All CKD patients with pre-existing heart disease before the diagnosis of CKD, severe valvular disease, constrictive pericarditis, systolic dysfunction with ejection fraction (ER) <50%, haemodialysis for less than 6 months, glomerular filtration rate (GFR) > 90 ml/min, and peritoneal dialysis were excluded from the study.
The CKD patients included in the study were categorised into five groups according to Kidney Disease: Improving Global Outcomes (KDIGO) 2012 [33] with modification. CKD stage was estimated by calculating the level of creatinine clearance, using the formula proposed in the Modification of the Diet in Renal Disease (MDRD) study [34]. Briefly, stage 2 included patients (n = 31) with mild CKD symptoms and creatinine clearance of 60–89 ml/min. Stage 3 included patients with moderate CKD symptoms (n = 41) with creatinine clearance of 30–59 ml/min. Stage 4 included patients (n = 31) with severe CKD symptoms associated to creatinine clearance of 15–29 ml/min. Stage 5 regrouped CKD patients (n = 25) with very severe symptoms and creatinine clearance lower than 15 ml/min, while patients with very severe CKD symptoms and receiving haemodialysis were categorised at stage 5D (n = 32).
Blood sampling and measurement of oxidative stress markers
Blood samples were taken from the CKD patients included in the study using tubes containing ethylenediaminetetraacetic dipotassium acid (EDTA K2). Samples were centrifuged for 10 min at 4500 rpm (3900 g). Plasma was collected and aliquoted in 1.5 ml Eppendorf tubes and stored at –20°C until further analysis.
AOPP [35], MPO, glutathione, and NO were measured in plasma by the colorimetric method suing a spectrophotometer [36–39]. In the present study we only measured the NO secreted by inducible NO-synthase (iNOS) for their known pro-oxidative role. NO was measured by the quantification of two physiological metabolites of NO: nitrites (NO2–) and nitrates (NO3–) according to Griess (1879).
oxLDL [40] was measured by enzyme-linked immunosorbent assay (ELISA) using Human Oxidised low-density lipoprotein (OxLDL) ELISA Kit (abx253899, Abbexa Ltd, 181 Cambridge Science Park, Cambridge CB4 0GJ, United Kingdom), following the manufacturer instructions.
MDA was measured in plasma using high-performance liquid chromatography (HPLC) using Chromolith® RP-18 Endcapped HPLC Columns (Merck Worldwide Headquarters, 400 Summit Drive Burlington, Massachusetts, 1803USA) according to the protocol proposed by Nielsen et al. (1997) and Michel et al. [41].
Echocardiography
Clinical examination for heart function was conducted using echocardiograph (GE VIVID S6 Ultrasound Machine, KPI Healthcare Inc., 23865 Vía del Rio, Yorba Linda, CA 92887, United States) equipped with a 3.5 MHz probe and functional on Time Movement (TM), two-dimension (2D), and Doppler modes (pulsed, continuous, colour, and tissue). Echocardiography was used to measure the left ventricular diameter and the thickness of its walls [42]. Furthermore, left ventricular mass (LVM) was measured using linear M mode according to the following formula (ASE: American Society of Echocardiography guidelines): LVM = 0.8 × {1.04 [(LVIDd + PWTd + SWTd) 3 – (LVIDd) 3]} + 0.6g, where, LVIDd – left ventricular internal diameter in diastole, PWTd – posterior wall telediastolic, SWTd – posterior septal wall telediastolic.
Left ventricular geometry was analysed according to the ratio DTIS/DTPW (diastolic thickness of the interventricular septum [DTIS]/diastolic thickness of the posterior wall [DTPW]), according to [43–45].
Supra-aortic trunk echo-Doppler (TSA) technique was conducted using a Toshiba Xario ultrasound equipped with a 3.5 MHz probe to analyse the carotid and vertebral axes. The carotid axis examination focused on the primary carotid, carotid bifurcation, and internal and external carotids. The vertebral artery was scanned starting from its origin and in its intervertebral part. The brachiocephalic arterial trunk and the two subclavian arteries were also monitored. The intima-media thickness (IMD) of the primitive carotid was measured on the posterior wall of the primitive carotid at a distance from a plate and the carotid bifurcation [46]. The measurement of IMT includes both the internal and medium borders of the arterial wall, and a thickness ≥ 1 mm was considered as pathological. The upper limit of the IMT for healthy patients was fixed at a threshold of 0.75 mm.
Statistical analysis
Statistical analysis was conducted using Statistical Package of Social Sciences software (IBM SPSS Statistics V22, IBM, 1 New Orchard Road, Armonk, New York 10504-1722, United States). Student’s t test was used for means comparison of two variables, ANOVA test was used to compare more than two variables in parametric tests, while for the non-parametric tests we used Welch and Brown-Forsythe tests. The Tukey and Hartmane test was used for multiple comparisons. A chi-square (χ2) was used for comparison of qualitative variables. The Pearson test was used for the linear correlations. For multivariate studies of independent factors, we used a logistic regression model with Wald type step by step test in which all factors with a p < 0.1 were included in analysis. Tests were considered statistically significant at p < 0.05.
Results
We measured the markers of oxidative stress in different population groups, and values were compared using the Tukey test for multiple comparisons. The average ± standard deviation (SD) levels of inflammatory marker high-sensitivity C-reactive protein (hs-CRP) in CKD groups compared to the control group was 3.64 ±0.21 against 0.57 ±0.05 mg/l, respectively (Table I). For the oxidative stress markers, the average ± SD levels in CKD groups compared to the control were as follows; AOPP (61.89 ±1.4 vs. 26.65 ±1.05 µmol/l), MPO (59.89 ±1.98 vs. 38.45 ±1.98 UI/ml), MDA (6.1 ±0.12 vs. 3.26 ±0.03 µmol/l), NO (65.82 ±1.06 vs. 52.19 ±2.1 µmol/l), glutathione (52.21 ±1.3 vs. 89.4 ±2.6 IU/ml), and oxLDL (15.57 ±1.07 vs. 1.72 ±0.82 µmol/l) (Table I).
Table I
General characteristics, inflammatory markers, and oxidative stress markers of each group. Oxidative stress markers were compared between each CKD group and the control
| Parameter | Control | Stage 2 | Stage 3 | Stage 4 | Stage 5 | Stage 5d |
|---|---|---|---|---|---|---|
| N | 40 | 31 | 41 | 31 | 25 | 32 |
| Age | 45 ±11.8 | 58.5 ±13.4 | 62.0 ±16 | 66.1 ±13.9 | 50.2 ±12.8 | 43.3 ±12.8 |
| BMI | 25.7 ±3.45 | 25.1 ±2.5 | 24.1 ±3.31 | 22.2 ±2.06 | 20.1 ±1.74 | 17.6 ±1.12 |
| hsCRP | 0.57 ±0.05 | 0.79 ±0.08 | 2.34 ±0.14 | 3.29 ±0.16 | 4.66 ±0.22 | 7.53 ±0.47 |
| Prevalence LVH | 2.8% | 35.5% | 51.2% | 64.5% | 70.4% | 87.5% |
| Medium intima media diameter of the carotid artery: | ||||||
| < 0.75 | 97.8% | 93.5% | 90.2% | 74.2% | 55.6% | 6.3% |
| 0.75–1 | 2.2% | 6.5% | 9.8% | 25.8% | 29.6% | 65.6% |
| > 1 | 0% | 0% | 0% | 0% | 14.8% | 28.1% |
| NO [µmo/l] | 52.19 ±2.1 | 61.75 ±2.34• | 63.91 ±2.21••• | 64.08 ±2.18••• | 67 ±2.71•••• | 72.45 ±2.171•••• |
| AOPP [µmo/l] | 26.65 ±1.05 | 40.75 ±0.82••• | 53.54 ±2.01••• | 63.9 ±2.8••• | 72.37 ±2.09••• | 82.75 ±2.19••• |
| oxLDL [µmo/l] | 1.72 ±0.82 | 3.2 ±0.47 | 6.51 ±1••• | 13.32 ±1.42••• | 21.67 ±1.921•••• | 35.78 ±0.981•••• |
| MDA [µmo/l] | 3.26 ±0.03 | 3.99 ±0.08• | 5.23 ±0.05•• | 6.13 ±0.071•••• | 7.23 ±0.071•••• | 8.27 ±0.111•••• |
| MPO [UI /ml] | 38.45 ±1.98 | 43.95 ±2.4• | 50.01 ±2.54•• | 46.38 ±2.83•• | 72.21 ±4.01••• | 88.65 ±4.09••• |
| Glutathione [UI /ml] | 89.4 ±2.6 | 89.4 ±2.6•••• | 71.7 ±1.6••• | 62.7 ±11•••• | 52.2 ±1.81•••• | 40.4 ±1•••• |
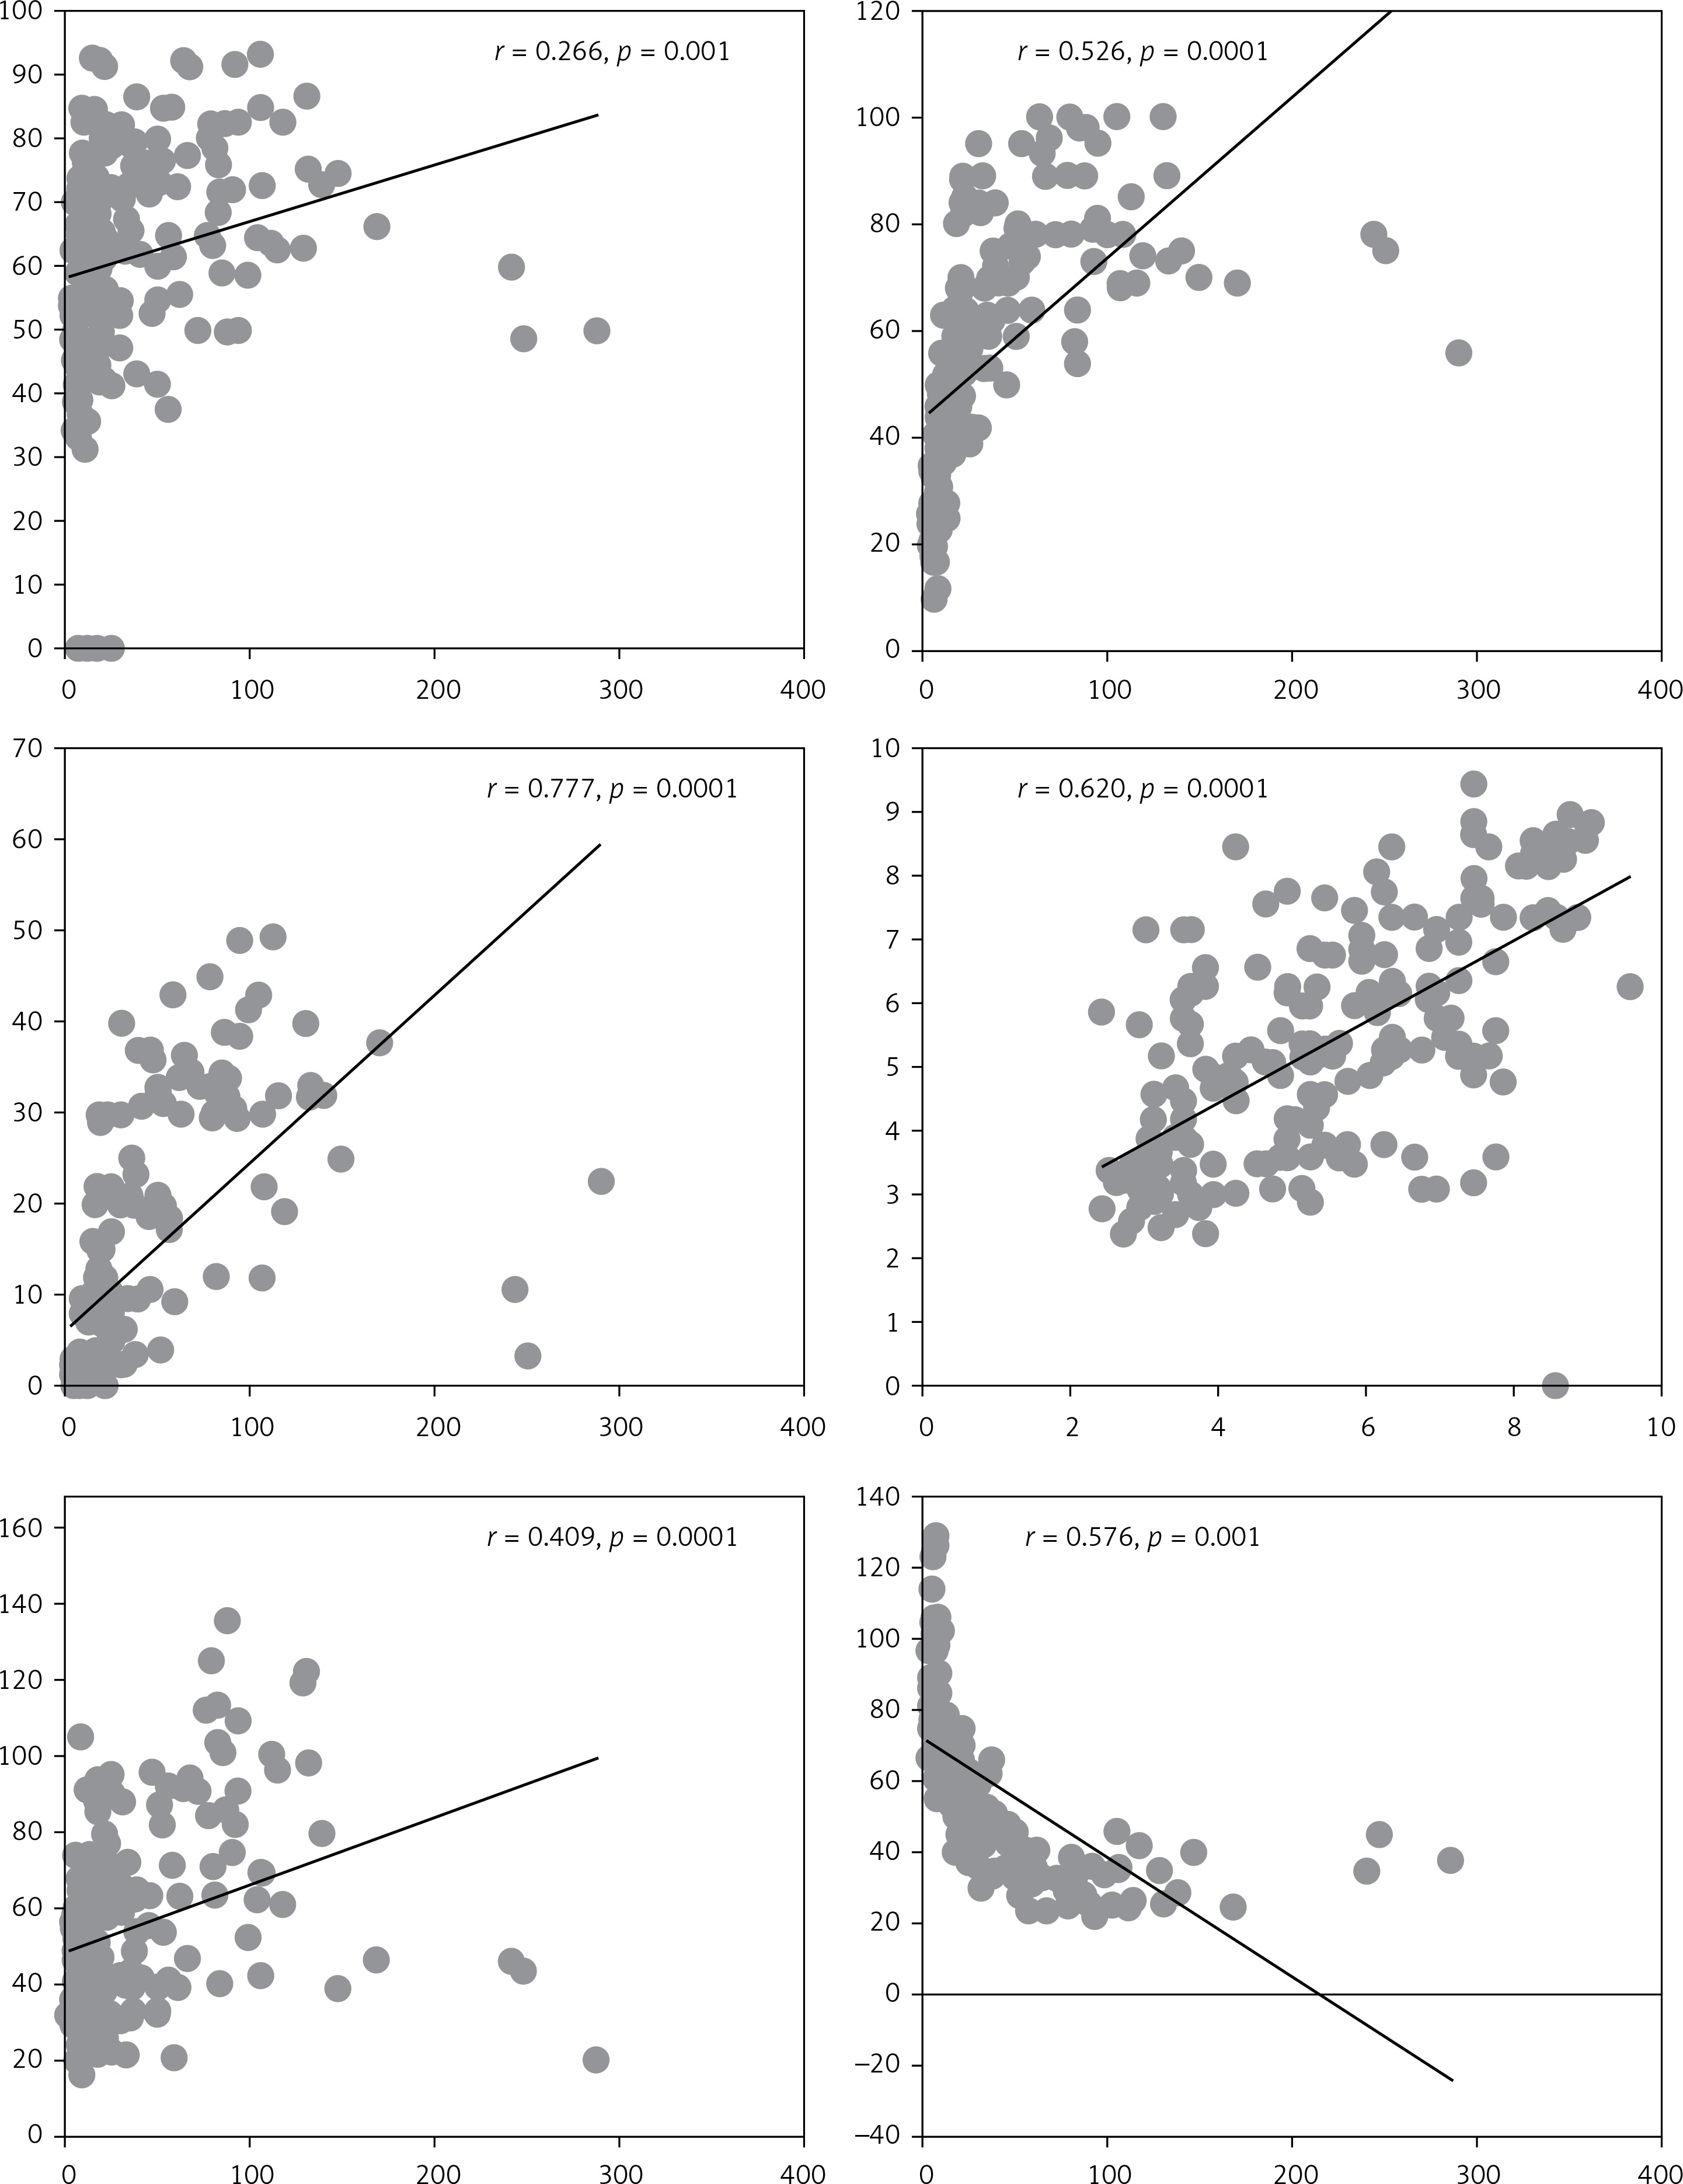
The levels of NO, AOPP, oxLDL, MDA, and MPO increased significantly with creatinine, and thus with the degradation of kidney function (Figure 1). The lowest values of the above markers were reported in the control group (stage 1), while the highest values were registered in CKD patients with very severe symptoms of kidney failure (stage 5) and with haemodialysis (stage 5D) (p < 0.05). Unlike all the other markers, glutathione levels decreased significantly while creatinine levels increase and the CKD symptoms were more severe (p < 0.05) (Figure 1).
Figure 1
Correlation of oxidative stress markers and creatinine levels in the studied population. NO, AOPP, oxLDL, MDA and MPO were positively correlated with creatinine level in CKD patients. However, glutathione was negatively associated with creatinine level and decreased with the progression of kidney failure stage
The intima media diameter of the carotid artery (IMD) was monitored by TSA, and values were compared to the levels of oxidative stress markers (Table II).
Table II
Correlation between the values of oxidative stress markers and IMD
Patients with high IMD (> 1 mm) had higher values of the prooxidant markers (NO, AOPP, oxLDL, MDA, MPO) but lower antioxidant marker values (glutathione), compared to other patients with lower IMD (Table II).
Multivariate analysis by logistic regression was conducted to analyse the candidate risk factors for high IMD and oxidised triglycerides (OR = 0.0022, CI: 0.0001–0.04) and oxLDL (OR = 1.65, CI: 1.30–2.10) were the retained (p = 0.0001).
Discussion
Candidate makers for oxidative stress were measured in CKD patients at different stages and compared to a control group. The levels of NO secreted by iNOS increased concomitantly with CKD stage progression, reaching the highest levels in haemodialysis patients (stage 5D). In the latter group, NO levels (mean ± SD) were 72.45 ±2.17 µmol/l, significantly higher than the control group (52.19 ±2.1 µmol/l) (p < 0.05). Meenkshi and Agarwal [47], working on similar sample size, found that NO levels in haemodialysis patients were 98.77 ±35.40 µmol/l against 22.03 ±7.33 µmol/l in their control group.
We found that the levels of NO induced by iNOS were significantly higher in haemodialysis patients. This could be due to the dialysis procedure, which triggers an inflammatory reaction and cytokine production leading to iNOS upregulation [48]. At high concentrations, NO is a cytotoxic molecule responsible for dialysis complications and causes nutriant stress acting as a highly reactive free radical [49]. Comparing NO levels and IMD, we found that CKD patients with IMD > 1 mm had higher NO levels in their blood compared to those with IMD < 0.75 mm (68.6 ±2.78 µmol/l vs. 60.78 ±1.16 µmol/l, p < 0.05). This result confirms those reported by Miyoshi et al., where they found that lack of NO synthesis by iNOS system in mice prevents the oxidation of oxLDL, thus preventing atherosclerosis development [50].
The levels of AOPP, a powerful oxidative stress marker, were concomitantly increasing with CKD stage progression (Figure 1). The lowest average levels of AOPP were reported in the control group (26.65 ±1.05 µmol/l), while the maximum levels were registered in haemodialysis patients (82.75 ±2.19 µmol/l) (p < 0.0001). These findings confirm those reported by Véronique Witko-Sarsat et al. [36]. The authors reported a level of 29 ±4.9 µmol/l in the control group, compared to 42 ±2.6 µmol/l, 51 ±3.0 µmol/l, and 72 ±4.4 µmol/l in CKD patients with moderate, severe symptoms, and haemodialysis patients, respectively (p < 0.001) [51]. AOPP are considered as uremic toxins [52] created during oxidative stress by the reaction of plasma proteins with chlorinated oxidants such as chloramines and acid hypochlorous [53], which are generated by phagocytic cells that have myeloperoxidase, the only enzyme able to generating chlorinated oxidants [54]. This activity is upregulated in CKD and haemodialysis patients [51].
As expected, CKD patients with a large IMD tended to have higher AOPP levels, compared to CKD patients with normal IMD (55.6 ±16.35 µmol/l vs. 83.38 ±2.78 µmol/l) (p = 0.0001). These results are consistent with the findings of Yang et al. [55], who found that AOPP levels were correlated to IMD (r = 0.332, p < 0.01) and patients with atherosclerotic plaques had higher rates of AOPP than those without plaques (73.87 ±19.40 µmol/l vs. 58.41 ±16.09 µmol/l).
Atherosclerosis is considered as an inflammatory disease with chronic fibroproliferation of the vascular wall [56]. In the present study, CRP levels was significantly higher in CKD patients compared to the control group. The fixation of monocytes and T lymphocytes on the injured endothelium followed by their migration into the intima is one of the most crucial steps in the development of atherosclerotic lesions [57]. When monocytes and endothelial cells are activated, they express several active molecules such as adhesion molecules, cytokines, coagulation and fibrinolytic factors, metalloproteinases, and vasoactive substances [58]. All of these molecules could contribute to atherogenesis and thrombosis. A significant correlation between AOPP and monocyte activation markers was reported [59]. Thus, AOPP may represent a new class of proinflammatory and proatherogenic mediators [51].
The levels of oxLDL increased with the deterioration of renal function (Figure 1). The lowest average level of oxLDL was reported in the control group (1.72 ±0.82 µmol/l) while the highest level was registered in haemodialysis patients (35.78 ±0.98 µmol/l) (p < 0.05). These finding are concomitant with those reported by Bergesioa [60], where oxLDL level was 24.25 ±12.3 µmol/l in the control group compared to 29.75 ±7.89 µmol/l, 31.39 ±3.6 µmol/l, 48.25 ±5.46 µmol/l, and 32.45 ±5.63 µmol/l in CKD patients with moderate, severe symptoms, pre-haemodialysis, and haemodialysis stages, respectively. ROS are considered important mediators of renal failure. In fact, they are released by activated neutrophils and macrophages, which will oxidise apolipoproteins and generate oxLDL [61, 62]. Comparing the oxLDL levels and IMD, we found a positive correlation between the two variables where patients with high IMD had higher IMD compared to patients with normal IMD (6.44 ±0.63 µmol/l vs. 35.89 ±2.63 µmol/l, p = 0.0001). Our findings support those reported by Klahr et al. [34] in which the average level of oxLDL in high IMD patients and those with atherosclerosis plaques was 48.3 ±2.3 µmol/l vs. 29.9 ±4.56 µmol/l, respectively (p < 0.05) [63].
oxLDL plays an important role in the formation of atherosclerotic plaques because it is implicated in the penetration and oxidation of LDL passively in the vascular wall, followed by the adhesion of circulating monocytes. The latter is induced by the vascular cell adhesion molecule 1 (VCAM-1) and inter cellular adhesion molecule (ICAM-1) secreted in the case of endothelial cells dysfunction [64]. Monocyte chemoattractant protein-1 (MCP-1) and ICAM-1 are implicated in the migration and transform monocytes into macrophages. The latter capture oxLDL and transform into foam cells and produce proinflammatory mediators, mainly tumour necrosis factor α (TNF-α) and interleukin 1 (IL-1) and anti-inflammatory cytokine (IL-10), inducing a state of chronic inflammation as well as proliferation of VSMCs [65]. These stages represent the beginning of atherosclerosis plaque formation.
MDA levels increased with the progression of CKD stage, where the lowest average levels of MDA were reported in the control group, while haemodialysis patients had the highest levels (3.26 ±0.03 µmol/l vs. 8.27 ±0.11 µmol/l, p < 0.05). Our findings are similar to those reported by Witko-Sarsat et al. [66], where the lowest MDA levels were reported in control (2.5 ±0.17 µmol/l) and CKD patients with moderate symptoms (3.0 ±0.08 µmol/l) (p < 0.05), while the highest levels were registered in severe (3.0 ±0.05 µmol/l) and final-stage CKD (3.2 ±0.09 µmol/l). It is known that uraemic toxins increase lipid peroxidation, and this phenomenon is more important in haemodialysis patients [67]. In a study conducted by Capeillere-Blandin et al. [68], the highest levels of MPO were reported in haemodialysis patients, and the lowest levels were seen in the control group (88.65 ±4.09 U/l vs. 38.45 ±1.93 U/l, p < 0.05). This difference was also observed in patients at different CKD stages and in haemodialysis patients.
Patients with high IMD (r = 0.536, p = 0.015) and LVH (r = 0.816, p < 0.001) had higher MDA levels. Therefore, the increase in oxidative stress and inflammatory markers contributes to the occurrence of early cardiovascular damage in young CKD patients [69]. MDA participate in cardiovascular complications by binding to modified oxLDL to facilitate its absorption by macrophages, transforming them into foam cells and contributing to atherosclerosis plaque formation [70, 71]. Furthermore, MDA could modify endothelial cells and VSMCs function inducing lesions of atherosclerosis development [72].
MPO levels were the highest in haemodialysis patients and the lowest in the control group (88.65 ±4.09 U/l vs. 38.45 ±1.93 U/l) (p < 0.05). This difference was also observed in patients with different CKD stages and haemodialysis patients. Capeillere-Blandin et al. [68] reported a significant difference in MPO levels between haemodialysis patients and the control group (39 ±4 ng/ml vs. 13.3 ±0.5 ng/ml, p < 0.001) and between pre-haemodialysis and haemodialysis patients (15.3 ±1.1 ng/ml vs. 39 ±4 ng/ml) (p < 0.001). MOP is an oxidoreductase, present in some phagocytic cells such as neutrophils and macrophages, and it is implicated in the formation of hypochlorous acid (HOCl), a reactive oxygen species (ROS), which is extremely pro-oxidant and which destroys the pathogen and represents a source of ROS formation in haemodialysis patients [73].
IMD was positively associated with MOP levels where the highest levels were registered in patients with high IMD. This result confirms the literature findings [74]. It is well documented that MPO initiates and contributes to the development of atherosclerosis, endothelial dysfunction, cardiovascular disease, and other complications in patients with coronary artery disease [75]. Furthermore, HOCl affects endothelial cell function by decreasing the adhesion of proteins in renal cell matrix and accelerating atherosclerosis [76].
Unlike the above markers, the glutathione levels were negatively correlated with the CKD stage, and the lowest average levels were reported in haemodialysis patients, while the control had the highest levels (29.9 ±0.8 IU/ml vs. 89.4 ±2.6 IU/ml, p < 0.05). These findings are concomitant with those reported by Picot et al. [77]. Another study conducted by Tbhariti et al. [78] on 167 CKD patients from different stages showed glutathione levels to be 7.71 ±0.01, 6.62 ±0.50, 5.23 ±0.23, 5.01 ±0.82, 3.99 ±1.39, and 4.94 ±1.12 U/ml) in CKD stage 1, 2, 3, 4, haemodialysis, and peritoneal dialysis patients, respectively (p < 0.001). These results confirm our findings that glutathione levels decrease with the progression of CKD [79]. Glutathione concentrations decrease considerably in the blood stream of haemodialysis patients due to several factors, mainly the bio-incompatibility of the dialyser and endotoxins [80].
Patients with high IMD had low glutathione levels, compared to those with normal IMD (59.2 ±1.3 IU/ml vs. 33.5 ±1.8 IU/ml, p = 0.0001). These results confirm those obtained by Dursun et al. [81], who stated that glutathione level is a representative marker for the antioxidant activity, while high IMD was a sign of atherosclerosis.
In conclusion, patients with CKD are at high risk of developing cardiovascular disease. We found that the acceleration of the atherosclerosis process is very common in patients with severe CKD and haemodialysis patients, and oxidative stress markers increase significantly with the progression of CKD, with the highest values, except for glutathione, seen in haemodialysis patients. This latter group is affected by many external factors such as the contact of blood with biocompatible membranes, which increase the effect of oxidative stress. Furthermore, oxLDL was found to be highly implicated in the development and progression of atherosclerosis, and its measurement could help in the early diagnosis of different cardiovascular diseases. For the management of atherosclerosis and other cardiovascular diseases in CKD patients we think that reducing the level of oxLDL would be an open treatment strategy to be investigated in further studies.
The sample size was a major limitation of the study, and we are working to overcome this and recruit more patients in order to have a representative sample size for the general population. Furthermore, since uric acid is usually increased in CKD patients and is associated with more severe atherosclerosis, we would like to measure it in further studies. Besides, the duration of the study was not sufficient, and we believe that a longer study duration is needed to draw solid conclusions on the oxidative stress markers and the evolution of atherosclerosis following vitamin E intake in CKD patients.