Introduction
Cardiac resynchronisation therapy (CRT) has become a routine therapy for patients with heart failure, reduced left ventricular ejection fraction (LVEF), and widened QRS duration [1]. The use of echocardiography-guided atrioventricular optimisation (AVO) in patients undergoing CRT has been associated with increased exercise capacity, and improved New York Heart Association class and quality of life scores in small patient samples [2–8]. Despite this, the results of the SmartDelay Determined AV Optimisation (SMART-AV) trial, a large, multicentre, randomised study, did not support the routine use of AVO following CRT implantation [9]. AVO performed during the SMART-AV trial was performed at the patient’s intrinsic resting heart rate. This approach may not provide optimal AV synchrony during daily activities when the heart rate is increased [10–12].
Because the protocol for AVO at one of our two sister hospital campuses had been previously modified to specify performance at an accelerated paced heart rate (80 bpm), we aimed to compare AVO results between sites. We sought to evaluate AVO yield at each site in terms of the number of individuals identified with increased tendency for suboptimal filling patterns at the extremes of AV delay settings. We also aimed to identify echocardiographic predictors of optimal AV delay in order to gain mechanistic insights about differing individual physiology within a fairly homogeneous group undergoing CRT for non-ischaemic cardiomyopathy.
Material and methods
Echocardiograms were reviewed from 74 subjects in whom AVO had previously been performed within three months of CRT implantation for non-ischaemic cardiomyopathy at one of two sister hospital campuses (Montefiore Medical Centre: Weiler (C1) and Moses (C2) Campuses). Patients with any mitral or aortic stenosis were excluded. Patients with atrial fibrillation at the time of echocardiography were also excluded.
Prior to AVO, a standard two-dimensional echocardiogram had been performed. These examinations were performed using the same protocol at both hospital campuses at the intrinsic resting sinus rate. Echocardiograms were reviewed and re-analysed by one of the study investigators, who was blinded to campus assignment. Measurements performed included left atrial (LA) volume, left ventricular (LV) end-diastolic volume (EDV), and end-systolic volume (ESV) using the biplane Simpson’s method from both the apical two- and four-chamber views. Right atrial (RA) volume was estimated from the apical four-chamber view using single-plane Simpson’s method. Measurement of mitral E- and A-wave peak velocities was performed from the apical four-chamber view. Inter-atrial conduction time (IACT) was measured from the spectral Doppler tracings of the mitral inflow, using the time interval from the onset of the P-wave to the peak of the A-wave [13, 14]. Mitral annular tissue E-wave velocity was measured from the lateral mitral annulus.
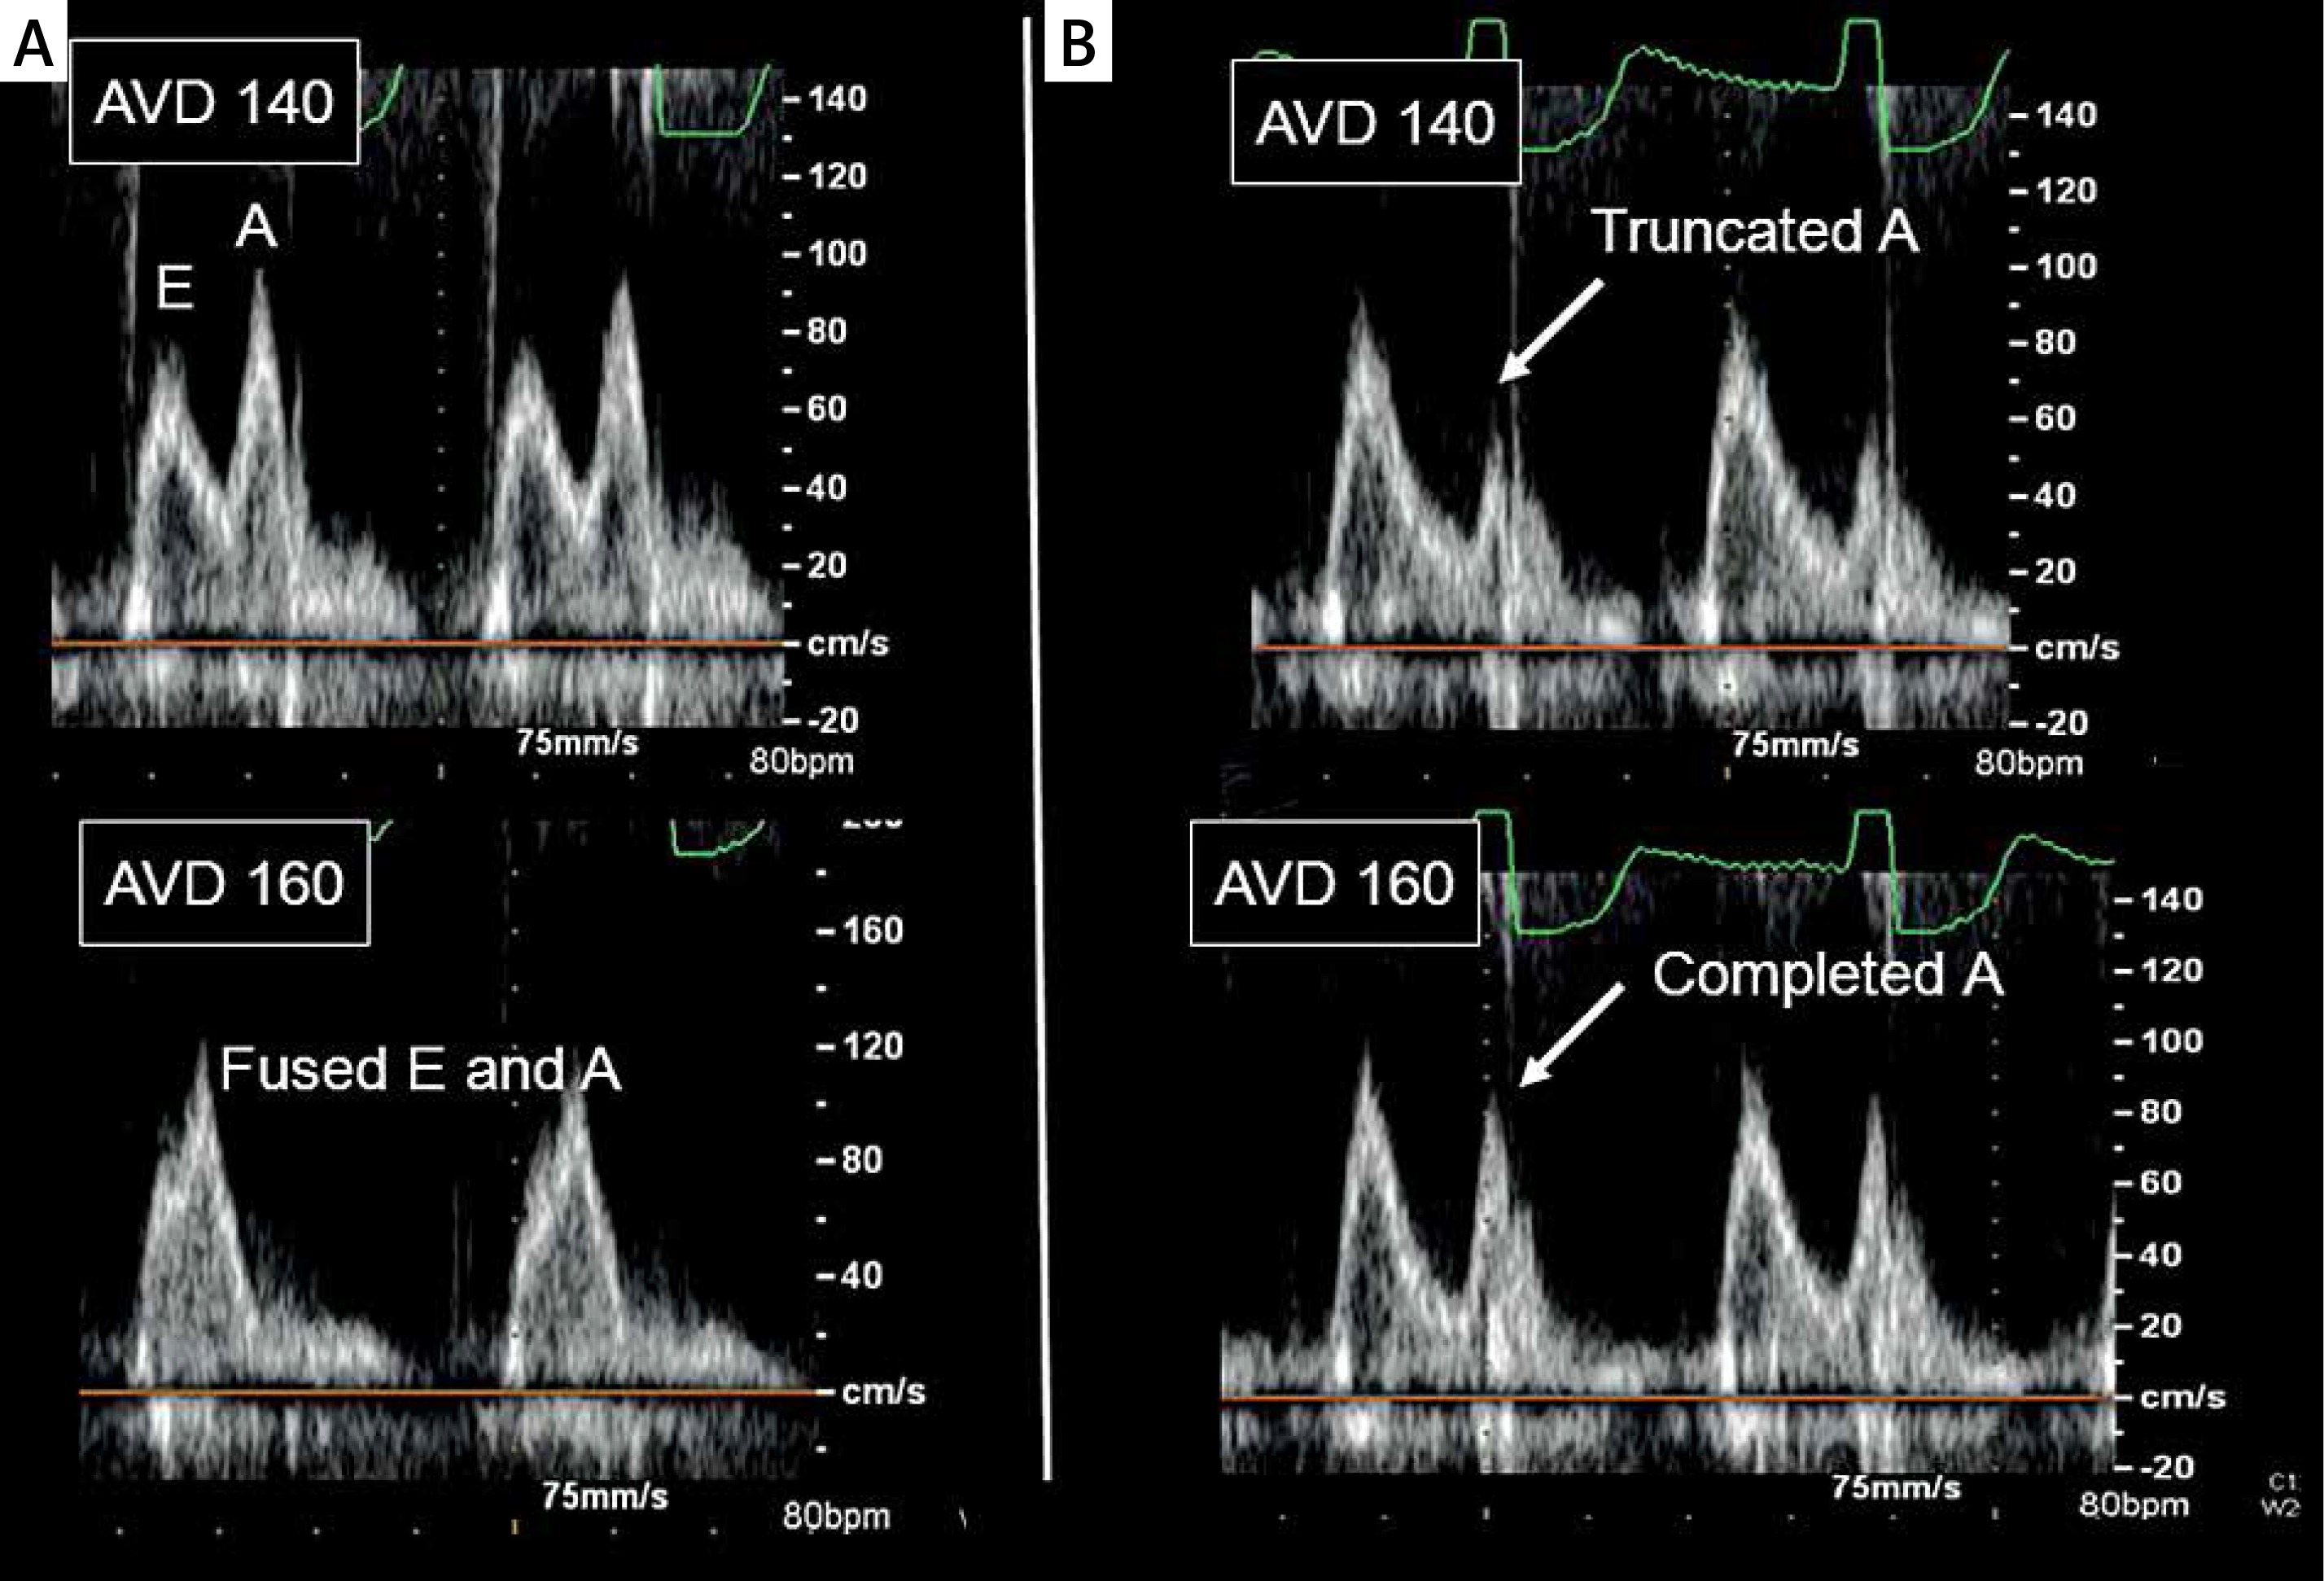
AVO had been previously performed using a standard protocol as outlined below. A single reviewer re-analysed the images from the acquired studies to assess optimal ventricular filling. At campus C1, the lower rate limit for pacing had been performed at the patients’ intrinsic sinus rate. At campus C2, the lower rate limit for pacing had been increased to 80 bpm using DDD pacing during the AVO protocol. This rate was chosen based on prior works showing typical heart rates observed on rate histograms in beta-blocked CRT patients [15]. AVO had been performed by varying the atrio-ventricular (AV) delay from 80 to 200 ms in 20 ms intervals. At each interval, the spectral Doppler tracings of the mitral inflow were obtained. The tracings were examined for evidence of E- and A-wave fusion. The inflow was considered to be fused when onset of the A-wave occurred within 100 ms of the E-wave peak. The tracings were also examined for evidence of A-wave truncation. The A-wave was considered to be truncated when the A-wave deceleration was very abrupt (< 60 ms). When A-wave truncation was suspected, the programmed AV delay was increased by 20 ms. A-wave truncation was confirmed if the peak A-wave velocity increased at the longer programmed AV-delay setting. Examples of E- and A-wave fusion and A-wave truncation are shown in the Figure 1.
Figure 1
The figure shows AVO results for two individuals studied. The individual whose Doppler tracings are shown on the left side of the figure exhibited distinct E- and A-waves at AV delay of 140 ms, but had E- and A-wave fusion at AV delay of 160 ms, thus meeting criteria for “fusion prone”. The individual whose Doppler tracings are shown on the right side of the figure displayed a complete A-wave at AV delay of 160 ms, but showed A-wave truncation at AV delay of 140 ms, thus meeting criteria for “truncation prone” (A – fusion prone patient, B – truncation prone patient)
Patients were categorised into one of four categories based on the results of the AVO protocol. The categories were as follows:
“Fusion prone”: Increased tendency to have E- and A-wave fusion compared to others as defined below.
“Truncation prone”: Increased tendency to have A-wave truncation compared to others as defined below.
Prone to both fusion and truncation: Met criteria for both 1 and 2 above.
Not prone to either fusion or truncation: Did not meet either criteria 1 or 2 above.
When performing AVO, setting the paced AV-delay to longer values causes the A-wave to occur earlier in the cardiac cycle, thus making E- and A-wave fusion more likely to occur [13]. Based on the AVO results from our patient sample, we noted that E- and A-wave fusion frequently occurred with paced AV delay longer than 180 ms and was less common with paced AV delay settings shorter than 180 ms. Accordingly, subjects who demonstrated fusion of E- and A-waves at paced AV delay under 180 ms were labelled as being “fusion prone” and are highlighted with blue in Table I. An example of a patient displaying E- and A-wave fusion prone physiology is shown in the Figure 1.
Table I
The table shows the AVO findings for each individual studied at each of the programmed AV-delay settings used (80 to 200 ms). If the mitral inflow met criteria for E- and A-wave fusion, an “F” was put in the table. If criteria were met for A-wave truncation, a “T” was placed in the table. If neither criterion were met, the cell was left black. When E- and A-wave fusion was demonstrated at programmed AV-delay less than 180 ms, the “F” cells in the table were highlighted in blue, indicating “fusion prone” physiology. When A-wave truncation was noted at programmed AV-delay greater than 120 ms, the “T” cells in the table were highlighted in pink, indicating “truncation prone” physiology
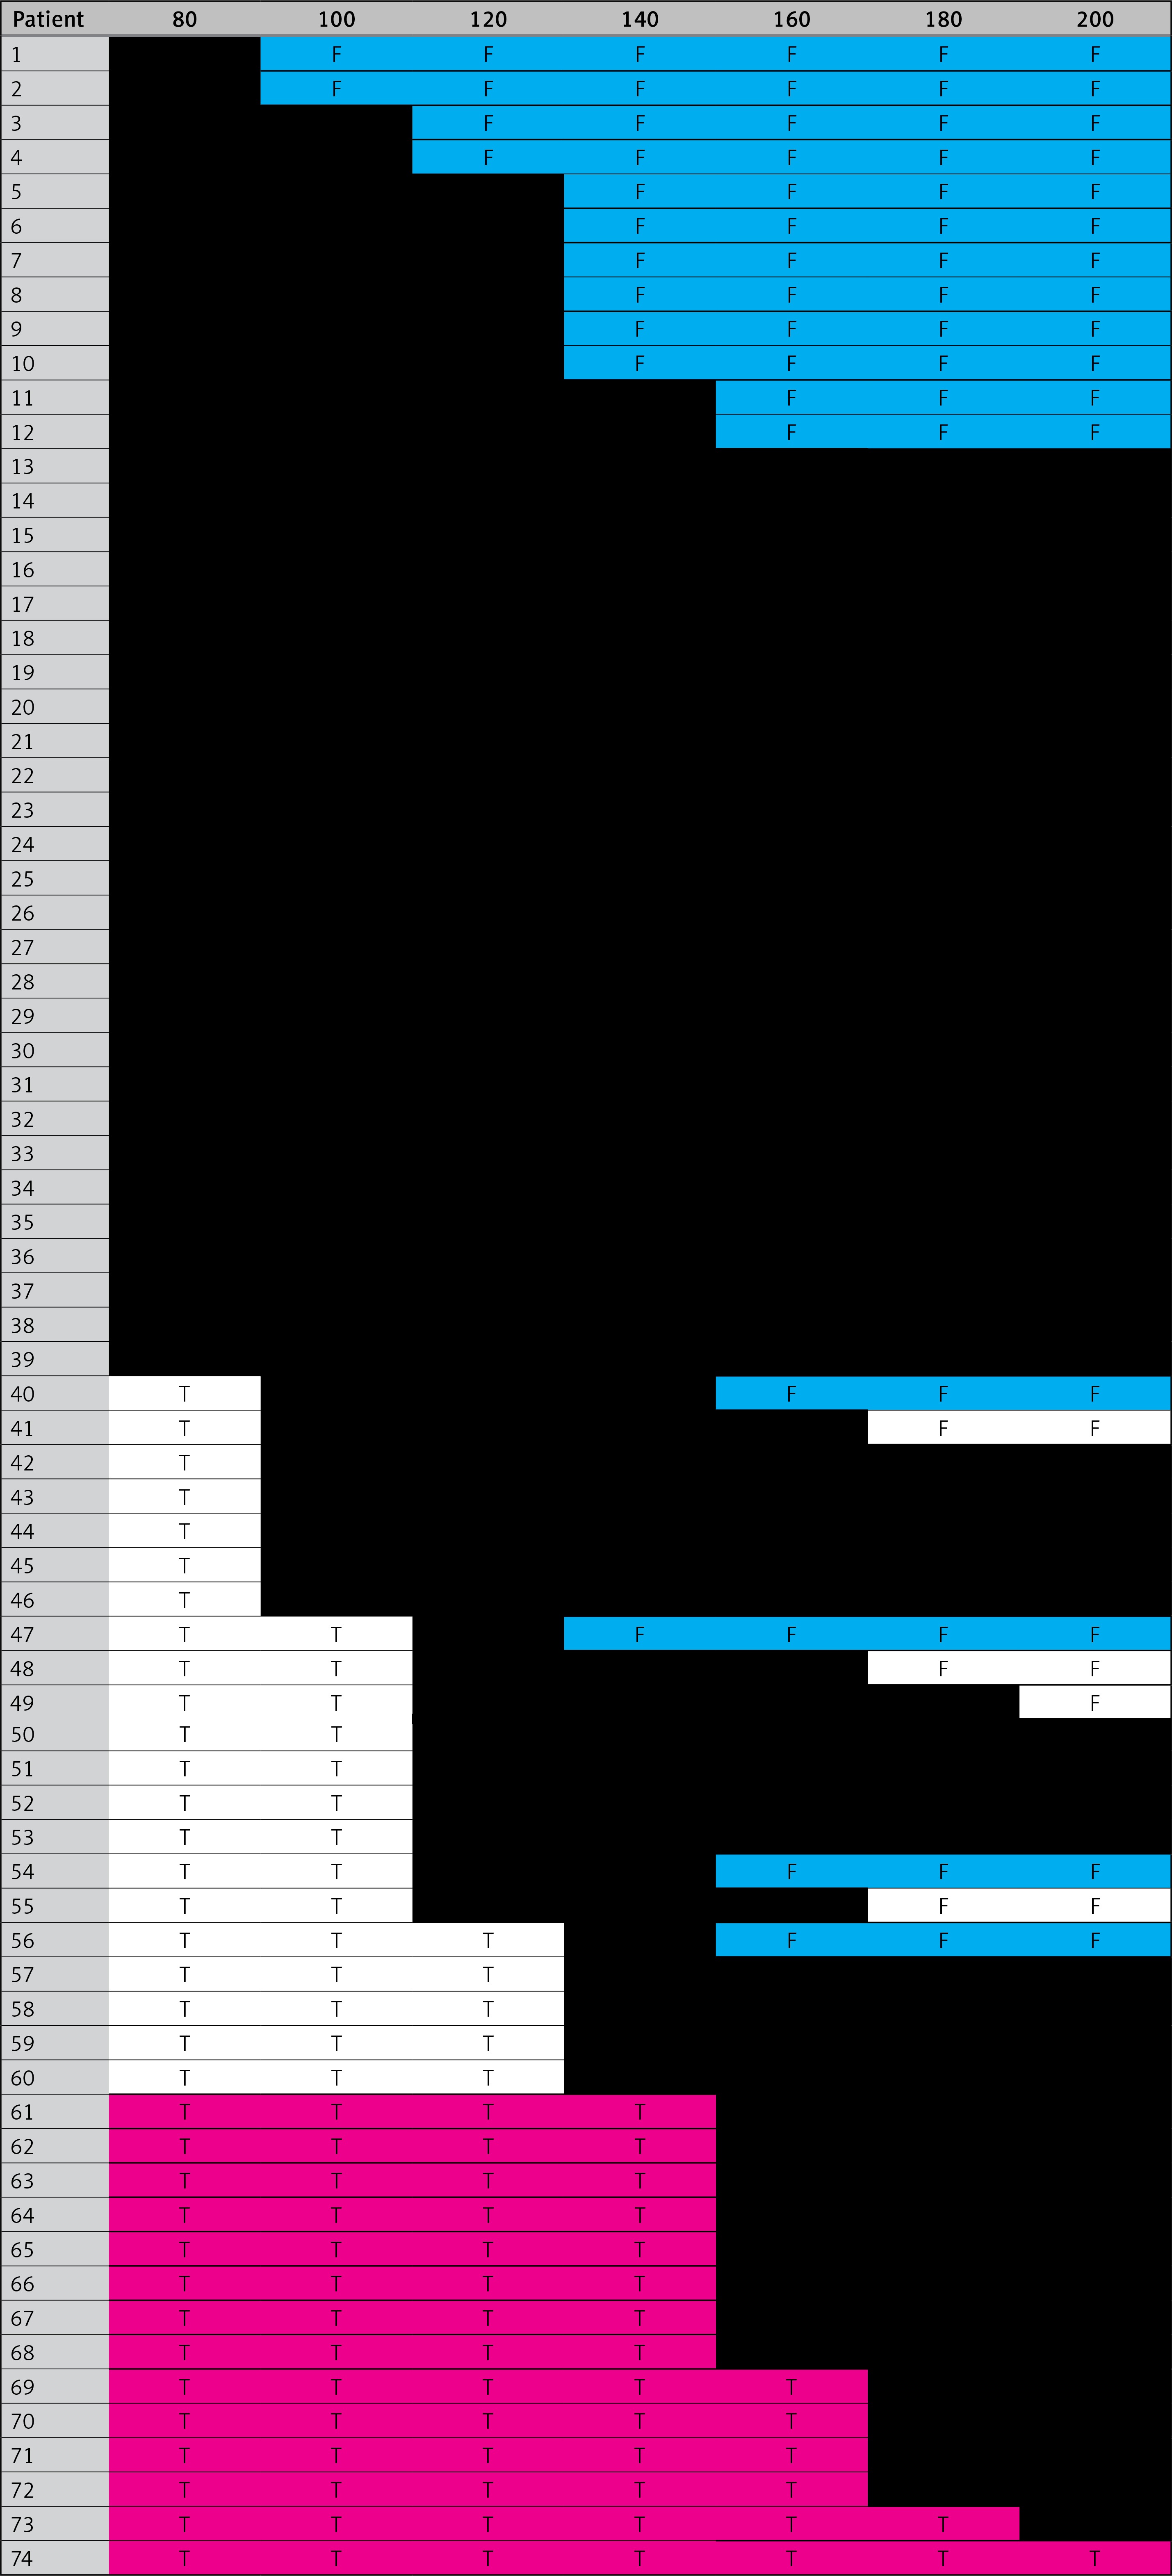
Conversely, when AV delay settings are set to short intervals, the A-wave occurs later in the cardiac cycle closer to mitral valve closure and predisposes to A-wave truncation [13]. Review of the AV delay settings from our patient cohort showed that A-wave truncation was common when the paced AV delay was set to intervals shorter than 140 ms. Accordingly, subjects who demonstrated A-wave truncation at paced AV delay longer than 140 ms were labelled as being “fusion prone” and are highlighted with pink in Table I. An example of a patient displaying A-wave truncation prone physiology is shown in the Figure 1.
Statistical analysis
Statistical analysis was done using Stata software, version 9.1 (College Station, TX). Normally distributed data were presented as the mean ± standard deviation (SD). Non-normal data were presented as the median (interquartile range (IR)). Comparison of means was performed using the two-sample t-test. Comparison of categorical data was performed using the χ2 test. Comparison of medians was performed using the Mann-Whitney or Kruskal-Wallis tests as appropriate. P-values were considered significant if < 0.05.
Results
Table II shows the demographics and echocardiography findings for each patient stratified by hospital campus. No difference was seen with respect to age, sex, and time from CRT implantation to AVO between those studied at each hospital campus. Similarly, no difference was observed during the standard echocardiographic examination at resting heart rate with respect to LV ejection fraction, LV EDV, LA volume, E-wave velocity, A-wave velocity, E/A ratio, E/Em ratio, or diastolic function grade between the two sites. Those studied at C1 had shorter mitral E-wave deceleration time (measured at intrinsic sinus rate at both campuses) compared to those optimised at C2. The difference in deceleration time between campuses was not significant when adjusted for RR interval. During AVO, those studied at C2 were more likely to be “fusion prone” (36% vs. 9%; p = 0.006) and were more likely to have either “truncation- or fusion-prone” (58% vs. 27%; p = 0.007).
Demographic and echocardiographic variables are displayed stratified by campus where AVO was performed. Results presented as mean ± SD if normal or as median [IQR] if non-normal
Table III shows demographics, resting echocardiography variables, and AVO data stratified by “fusion prone” and “truncation prone” status. Those who were “fusion-prone” were younger, had lower E-wave velocity, lower E/A ratio, and increased prevalence of grade 1 diastolic dysfunction, compared to those who were not “fusion prone.” Those who were “truncation prone” had larger LA volume, larger RA volume, larger total atrial volume, higher E-wave velocity, lower A-wave velocity, higher E/A ratio, and increased prevalence of grade 2 diastolic function, compared to those who were not “truncation prone.”
Table III
Demographic and echocardiographic variables for the whole study sample and also stratified by those who were “fusion prone” or “truncation prone”. Subjects who were “fusion prone” are compared to those who were not “fusion prone”. Subjects who were “truncation prone” are compared to those who were not “truncation prone”
Discussion
The main finding of this study is that performing AVO while pacing at increased heart rate (80 bpm) is associated with an improved identification of those who are prone to E- and A-wave fusion. This result is somewhat intuitive because increased heart rate is associated with shorter diastolic periods and therefore gives less time for completion of E- and A-waves. By pacing at increased heart rate and shortening the diastolic period, we were able to identify individuals with increased physiologic tendency for E- and A-wave fusion (i.e. “fusion prone”) more often. The data also suggest that pacing at an accelerated heart rate increases identification of those who are prone to A-wave truncation (i.e. “truncation prone”). Although the prevalence of A-wave truncation was not significantly higher in those who had AVO at C2, the total number of subjects identified as being either “truncation prone” or “fusion prone” was higher at C2.
This study also sought to identify physiological features associated with increased tendency toward being “fusion prone” or being “truncation prone.” We found that subjects who were “fusion prone” had decreased E/A ratio and lower diastolic function grade compared to those who were not “fusion prone”. The reasons for these finding may attributable to longer duration of the E-wave or to more delayed E-wave onset in those who are “fusion prone”. Either of these conditions would increase the tendency for the E-wave to extend into the A-wave. Delayed onset of the E-wave could occur if the isovolumetric periods are prolonged. We also found that subjects who are “truncation prone” had larger atrial volumes, increased E/A ratio, and higher diastolic function grade compared to those who are not “truncation prone”. These findings may be explained by increased left ventricular end-diastolic pressure in the “truncation prone” group, a condition known to shorten A-wave deceleration time [16]. Enlarged atria in the “truncation prone” group may also indicate longer inter-atrial conduction time. Longer time delay from p-wave onset until left atrial contraction would leave less time for completion of the A-wave and thus make A-wave truncation more likely to occur. Although we did not note a difference in IACT between the “truncation prone” and non-“truncation prone” subjects, our estimates of the true IACT may have been limited by our Doppler echo technique for estimating IACT.
This study has several important limitations. Most importantly, patients were not assigned to each site through randomisation. Accordingly, there may be some underlying differences in the patient characteristics, medications used, or CRT devices used between sites, which could explain the results. We did not, however, note any important differences between subjects studied at each hospital campus with respect to demographic and echocardiographic variables examined. The choice of paced heart rate at C2 was made based on examination of rate histograms in subjects with recent implant of CRT devices. Futures studies to determine the optimal heart rate for AVO should be performed. Similarly, it is not known if AV-sequential pacing at 80 bpm is equivalent to performing AVO during actual activity. Several works have attempted to perform AVO during activity; however, the effect of exercise on the optimal AV delay was felt to be heterogeneous between studies [10–12].
In conclusion, we found that performing AVO at accelerated heart rate (80 bpm) increased the yield of patients displaying “fusion prone” or “truncation prone” physiology. Identifying patients with these physiologies may be important for providing optimal AV synchrony during daily activities.