

Introduction
Periodontitis occurs as a result of disrupted homeostasis and periodontal tissue injury, which is provoked by the inflammatory response to commensal microorganisms found in dental biofilm [1]. The severity of the disease is characterized by the level of connective tissue degradation, pocket formation and bone loss. The disease progresses mainly in molars and interproximal areas, especially in areas with higher probing depth [2].
A. actinomycetemcomitans, P. gingivalis, P. intermedia, T. forsythia, F. nucleatum and P. micros are the most significant markers for tissue loss [3] and in periodontal pockets with higher probing depth, more anaerobic activity is observed [4]. These bacteria stimulate the proliferation of circulating immune cells and the production of proinflammatory cytokines, prostaglandins and proteases. Among these, the fundamental molecules for extracellular matrix degradation and remodeling are matrix metalloproteinases (MMPs) [5]. MMPs are divided into several subgroups: collagenases (MMP-1, -8, -13, -18), gelatinases (MMP-2, -9), stromelysins (MMP-3, -10, -11), membrane type MMPs (MMP-14, -15, -16, -17, -24), and others.
MMP-3 (stromelysin 1) is essential for activating proMMPs, e.g. to process proMMP-1 to fully activate MMP-1, and to digest a wide variety of extracellular matrix molecules [6].
Our aim was to evaluate and compare the levels of certain pathogenic bacteria and MMP-3 in patients with chronic periodontitis (CP), aggressive periodontitis (AgP) or patients without any bone or attachment loss and compare the difference of these levels according to the clinical attachment loss severity and probing depth of the same individuals.
Material and methods
Subjects
Twenty non-smoking, untreated patients with generalized aggressive periodontitis, 20 patients with chronic periodontitis, and a control group of 10 periodontally healthy subjects were evaluated. None of the participants had any systemic disease, and in the six months leading up to the sample collection, none of them were prescribed any antibiotics or anti-inflammatory medicine.
Clinical evaluation
The individuals were diagnosed clinically and radiographically as defined by the American Academy of Periodontology [7]. The following criteria were measured with a Williams type probe for determining each subject’s periodontal status:
Collection of gingival crevicular fluid
Collection of gingival crevicular fluid (GCF) samples were collected from 90 sites in 20 individuals with AgP and 20 individuals with CP. In each patient, samples were collected from at least one site with severe periodontal tissue destruction from the patient’s deepest pocket (CAL and PD ≥ 5 mm) (AgP_D, CP_D) and from at least one site with no attachment loss (PD ≤ 3 mm) (AgP_H, CP_H). In the control group, 10 samples were taken in total from a random crevice of each periodontally healthy individual.
In addition, 10 of the AgP and 10 of the CP patients were included in a microbiological evaluation. One sample from a periodontally diseased and one sample from a healthy site were obtained from each patient.
Samples of GCF were collected with periopapers (PROFLOW Inc. NY, USA). These strips were put into Eppendorf Tubes separately, and these tubes were labeled and weighed before and after GCF collection. The net weights of the GCF samples were determined by subtracting the initial weights from those obtained, and they were stored at –80°C until the laboratory evaluation process commenced.
ELISA analysis
MMP-3 levels were measured with Enzyme Linked Immuno Assay (ELISA) kits (KAC1541-HU MMP 3) as specified by the manufacturer (BioSource, Invitrogen Massachusetts, USA). These analyses were carried out at the Department of Immunology Laboratory. They were applied as follows: Eppendorf tubes containing frozen periopapers were defrosted by holding at room temperature for at least 20 minutes. 300 microlitres (µl) of phosphate buffer saline (Ph 7) with 0.05% bovine albumin was added to each GCF sample and was stored for 24 hours in a refrigerator at +4°C. The GCF samples were nursed into periopapers, then diluted with phosphate buffer solution. 100 µl of 1% BSA-PBS Tween buffer solution (pH = 7.4) was added to each tube. Tubes were held for one hour at room temperature and then mixed horizontally at +4°C for 20 h. Following this procedure, the absorbent papers were removed from the Eppendorf tubes. After 24 h, 100 µl from each solution was pulled with micropipettes to determine their MMP levels. These measurements were taken using an ELISA kit, applying the two-step sandwich enzyme method. All of the wells of the micro plaques present in the kit were covered with monoclonal MMP antibodies. Afterward, the MMP standards were diluted, as instructed by the ELISA kit’s guide. The standards and GCF samples, measuring 100 µl, were then transported into each well with micropipettes. They were left for 4 hours for incubation. During this period, MMP bonded tightly to the antibodies. After incubation, the samples were washed in order to remove any unconnected parts. Then, 200 µl of the secondary MMP monoclonal antibodies, which were connected with acetylcholinesterase, were added into the wells and left for 16 hours in order to let the secondary antibodies connect to MMPs. After the incubation, the samples were washed to remove excess secondary antibodies, and 200 µl of chromogenic substrate was added to the solution. After 15 minutes, H2SO4 was added to halt the reaction. The enzymatic activity was read by ELISA at 405 nm. The MMP results from the ELISA were obtained as concentrations measured in picograms/ml (pg/ml).
To analyze the amount of MMP per unit volume, the weights of the collected GCF samples needed to be converted into volume units. These GCF sample volumes were determined by measuring how much GCF the paper strips had absorbed. This process is explained below:
0.05% bovine albumin was dissolved in PBS.
100 µl from this solution was added to each of the paper strips, each of which was then put into its own Eppendorf tube. They all were weighed before and after the process. This experiment was repeated 10 times for every weight. The average of these 10 measurements was used to obtain the unit volume corresponding to the unit weight. It was determined that 1 γ corresponded to 990 µl. These raw data were then multiplied with the coefficients to form the real data.
Detection of microbiological samples
Microbiological samples were collected from one of the deepest periodontal pockets of each patient as well as from a region without attachment loss and without pocket formation. Before taking the samples using sterile paper points, supragingival plaque and debris were completely removed with cotton pellets.
The bacterial composition of the samples was semi-quantitatively determined with Par<sup>o</sup>Check at the Department of Microbiology.
Each DNA sample was extracted and purified according to the standards of the manufacturer’s instructions for the GenElute Bacterial Genomic DNA Kit (Sigma-Aldrich Co, St. Louis, MO, USA). The PCR amplification was carried out in a 20 µl solution. The solution included: Master Mix (18.8 µl), the sample DNA (1 µl), and Taq DNA polymerase (0.2 µl) (Fermentas UAB, Vilnius, Lithuania). The Master Mix was obtained with the Par<sup>o</sup>Check kit (Greiner Bio-One GmbH, Frickenhausen, Germany) and contained dNTPs, a forward as well as a 5' end Cy5-labeled reversed primer, which universally targeted 16S rDNA. The amplification was performed using a thermocycler (Eppendorf AG, Master Cycler Personel 22331, Hamburg, Germany), using the following temperature profiles and cycles: 1) pre-denaturation at 94°C for 1 min; 2) 45 cycles: 95°C for 20 s, stringent annealing at 60°C for 20 s; 3) elongation 72°C for 30 s; and 4) final elongation after 45 cycles: 72°C for 1 min. Chip hybridization was carried out applying the guidelines of the manufacturer’s instructions (Par<sup>o</sup>Check, Greiner Bio-One GmbH). Each slide was incubated for at least 5 min at 60°C in a saturated humid environment. Then, the hybridization buffer (30 µl) and the target PCR product (5 µl) were combined at room temperature, and 25 µl of this solution was placed onto a slide, and a coverslip (25 mm × 25 mm) was placed on top of it. The slide incubation continued for another 10 min. Then, after removing the coverslip, the slide was treated with a buffer system (supplied with the Par<sup>o</sup>Check kit). Using centrifugation, the surface was dried. Afterward, a CheckScanner (Greiner Bio-One GmbH) was used to automatically generate results, which were then processed using the ParoReport software (supplied with the Par<sup>o</sup>Check Kit, based on Gene Pixt, Axon Instruments Inc.). Using a semi-quantitative labeling scheme, the software interprets the control signals and restrains or releases the generation of an analysis report. The following labeling scheme was used to estimate the results (from weakest to strongest): negative, trace, low, moderate and high.
Statistical analysis
Means of PI, GI, PD and CAL were evaluated by ANOVA. These averages were compared with each other using the Bonferroni multiple variables test. Immunological and microbiological data were evaluated by the Kruskal-Wallis test. Statistically significant data were further evaluated using the Mann-Whitney U-test. The correlation of the data was determined using the Spearman test.
Results
CP and AgP groups showed significantly higher PI, GI, PD and CAL values compared to healthy subjects. The values of GI for the AgP group were slightly higher than those of the CP group, and the PI values were higher in the CP group compared to those of the AgP group, but these differences were not statistically significant. Both the CP and AgP groups had higher PD values compared to healthy subjects, and AgP patients had higher PD than the CP group, as expected. As for CAL means, the AgP and CP groups showed equally higher CAL values than the healthy group (Table 1).
Table 1
Clinical parameters and MMP-3 levels according to the groups
[i] AgP – aggressive periodontitis, CP – chronic periodontitis, PD – probing depth, CAL – clinical attachment levels, MMP-3 – matrix metalloproteinase 3; a statistically significant difference compared with healthy individuals, β statistically significant difference compared with CP, c p < 0.05 compared with H and CP_H
When comparing all the data within the MMP-3 values, a significant difference was found (χ2 = 19.853; p < 0.001). Detailed analysis of the immunological data was carried out using the Mann-Whitney U-test (Table 1). The results were as follows: the AgP_D and AgP_H showed significantly higher MMP-3 values when compared both to the healthy sites of patients with chronic periodontitis (CP_H) and to the sites of the healthy control group (H) (p < 0.05). No statistically significant difference was observed between other groups (p > 0.05).
The microbiological results from the AgP and CP samples were divided into four subgroups based on patient group and the health of the sample site: AgP_H, AgP_D, CP_H and CP_D. Par<sup>o</sup>Check results were given as negative (–), trace ((+)), low (+), moderate (++) and high (+++). Prevalence values for the bacteria can be found in Figure 1.
Fig. 1
Prevalence values of bacterial counts. Stacked bar chart of levels of bacterial species in the samples. Total length of each bar stack indicates the prevalence of bacterial species. Different colors indicate the percentages of samples containing different levels of the species. F.n. – F. nucleatum, P.g. – P. gingivalis, P.m. – P. micra, P.i. – P. intermedia, E.c. – E. corrodens, T.d. – T. denticola, C.r. – C. recta, T.f. – T. forsythia, A.v. – A. viscosus, A.a. – A. actinomycetemcomitans
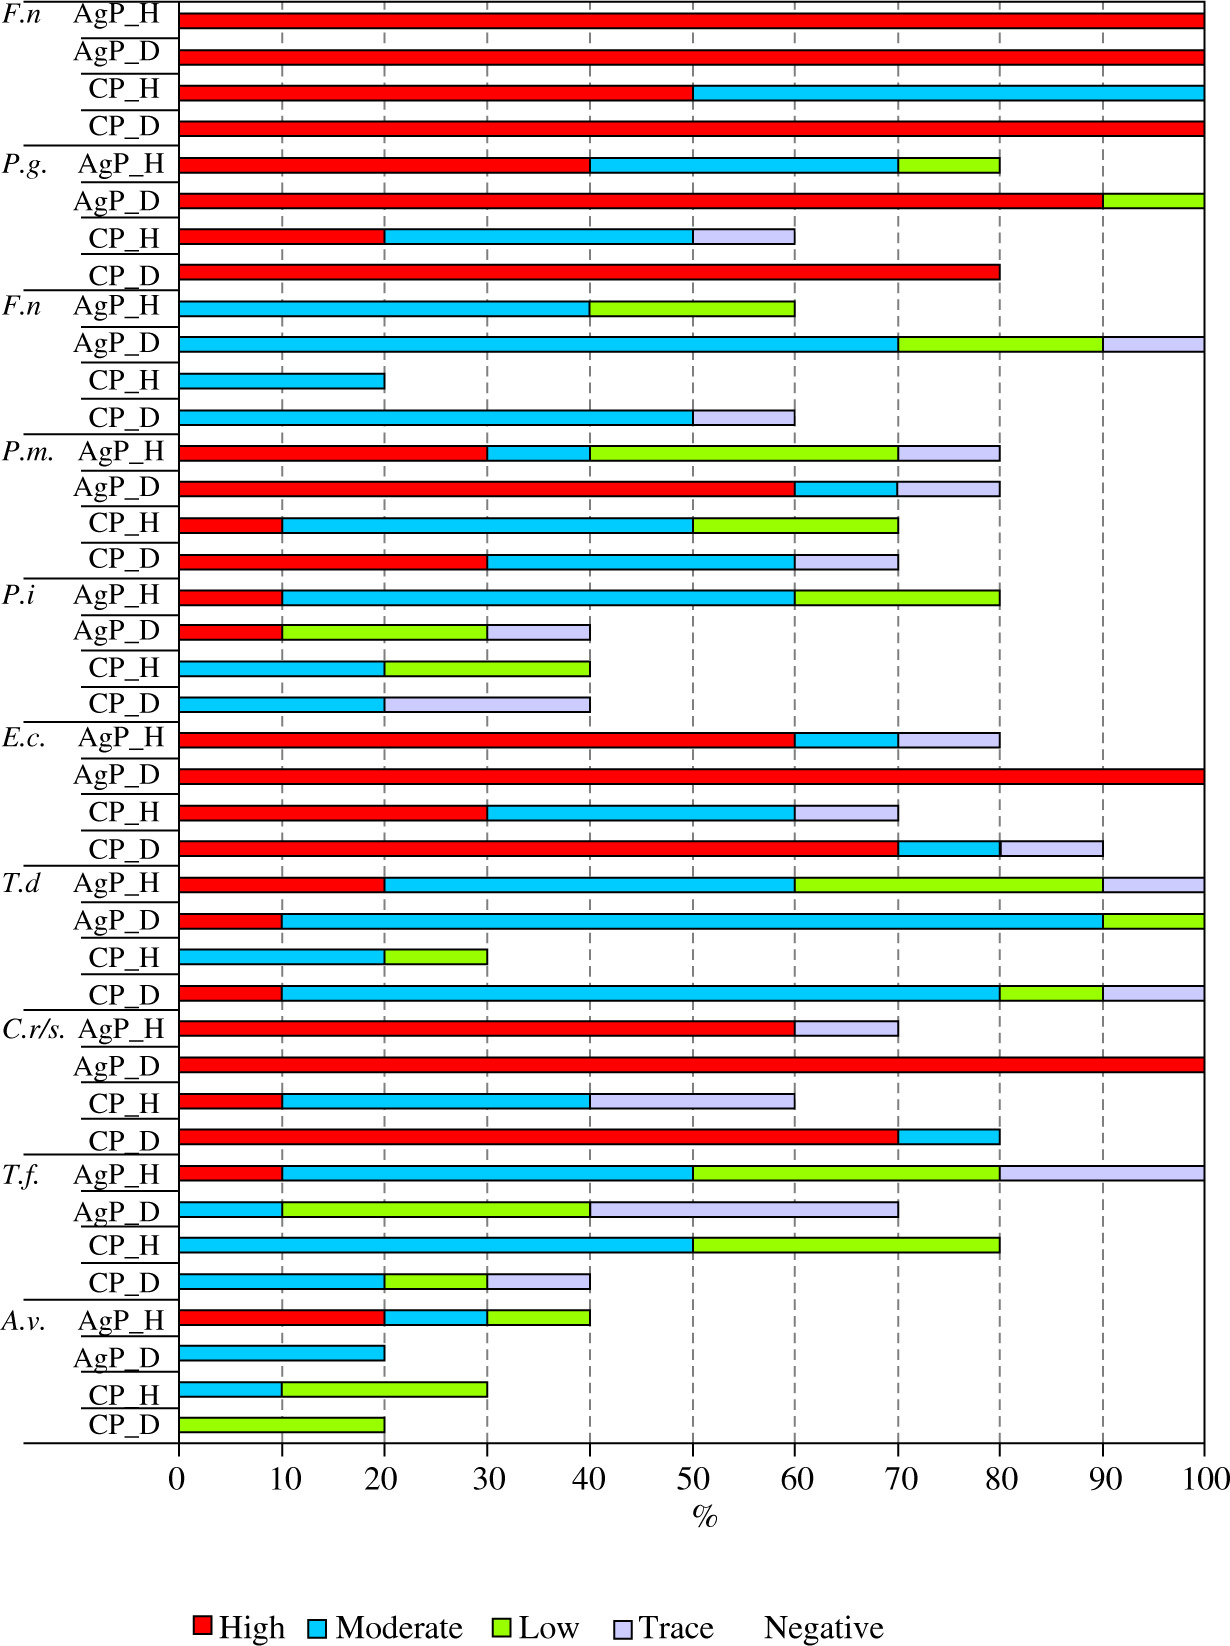
The bacterial count of T. forsythia from the AgP_D group showed significantly higher values compared to the three other groups. Likewise, T. forsythia obtained from the CP_D group were higher than those of the CP_H group. The number of C. recta obtained from the CP_H group were significantly lower than either Ag_D or Ag_H samples. As for T. denticola, bacterial levels of AgP_D were significantly higher than AgP_H or CP_H. For P. gingivalis, the bacterial level of AgP_D was significantly higher than the AgP_H, CP_H, or CP_D samples. Likewise, levels from CP_D sites were significantly higher than those of CP_H (p < 0.05). In Ag_H, Ag_D, and CP_D sites, high levels of F. nucleatum were found and there was no difference among these groups (p > 0.05). In CP_H, moderate levels of F. nucleatum were detected but compared to other groups these were significantly lower (p < 0.05).
The correlation of the microbiological data was evaluated with the Spearman test. T. denticola, T. forsythia, P. gingivalis, C. recta and F. nucleatum levels showed positive correlations with each other (Table 2). The relation between bacterial counts and probing depth are shown in Table 3.
Table 2
Correlation of the periodontal pathogens
[i] AgP – aggressive periodontitis, CP – chronic periodontitis, A.a. – A. actinomycetemcomitans, A.v. – A. viscosus, T.f. – T. forsythia, C.r. – C. recta, T.d. – T. denticola, E.c. – E. corrodens, P.i. – P. intermedia, P.m. – P. micra, P.g. – P. gingivalis, F.n. – F. nucleatum, a p < 0.05, correlation is significant at the 0.05 level (2-tailed), b p < 0.01, correlation is significant at the 0.01 level (2-tailed)
Table 3
Correlation of periodontal pathogens with probing depth and MMP-3 values
| A.a. | A.v. | T.f. | C.r. | T.d. | E.c. | P.i. | P.m. | P.g. | F.n. | |
|---|---|---|---|---|---|---|---|---|---|---|
| PD | –0.142 | –0.257 | 0.530b | 0.483b | 0.476b | –0.166 | 0.190 | 0.367a | 0.434b | 0.399a |
| MMP-3 | 0.123 | 0.011 | 0.385a | 0.229 | 0.314a | 0.043 | 0.100 | 0.349a | 0.248 | 0.329a |
[i] PD – probing depth, MMP-3 – matrix metalloproteinase 3, A.a. – A. actinomycetemcomitans, A.v. – A. viscosus, T.f. – T. forsythia, C.r. – C. recta, T.d. – T. denticola, E.c. – E. corrodens, P.i. – P. intermedia, P.m. – P. micra, P.g. – P. gingivalis, F.n. – F. nucleatum, a p < 0.05, n = 50, correlation is significant at the 0.05 level (2-tailed); β p < 0.01, n = 50, correlation is significant at the 0.01 level (2-tailed)
The association between the microbiological and immunological data can be found in Table 3. T. denticola, T. forsythia, P. micra and F. nucleatum showed positive correlations with MMP-3 levels.
Discussion
It has been shown previously that the mean MMP-3 values of periodontitis sites are significantly higher compared to healthy sites and MMP-3 expression is probably initiated with bacterial stimuli [10]. The regulation of MMP-3, like the rest of MMPs, is governed by a complex mechanism, e.g. it is induced by molecules such as IL-1β, TNF-α or reduced by COX-2 signaling pathways [11]. MMP-3 is considered to be one of the potential markers of periodontal destruction. Its values in patients with CP or AgP are higher and their increased GCF levels are correlated with the amount of periodontal tissue loss; it appears as high GI, PI, PD and CAL values in both types of periodontitis [12]. Although we can say that it plays a role in extracellular matrix degradation, it is not clear if MMP-3 is expressed more in certain stages of periodontal inflammation [13].
According to our results, MMP-3 levels in patients with AgP are statistically higher compared to the healthy sites of CP and H groups (p < 0.05). This result possibly reflects the inflammatory response complexity and heterogeneity. Regarding the distribution of pathogens across patient groups, as expected, the pathogen levels in AgP patients were the highest, followed by CP and then healthy patients. Unexpectedly, even the healthy sites in AgP patients showed higher levels of pathogens, especially red complex bacteria and F. nucleatum. In brief, all pockets in aggressive periodontitis patients are infected and demonstrate high MMP-3 levels, although the intensity of infection increases with pocket depth. These results are insufficient to explain how this marker influences the manifestation of periodontal disease, because the areas in patients with aggressive periodontitis which do not show any clinical sign of tissue destruction are still infected with periodontal pathogens and express higher MMP-3 values. If we consider previous research that demonstrated MMP-3 and high pathogen levels, especially P. gingivalis, as a prognostic factor for the upcoming tissue loss [10, 14], accordingly we can presume that our currently healthy sites in AgP will be affected in time if not treated properly. Nonetheless, we can assert that MMP-3 is a molecule associated with aggressive periodontitis. The question why different areas in the same individual can demonstrate varied tissue loss is still to be answered.
It has been reported previously that P. gingivalis induced active MMP-3 production and collagen degradation of gingival fibroblasts [15], or the lipooligosaccharide of T. denticola increased MMP-3 mRNA expression [16]. According to our findings, MMP-3 levels are positively correlated with T. forsythia, T. denticola, P. micros and F. nucleatum. If these pathogens directly activate the expression of MMP-3, it is not of interest to this research.
It is known that P. gingivalis, T. forsythia and Prevotella, Fusobacterium, Campylobacter and Treponema levels are higher in patients with periodontitis; and as tissue transitions from healthy to inflamed with periodontitis, increases are observed in the levels of Actinomyces species and the so-called orange and red complex bacteria [17]. T. forsythia, C. recta, and S. noxia are identified as predominant species in active periodontal lesions, and these are the major bacteria which characterize the areas that are transitioning from healthy to diseased [18]. Clinical markers of periodontal disease, especially probing depth, are associated with red complex bacteria. P. gingivalis, T. forsythia and T. denticola have been detected in higher values in deeper pockets, and there is a mutual correlation among all of these bacteria [19, 20]. P. gingivalis can also be detected in healthy sites, but it has been shown that there can be a significant increase in the levels of these bacteria when probing depth values are higher than 4 mm [21]. In addition, C. recta, E. corrodens, T. denticola, T. sokranskii and oral spirochetes coinfect with P. gingivalis [22]. It has been proven that T. denticola counts are higher in the deep pockets of advanced periodontitis patients when compared to counts in healthy individuals or individuals with moderate disease [23]. In a study based on a Turkish sample population, values of all species except P. micra were found to be higher in patients with periodontitis when compared to healthy individuals. The frequency of A. actinomycetemcomitans, P. gingivalis and C. recta were also higher in patients with aggressive periodontitis than in healthy subjects [24]. Our study supports findings that red and orange complex species are directly related to periodontitis and the severity of periodontal lesions. As they demonstrate, C. recta, P. micra and F. nucleatum are positively correlated with probing depth, as are T. forsythia, T. denticola and P. gingivalis.
Due to our research, in the aggressive periodontitis group, it was observed that the three bacteria forming the red complex are positively correlated with each other. For the chronic periodontitis patient sample group, these data include both the red and orange complexes. The orange complex indicates a transition from a healthy profile to a diseased one [25], and there are slower destruction patterns in chronic periodontitis patients exhibiting the orange and red complex when compared to the rapid destruction patterns of aggressive periodontitis patients exhibiting mainly the red complex. Some studies have refuted the idea that A. actinomycetemcomitans is necessary for rapid destruction patterns, since they found that rapid destruction was present in areas where A. actinomycetemcomitans was absent. They found, however, that in those areas, red complex levels were higher than those of healthy individuals, supporting findings that the red complex drives tissue destruction [26, 27, 28]. In accordance with these previous studies, our results indicated that A. actinomycetemcomitans levels of AgP patients are not significantly higher than those of CP or healthy patients.
Conclusions
Our microbiological results correspond to the information that red and orange complex bacteria are involved in bacterial synergy and the severity of periodontitis. Rapid destruction patterns in aggressive periodontitis are linked to red complex bacteria, while in chronic periodontitis there is a slower shift from orange to red complex.
Aggressive periodontitis patients show higher MMP-3 levels compared to periodontally healthy subjects and healthy areas of chronic periodontitis, and T. forsythia, T. denticola, P. micra and F. nucleatum values are positively correlated with MMP-3 levels. Our findings suggest that MMP-3 is a biomarker associated with generalized aggressive periodontitis.