
Hypotension after induction of general anaesthesia can result in perioperative organ hypoperfusion that increases the postoperative morbidity and mortality risks [1]. The hypotension episodes are usually treated by rapid infusion of fluids and administration of vasopressors and inotropes. These interventions may cause an unfavourable increase in the myocardial workload and oxygen needs. The preoperative identification of patients at risk of developing post-induction hypotension could guide an anaesthetist to a preoperative adjustment of the anaesthetic management by decreasing the doses of the induction agents, increasing the amount of pre-anaesthetic fluid loading, and early administration of prophylactic vasopressors [2, 3].
Several indices have been suggested as predictors of possible post-induction hypotension. They are based on either the fluid challenge or heart-lung interactions. Unfortunately, these indices require invasive procedures, the availability of sophisticated equipment, and/or an expert anaesthetist [4–6].
The perfusion index (PI), a parameter derived from the waveform of pulse plethysmography, represents the ratio between pulsatile and non-pulsatile signals. PI represents a basal sympathetic tone, which is believed to be one of the fundamental factors in the post-induction hypotension [7]. Previous studies have demonstrated that PI can be a reliable tool for assessing the vascular tone and can predict hypotension after spinal and general anaesthesia. However, the wide range of cut-off values necessitates performing other studies in this field [8, 9].
The plethysmographic variability index (PVI) is a software program that measures the changes in plethysmographic wave amplitude due to respiratory variations. Previous studies have demonstrated that higher values of the PVI were associated with lower intravascular volumes, which contributed strongly to the development of hypotension. The PVI was previously used as a predictor for post-induction hypotension, but the cut-off values revealed a wide variation, especially when the patients are breathing spontaneously [10–12].
Dicrotic plethysmography (Dicpleth) is derived from the photo-plethysmographic waveform representing a ratio between the relative dicrotic wave height and the peak of the plethysmographic wave. Measurements of Dicpleth have shown similarities to the invasive blood pressure waveform, being similarly influenced by the vascular tone and variations of the arterial compliance [13]. Coutrot et al. [14] demonstrated a strong correlation between the dicrotic notch height of the photo-plethysmographic waveform and the radial invasive blood pressure wave in various hemodynamic situations. However, the sensitivity of Dicpleth, and the possible predictive numerical values are not well studied.
Our study hypothesized that PI and its derived parameters PVI and Dicpleth could be used as good predictors for post-induction hypotension in adults. The primary outcome was the accuracy of PI as a predictor for post-induction hypotension in adults. The secondary outcome was to compare the accuracy of PI to that of the PVI and Dicpleth in the prediction of post-induction hypotension.
METHODS
This prospective cohort study was conducted in Cairo University Hospitals between January and July 2020 after approval of the Kasr-Alainy Faculty of Medicine Ethics Committee, Cairo University (e-mail: kasralainirec@gmail.com, ID: MD-245-2019) and following the guidelines of STARD (Standards for Reporting Diagnostic accuracy studies). The study was registered at clinicaltrials.gov (NCT04217226) before any patient was enrolled. Written informed consent was obtained from all patients.
Ninety-five patients of ASA physical status I and II, aged 18 to 59 years and body mass index (BMI) < 30 kg m–2, scheduled for elective surgery under general anaesthesia were enrolled in the study. Patients with cardiovascular and respiratory disorders, different forms of arrhythmias, peripheral vascular diseases, and long-standing diabetes were excluded from the study. All patients had nothing by mouth 8 hours before surgery and were kept on clear fluids 2 hours before induction of anaesthesia.
Upon arrival at the operating room, intravenous access was secured, and Ringer lactate was started at a rate of 2 mL kg–1 h–1. Premedication in the form of ranitidine 50 mg and ondansetron 4 mg was administered intravenously. Electrocardiography, pulse oximeter and non-invasive blood pressure monitors were attached to the patient, and systolic arterial pressure (SAP), diastolic arterial pressure (DAP), mean arterial pressure (MAP), heart rate (HR) and arterial oxygen saturation (SaO2) were recorded. A Masimo SET (Mighty-Sat 9900, Masimo Corporation, Irvine, CA, USA) was connected to the index finger of the hand contralateral to that used for intravenous access and blood pressure, and was shielded with towels to avoid the effects of ambient light on its signals. The Masimo set was connected to a smart device via Bluetooth, and the plethysmography waveforms were recorded.
Perfusion index, plethysmographic variability index and dicrotic plethysmography
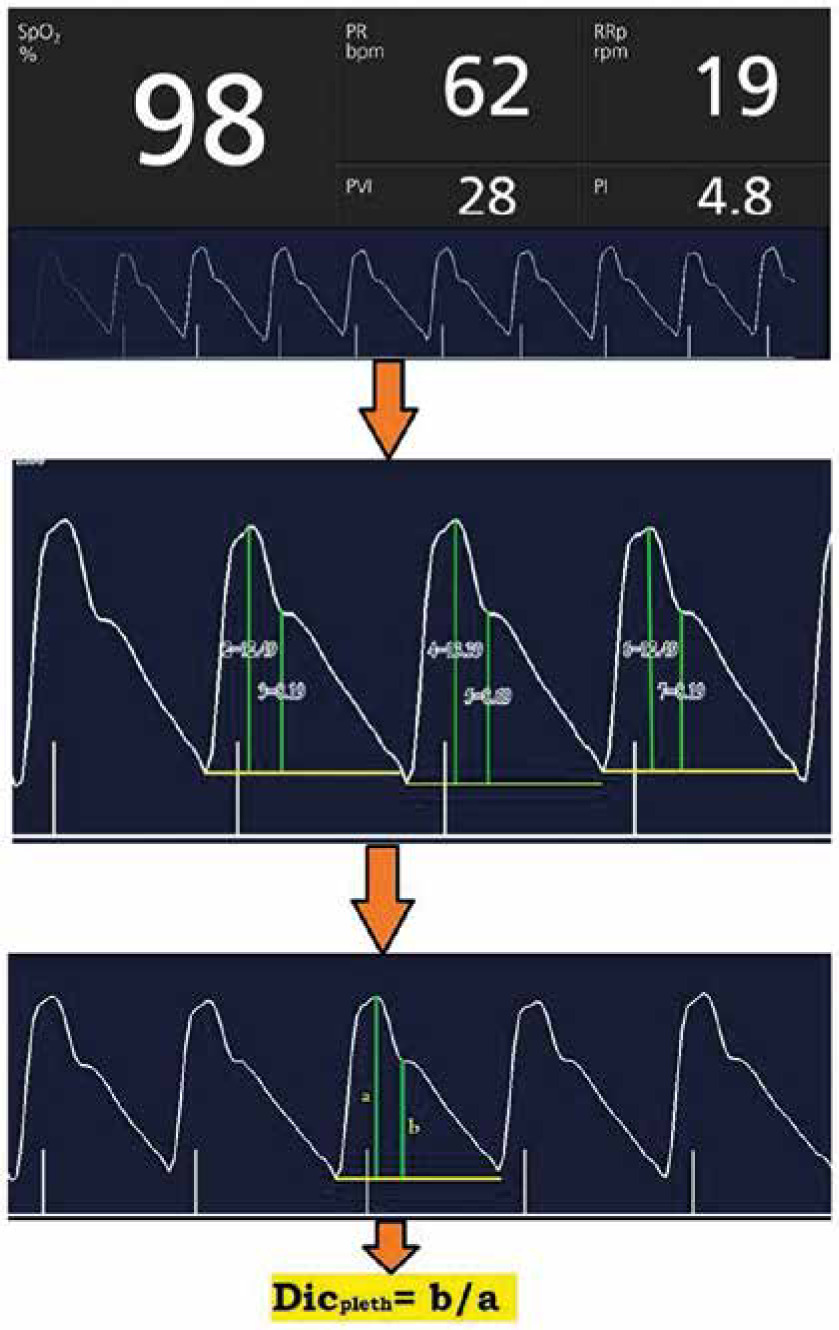
The baseline preoperative PI and PVI were the average of three consecutive readings with one-minute intervals. Dicpleth corresponding to the PI waveforms was computed from the recorded photo- plethysmographic waveforms at the end-expiratory time (determined before anaesthesia induction by allowing patients to rest calmly with regular breathing in the supine position with observation of the respiratory cycle, and after anaesthesia induction by recording readings simultaneously with the ventilator respiratory cycle). The waveforms were recorded on a smart device through the Masimo application (Masimo Professional Health). Screenshots of the waves were taken, and then the displayed curves were analysed, and Dicpleth ratios were calculated using an online photo measuring site [15]. The measures were then revised (using Autodesk AutoCAD 2020) by an expert who was blinded to our study. The final reading was the calculated mean of the three consecutive complexes (Figure 1).
FIGURE 1
Perfusion index (PI), plethysmographic variability index (PVI) and dicrotic plethysmography (Dicpleth) measurement on a real-life photoplethysmography curve. a) Dicrotic notch height, B) systolic peak height. These measurements were performed using the eleif tool (eleif.net/photo_measure.html.). The final reading of the Dicpleth is the calculated mean of three consecutive complexes. SpO2 – oxygen saturation, PR – pulse rate per minute, RRp – respiratory rate per minute
Induction of general anaesthesia was performed intravenously using propofol 1.5–2 mg kg–1 injected slowly at 20 mg every 5 seconds until loss of verbal communication, fentanyl 2 µg kg–1 and atracurium 0.5 mg kg–1. Mask ventilation was maintained for 3 minutes using 100% oxygen during which the HR, SAP, DAP, MAP, PI, and PVI were recorded every minute with a screenshot for the corresponding PI waveform. Patients who experienced difficulty during mask ventilation or intubation were excluded from the study. The lungs were mechanically ventilated using 6–8 mL kg–1 tidal volume (Vt) and 10–12 breath min–1 respiratory rate (RR) to maintain 35–40 mm Hg end-tidal CO2 (EtCO2). Anaesthesia was then maintained using end-expiratory isoflurane of 1.5–2 and 10 mg atracurium increments every 20 minutes.
Any hypotensive episode (defined as a decrease in MAP less than 75% of the preoperative baseline reading) was treated by the administration of 5 µg of norepinephrine. If the hypotensive episode persisted for 2 minutes, another bolus of norepinephrine was administered. Any episode of bradycardia (heart rate < 55 beats min–1) was managed by the administration of 0.1 mg kg–1 of atropine.
The accuracy (the area under the receiver-operating characteristic [AUROC] curve) of the PI as a predictor of post-induction hypotension was set as the primary outcome of this study. The secondary outcomes were: (i) AUROC curve of PVI, Dicpleth, as predictors of post-induction hypotension; (ii) the percentage of the maximum decrease in MAP (measured starting from preoperative reading until surgical stimulation at 1-minute intervals); (iii) the incidence of post-induction hypotension (defined as decrease in MAP less than 75% of the preoperative baseline reading during the period from induction of anaesthesia until surgical stimulation).
Sample size calculation
Power analysis was performed using MedCalc version 18.11 (Mariakerke, Belgium) at the level of sensitivity of the PI in order to diagnose post-induction hypotension using the ROC curve (the primary outcome variable of this study). A pilot study comprising 30 patients yielded an AUROC of 0.7 with a null hypothesis AUROC curve of 0.5, with an incidence of post-induction hypotension standing at 46.7% [16]. Using a 0.9 power and 0.05 a error, a minimum sample size of 84 patients was calculated (with a minimum number of 39 positive cases and 45 negative cases) then the number of the patients was increased to 100 (for dropouts compensation).
Statistical analysis
Using Statistical Package for Social Science (SPSS) software version 25 (Chicago, IL, USA), normally distributed quantitative data were expressed as means and standard deviations (SD). Values of PI, PVI, and Dicpleth were expressed as medians and interquartile ranges (25th; 75th percentiles). Qualitative categorical data were expressed as frequencies or percentages. The Shapiro-Wilk test was used to assess normality of data distribution. Pearson or Spearman’s correlation coefficient was used for correlation tests; the choice was made according to data normality. A P-value < 0.05 was considered statistically significant. Reliability of PI, PVI, and Dicpleth as predictors of post-induction hypotension was determined by constructing receiver operating characteristic (ROC) curves. For this purpose, binary variables were created (patients who developed post-induction hypotension versus patients who did not). Areas under the ROC curves were used to calculate the ideal cut-off points of PI, PVI, and Dicpleth using the Youden index. Sensitivity, specificity, positive predictive value (PPV), negative predictive value (NPV) as well as 95% confidence intervals were calculated.
RESULTS
One hundred patients were enrolled and 93 completed the study. Five patients did not meet the inclusion criteria and were excluded, and two patients were also excluded due to high variability in the baseline PI readings. Patient characteristics and baseline data are presented in Table 1.
TABLE 1
Demographic data and baseline characteristics (N = 93)
[i] Data of age, body mass, BMI, HR, SAP, DAP and MAP are presented as mean (standard deviation). Data of sex, ASA type of surgery and developed hypotension are presented as number (percentage). Data of PI, PVI and Dicpleth are presented as mean (SD), median (IQR) and range. BMI – body mass index, ASA – American Society of Anesthesiologists, HR – heart rate, SAP – systolic blood pressure, DAP – diastolic blood pressure, MAP – mean arterial pressure, PI – perfusion index, PVI – plethysmographic variability index, Dicpleth – dicrotic plethysmography, SD – standard deviation, IQR – interquartile range
Forty-five patients (48.4%) developed post-induction hypotension with a maximum reduction percentage in the MAP of 32.985% ± 6.1 from the baseline values. The BMI, ASA, and baseline HR, SAP, DAP, and MAP were comparable between those who developed post-induction hypotension and those who did not, with more frequent hypotensive episodes among the female patients (Table 2).
TABLE 2
Comparison of patient characteristics, haemodynamic data, perfusion index, plethysmographic variability index and dicrotic plethysmography between patients with and without hypotension after induction of anaesthesia
[i] Data of age, body mass, BMI, HR, SAP, DAP, MAP, % decrease of MAP and total dose of nor epinephrine are presented as mean (standard deviation). Data of sex and ASA are presented as number (percentage). Data of PI, PVI and Dicpleth are presented as median (IQR). Percentage of MAP decrease = (baseline MAP – lowest MAP) × 100/baseline. * denotes statistical significance. BMI – body mass index, ASA – American Society of Anesthesiologists, HR – heart rate, SAP – systolic blood pressure, DAP – diastolic blood pressure, MAP – mean arterial pressure, PI – perfusion index, PVI – plethysmographic variability index, Dicpleth – dicrotic plethysmography
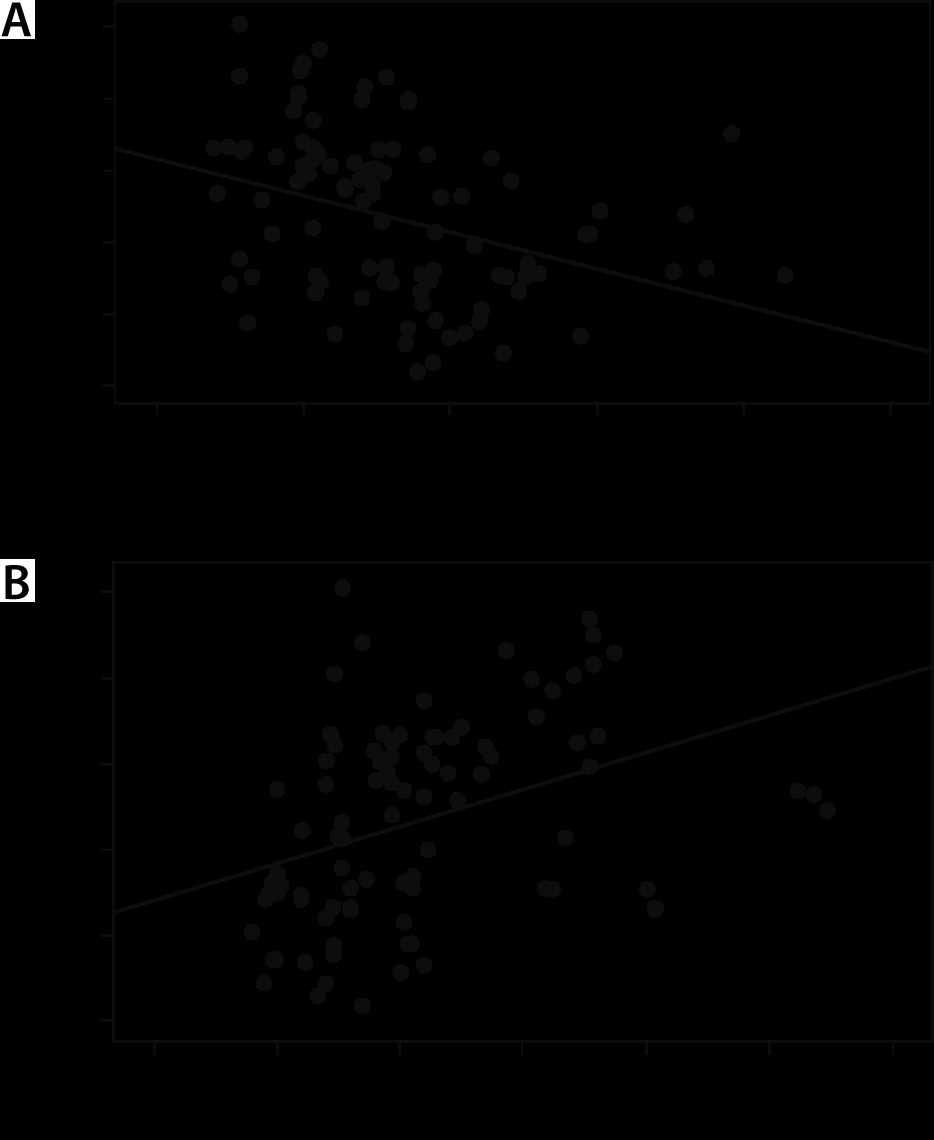
The percent reduction in the MAP after induction of anaesthesia was correlated with patients’ demographic and the baseline data. It was found that the percent reduction in the MAP after induction of anaesthesia was moderately correlated with the baseline PI (r = –0.45, P < 0.001) and PVI (r = 0.45, P = 0.001) (Figure 2) and weakly correlated with the baseline Dicpleth (r = 0.16, P = 0.12).
FIGURE 2
Correlation between baseline perfusion index (PI), plethysmographic variability index (PVI) and the percentage decrease in mean arterial pressure (MAP) after induction of anaesthesia. Percentage decrease in MAP = (baseline MAP – lowest MAP) × 100/baseline MAP. The solid line represents the linear regression line
The patients who developed post-induction hypotension revealed significantly lower baseline PI and higher baseline PVI and Dicpleth than those who did not (Table 2). After induction of general anaesthesia, the PI was maintained significantly lower and the PVI was maintained significantly higher in hypotensive patients than in non-hypotensive patients, which was maintained until skin incision (Table 2).
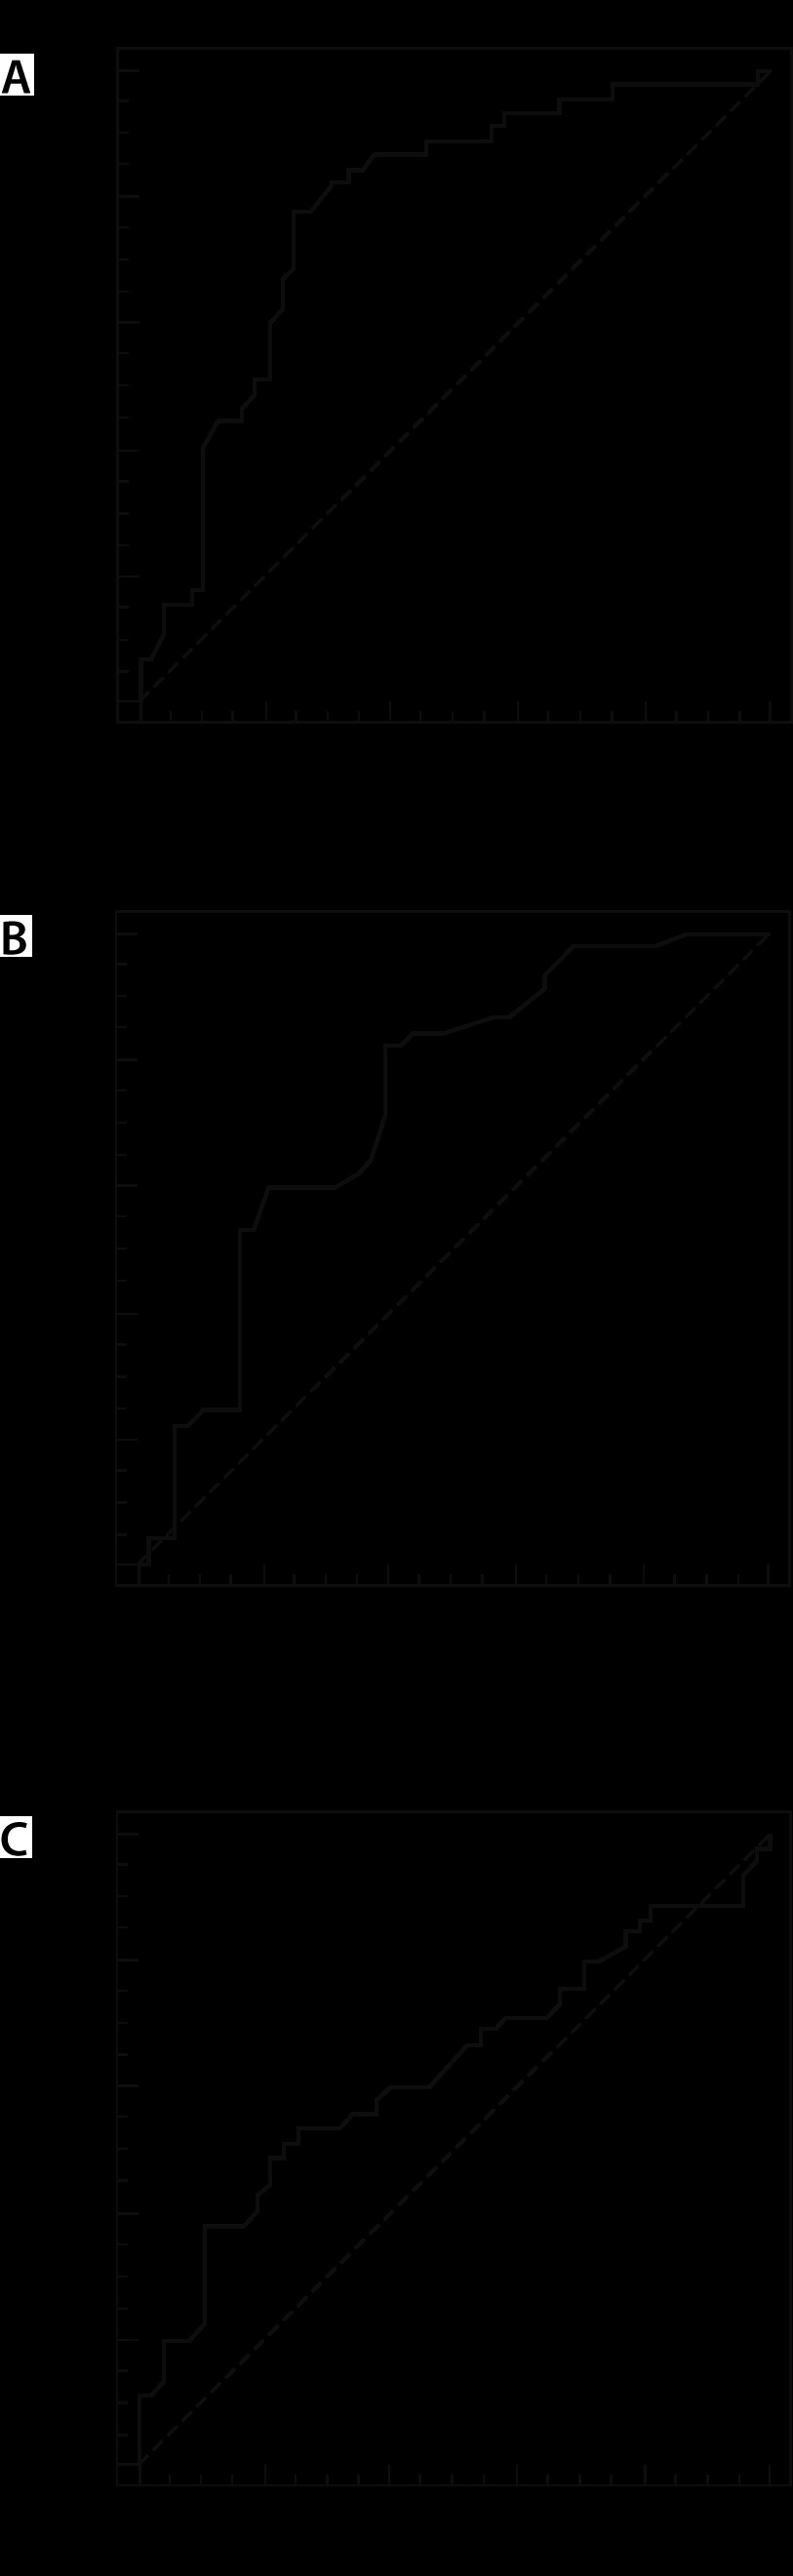
According to those who developed post-induction hypotension and those who did not, PI, PVI, and Dicpleth were used to construct the ROC curve to test their ability to predict those at risk of developing post-induction hypotension (Figure 3). The AUROC curve, sensitivity, specificity, PPV and NPV, and the cut-off values are shown in Table 3. The PI, and PVI revealed a moderate predictive ability for the development of the post-induction hypotension with AUROC curve of 0.78 and 0.73 respectively, with a sensitivity of 77.8, 82.2%, specificity of 75, 58.3%, PPV 74.5, 66.1 and NPV78.3, 77.8 respectively.
TABLE 3
Receiver operating characteristics analysis for predicting decreased mean arterial blood pressure during anaesthesia induction
DISCUSSION
The main finding of this study was a significant correlation between the preoperative PI and PVI values and the percentage decrease in MAP after induction of general anaesthesia. ROC analysis revealed that both PI and PVI have a good predictive ability of post-induction hypotension when their baseline values are < 3.03 and > 17 respectively. In contrast, the baseline Dicpleth measurements showed a significant correlation with the percentage decrease in the MAP with a poor predictive ability of post-induction hypotension.
Post-induction hypotension is a common side effect of general anaesthesia. There are many reported definitions in the literature depending on either the absolute values of the baseline MAP and/or SAP or the percentage of their changes after induction of anaesthesia compared to baseline values. These previous studies varied regarding the actual period of time that any decrease in arterial blood pressure would be considered post-induction hypotension, which made comparing our data with their results difficult [16–18].
In our study, post-induction hypotension was defined as an MAP of less than 75% of the preoperative values during the period from induction of anaesthesia until skin incision [8]. This period was designed to abolish any confounding factors of surgical stimulation, patient positioning and/or blood loss. MAP was chosen for comparisons, being the most important parameter in relation to the degree of organ perfusion. Many studies have demonstrated that intraoperative reduction of MAP is a major factor for postoperative cardiac, renal or neurological adverse outcomes after either cardiac surgery or noncardiac surgery [19–21].
The sympatholytic effect of general anaesthesia results in hypotension. This could be profound with propofol induction, especially in geriatric patients, pre-anaesthesia hypovolemia, pre-anaesthesia MAP below 70 mm Hg, and ASA class higher than III [16–18]. Propofol also produces dose-dependent hypotension through its direct sympatholytic effect, endothelium-dependent, and endothelium-independent pathways, causing peripheral vasodilation. These changes can be monitored by using the PI [22, 23].
The PI represents the resultant of two components. The first is the vascular tone, as the PI reflects the balance between the sympathetic and parasympathetic tone, resulting in dynamic changes of the peripheral vascular tone. PI increases with vasodilation and decreases with vasoconstriction [24]. The second is the stroke volume, as PI represents the local blood volume variation during systole and varies according to the systemic and local hemodynamic status. Van Genderen et al. [25] demon-strated the ability of PI to predict hypovolemia before the onset of cardiovascular decompensation through decreasing the blood volume in spontaneously breathing volunteers. This revealed that PI is influenced by the local vascular tone as well as the stroke volume (SV) variation.
The positive relationship between PI and SV can be proved by PI variations induced by changing the body position. The highest values of PI were observed in the Trendelenburg position while the lowest were observed in the sitting position [26]. Additionally, another recent study found a significant correlation between the cardiac index and PI variations after passive leg raising and fluid challenge [27].
Therefore, high vascular tone and/or low stroke volume result in low PI, as was observed in the hypotensive group of our study. Hence, with general anaesthesia-induced sympathectomy and vasodilatation, hypotension can happen in such patients. This was evident by the increased PI after induction of anaesthesia, with a significant increase in the differences of the consecutive PI values compared to baseline preoperative values. In contrast, patients who had not developed post-induction hypotension had higher preoperative PI due to the low vascular tone and/or the high SV. Therefore, the effect of sympathetic block could be lower in patients with high preoperative PI compared to those with low preoperative PI. This is probably due to vasodilation that is compensated with a relatively higher blood volume [24–27].
On the other hand, there seems to be a different mechanism underlying spinal anaesthesia-induced hypotension. A previous study reported a high predictive ability with a high sensitivity and specificity (AUC = 0.866, P = 0.0003) of the baseline PI when used to predict spinal anaesthesia-induced hypotension during caesarean delivery [8]. The authors reported a baseline PI cut-off value of > 3.5. This higher PI value could be explained by the low sympathetic tone and systemic vascular resistance and increased total blood volume and cardiac output in pregnant females. That, in turn, led to a reduction in PI (not being included in the sympathetic block area) with hypotension after the administration of spinal anaesthesia due to compensatory vasoconstriction in non-anaesthetized dermatomes. Another explanation is inferior vena cava compression by the uterus, limiting the ability to increase its venous return in response to sympathetic blockade. Therefore, patients with an already low sympathetic tone (high PI at baseline) will not be able to increase their stroke volume and therefore develop hypotension compare to patients with low PI at baseline (suggesting high vascular tone).
The PVI is a dynamic method for the assessment of volume status. It reflects variations in PI during one or more complete respiratory cycles through estimation of the respiratory variations in amplitude of the pulse oximeter wave. Therefore, its reliability is related to the extent of peripheral perfusion and the cardiopulmonary interaction during each respiratory cycle. This makes it difficult to assess PVI in spontaneously breathing patients due to high variability in respiratory rates and tidal volumes [12]. However, patients resting calmly in the supine position with regular breathing would allow for more favourable clinical circumstances that would minimize the effects of the aforementioned variabilities on the values of the PVI [28].
Hypovolaemia is associated with a higher incidence of post-induction hypotension which is usually masked by sympathetic stimulation due to preoperative anxiety. This could result in “normalization” of the preoperative arterial blood pressure. Therefore, high PVI can predict the development of post-induction hypotension [28]. Our findings revealed that patients with baseline PVI > 17 were more likely to develop post-induction hypotension with non-significant changes in the PVI after induction of anaesthesia.
As in the case with PI, Dicpleth reflects the degree of arterial compliance and vascular tone. In our study, baseline Dicpleth was correlated significantly with the percentage decrease in the MAP. Baseline preoperative Dicpleth was higher in patients who developed hypotension compared to patients who did not, albeit without statistical significance.
The changes in plethysmographic wave contour are strongly related to the ventricular-vascular interactions and affect arterial compliance in a similar manner to the pulse pressure waves [29]. At the aortic level, the aortic wave’s dicrotic notch represents the aortic valve’s elastic recoil during its closure at end-systolic pressure, which is affected by the vascular tone and hence is correlated with MAP [30].
Tusman et al. [31] studied the performance of the contour of the class of photo-plethysmographic waveforms by visual inspection. They found a strong correlation between it and the invasive arterial wave. Wave amplitudes decreased during hypertensive episodes and increased during hypotensive episodes when compared to baseline values, with downward displacements of the aortic notch, reaching flat or negative positions in cases of severe vasodilation. This downward displacement of the dicrotic notch can be explained by increasing the compliance of the blood vessels during hypotensive episodes, delaying the backward wave to late diastole and consequently increasing the values of Dicpleth.
In a study by Coutrot et al. [14], the authors reported a strong positive correlation between the changes in Dicpleth and changes in MAP during hypotensive episodes that coincide with the induction of anaesthesia. They found a 19% decrease in Dicpleth with the episodes of hypotension, a finding in agreement with the results of our study. Also, the accuracy of the dicrotic notch height as a predictor of the deviation in the MAP values was confirmed by another study which proved the feasibility of MAP beat-to-beat monitoring using the dicrotic notch height [32]. The numerical values of Dicpleth seem to be promising data and need to be further investigated during episodes of hypotension and hypertension. Moreover, these numerical values could be used for monitoring for the degree of vasodilation or vasoconstriction and the response to the vasoactive drugs.
This study has a limitation: we included adults aged 18 to 59 years, so the results cannot be extrapolated to the elderly, who are more vulnerable to the hemodynamic changes due to increased stiffness of the vascular tone, higher ASA status, and likelihood of long-term use of different cardiovascular medications. Another limitation is that our patients were undergoing elective surgery; further studies are recommended including trauma and patients undergoing emergency procedures.
Recommendations: 1) for the clinical implementation, further studies are needed to assess the validity of combined PVI and Dicpleth as simple non-invasive tools in the diagnosis of the aetiology of intraoperative hypotension and the choice of the specific management either by using fluid challenge or vasopressors rather than their empirical use. 2) We recommend incorporating the technology of automatic photo-plethysmographic measurements to display numerical values of Dicpleth in the pulse oximeter devices. This would facilitate data acquisition and analysis in different circumstances during anaesthesia. We also recommend comparing the reliability of photo-plethysmographic variables with other validated predictors of post-induction hypotension, such as inferior vena cava diameters.
CONCLUSIONS
The pre-anaesthetic PI and PVI < 3.03 and > 17 respectively have a good ability to predict those at risk of developing post-induction hypotension in adult patients undergoing elective surgery under general anaesthesia. Future studies are needed in order to investigate the usefulness of Dicpleth in different circumstances during anaesthesia.