Introduction
The hallmark of early atherogenesis (eAg), atherosclerosis, is a disease responsible for the contribution to macrophage cholesterol accumulation, and it leads to oxidation of low-density lipoproteins and hence is responsible for cellular accumulation of cholesterol and oxysterols. However, the driving force of atherosclerosis is thought to be inflammation [1, 2]. The reduction in cardiovascular events is directly proportional to the reduction of inflammation due to the respective reduction in high-sensitive C-reactive protein [3, 4]. Thus, the importance of the role of residual inflammation risk in atherosclerosis has been established.
It is a well-established fact that association of enhanced aortitis, enhanced cardiovascular risk, and enhanced incidence of early cardiovascular events with psoriasis, a chronic inflammatory skin disorder, plays an essential role in the study of eAg [5–8]. Hence the activity and importance of chronic inflammation in eAg in vivo can be studied with the help of psoriatic patients.
Aortitis is considered as a pathological term that refers to the presence of modification in inflammation with respect to the aortic wall. The infectious and non-infectious causes can be easily distinguished by the pattern of aortic involvement and imaging. Inflammatory aortic diseases have been evaluated by various imaging modalities and resulted in the terms of aortic lumen evaluation or aortic wall modifications. Besides, aortitis may occur idiopathically [9] as well as in a number of rare rheumatological and infectious diseases, and in atherosclerosis. However, as per clinical criteria, almost 15% of the aorta may be affected during the process [10].
Traditionally, angiography has been used for imaging purpose for the detection of luminal abnormalities, but its usage has several limitations, which is why multidetector computed tomography is considered as a replacement for conventional angiography. In this background, aortitis studies by 18F fluorodeoxyglucose positron emission tomography (18F-FDG PET) came into action, and so far it has not been explored up to the mark in the last decade [11, 12]. Recently, usage of 18F-FDG PET/CT has been explored in the field of rheumatology [13]. Association of aortitis with activity of pro-inflammatory CD-68 macrophages within the arterial wall has been previously demonstrated by 18F-FDG PET [14]. In this way, there is association between aortitis and improvement in cardiovascular risk prediction [15] along with its responsive nature for risk-modifying agents like statins and anti-inflammatory therapies [16–19]. Association between aortitis and coronary artery disease has been demonstrated in terms of association between aortitis and high-risk coronary plaque (HrCP) morphology [20].
Coronary angiographic computed tomographic study (CACTS) is an essential imaging instrument for the analysis of plaques of coronary arteries [21] because it can quantify even the load of coronary artery disease [22–25]. Non-calcified atherosclerotic plaque load (NcAPL) assessed by CACTS has been demonstrated to affiliate with thin cap fibroatheroma [26] and is enhanced in psoriatic patients [24]. Recently, association between non-alcoholic fatty liver disease with cardiovascular disease and subclinical atherosclerosis has been established [27]. As per our knowledge, association of aortitis with coronary plaque characteristics has not been demonstrated so far. Herein, we used a cohort study of patients with psoriasis using 18F-FDG PET and CACTS so that we could analyse the association between aortitis and CACTS-based assessments of coronary angiographic indices like total coronary plaque load (TCPL) and NcAPL, luminal stenosis atherosclerosis (LSA), and HrCP features.
Material and methods
Study design
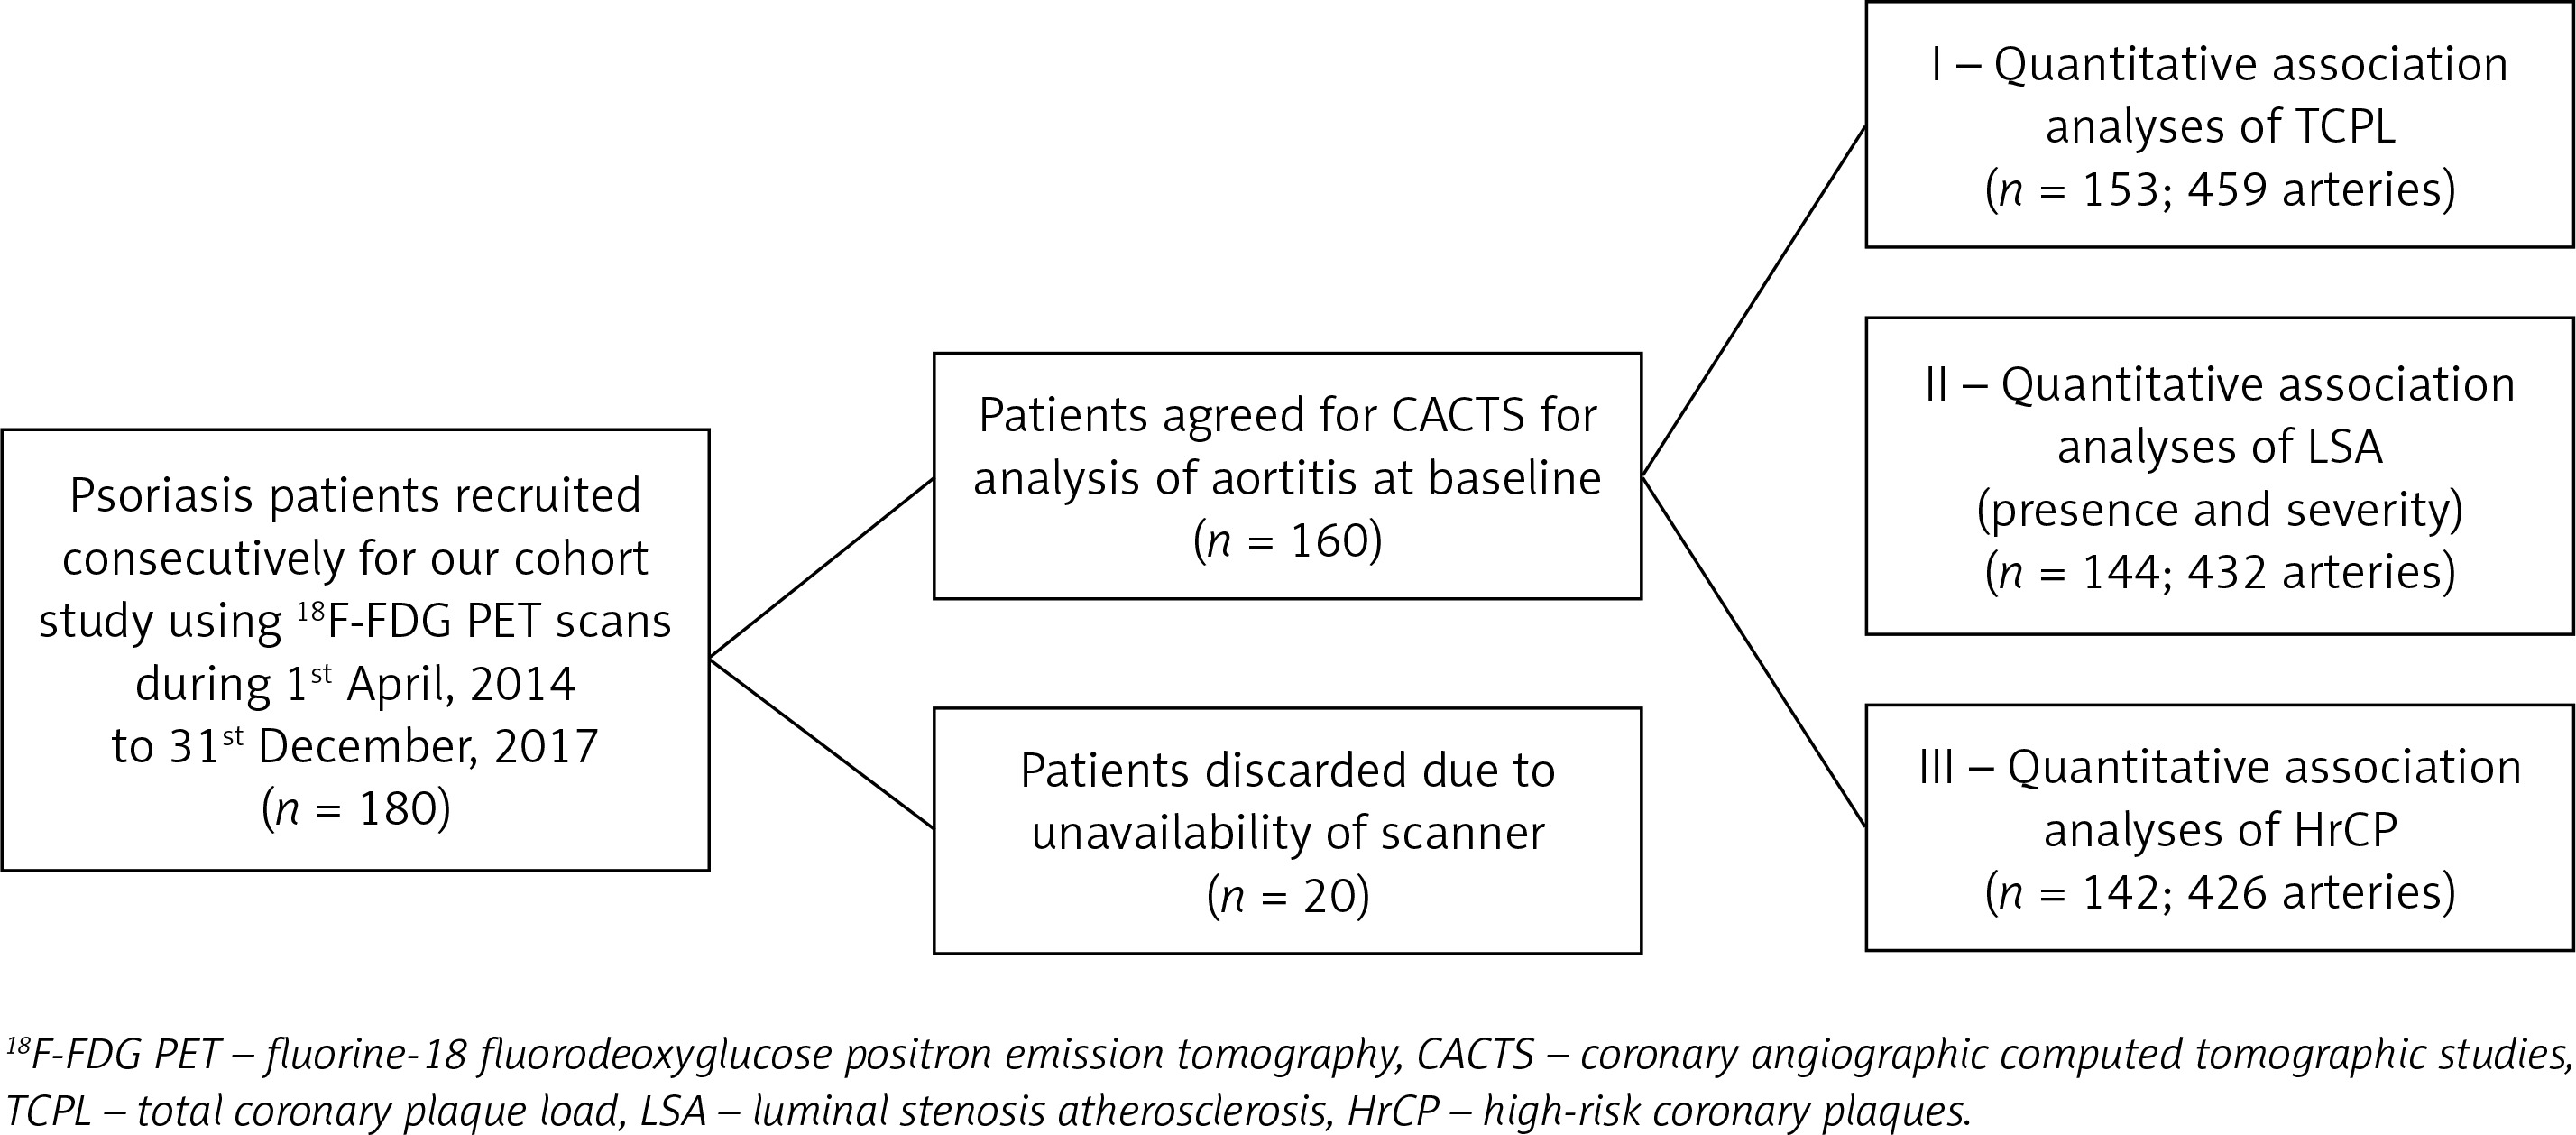
The institutional review board of our hospital reviewed and approved our study (IRB Grant No: 2019-104). Written, informed consent was obtained from each of the enrolled participants before their inclusion in our study. A study cohort of consecutive psoriatic patients (n = 180) was designed in such a way that those subjects were recruited between 1 April 2014 and 31 December 2017 for 18F-FDG PET analysis. All participants were older than 18 years. Psoriatic patients underwent formal diagnosis of plaque psoriasis before inclusion in the study. The severity of psoriasis was assessed for all the patients and measured as psoriasis area severity index (PASI) score. Two characteristics of patients, such as pregnancy and lactation in female patients, were taken as exclusion criteria. Out of these subjects, 20 subjects were unable to appear on specific visit dates and hence could not participate in CACTS. Thus, a total of 160 patients were subjected to CACTS (Figure 1). Furthermore, a total of 153 scans (459 arteries) out of these 160 subjects were found to be explicable and hence were included in the final quantitative analysis of plaque loads. Additionally, for LSA and HrCP analyses, respectively, 144 patients (432 arteries) and 142 patients (426 arteries) were available.
Analysis of aortitis by 18FDG PET
All patients (after an overnight fast) were subjected to 18FDG PET scans followed by their reading blindly with respect to patient characteristics and imaging time point. As per previous reports [8, 27], we used a devoted PET analysis program (Extended Brilliance Workspace; Phillips Healthcare) for the analysis of obtained images so that we could quantify aortitis in terms of target-to-background ratio (TBR). We followed a common protocol as we took images 60 min after administration of 10 mCi 18FDG. Similarly, we scanned each patient cranially to caudally and from the vertex to the toes after keeping standard bed positions of three minutes. Uptake of 18FDG in the aortic wall was measured by taking 1.5 mm thick axial slices of aorta. A PET 64-slice scanner (Siemens Medical Solutions USA, Malvern, PA, USA) was used for recording the images. We took two measures of required features by keeping areas of interest in the entire aorta. For background purposes, we placed similar regions of interest on 10 contiguous superior vena cava slices and took the mean. For each aortic slice the maximal standardised uptake value was divided by the average venous mean standardised uptake value and then the average was taken and it was used as the target-to-background ratio.
Assessment of coronary angiographic indices
We performed additional scans for coronary angiography (320-detector row volumetric scanner, Aquilion ONE ViSION or Genesis) for only those psoriatic patients who were interested in doing so. Scans were performed with a 100–120 kV tube voltage with tube current keeping a gantry rotation time of 275 ms. If the heart rate was greater than 70 beats per minute, then an oral beta-blocker was administered. We kept a slice thickness of 0.5 mm (with slice interval of 0.25 mm) for image acquisition. As in the previous report [23], we used dedicated software QAngio CT (Medis) and evaluated TCPL across three major epicardial coronary arteries. Each of the major coronary arteries was subjected to semi-automated segmentation. Transverse reconstructed cross-sections were assessed at increments of 0.5 mm whenever manual calibration was required for review. Indices with respect to CACTS, i.e. TCPL and NcAPL were evaluated by division of total plaque volume with total length and hence were given in units of mm2. Furthermore, for LSA analysis, clinical reading outcomes were used. Stenosis severity was categorised as per previous reports’ guidelines [28–30]. A condition such as a plaque with positive remodelling (positively remodelled plaque (PRP)) (index > 1.1) and/or the presence of LAP (< 30 units), which resulted during analyses of all the coronary segments, was considered as the presence of HrCP [31]. Both the aforementioned conditions were scored for each artery according to its presence in that particular artery. We added LAP and PRP scores to yield an HrCP score. However, the addition of both the scores leads to a high-risk plaque score. All the scores were further verified by intra-class and inter-class correlation analyses, and 95% and 94% coefficient values, respectively, were found.
Assessment of traditional cardiovascular factors
Analysis of several traditional cardiovascular factors such as high- and low-density lipoprotein cholesterol, along with other clinical features (as shown in Table I), were performed for all the patients. As per previous reports [32, 33], homeostasis model assessment of insulin resistance as well as Framingham 10-year risk score were calculated. A survey-based questionnaire with respect to several demographic parameters and history (as shown in Table I) and previously established diagnoses of hypertension and diabetes was also performed for each patient.
Table I
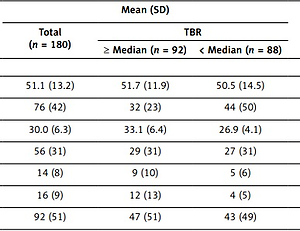
Baseline characteristics of the patients with respect to severity of aortitis
[i] SD – standard deviation, TBR – target-to-background ratio, LDL – low-density lipoprotein, HDL – high-density lipoprotein, SBP – systolic blood pressure, eAg – early atherogenesis, HOMA-IR – homeostasis model assessment of insulin resistance, HSCRP – high-sensitivity C-reactive protein, PASI – psoriasis area severity index.
Statistical analysis
The association between aortitis and eAg was examined by performing multivariable linear regressions on CACTS indices scores. For this purpose, continuous data were reported as mean ± SD for parametric variables and as median with interquartile range for the created patient groups. Student’s t-tests were used for comparisons between stratified groups for parametric continuous data, and for non-parametric data we used Mann-Whitney U-tests. For comparison of categorical variables we used Pearson’s χ2 tests. The association between aortitis by 18FDG PET-derived target-to-background ratios (TBR) and TCPL and NcAPL, calibrating for confounding covariates, was then evaluated on the basis of multivariable linear regression analyses. These analyses were reported in terms of standardised β-values, defined as change in SD in the outcome variables (i.e. TCPL and NcAPL) divided by change in SD in the input exposure (aortitis) and in p-values. Also, association between aortitis and LSA as well as HrCP were examined by performing multivariable logistic regressions, while association between aortitis and LSA severity was examined by performing ordered logistic regressions. Brant and likelihood-ratio tests were used as post-estimation tests. For all logistic regression analyses, we reported only those odds ratios (ORs) which have 95% confidence intervals. For all statistical analyses we used STATA version 12 (StataCorp, College Station, TX, USA), p < 0.05.
Results
Study population characteristics
The characteristics of our study population at baseline are summarised in Table I. We included 180 middle-aged psoriatic patients (76 women, 42%) (mean [SD] age, 51.1 [13.2] years) having moderate skin disease severity (index) PASI score (interquartile range [IQR], 3–10; median, 5.4). We kept the median psoriasis duration at exactly two decades. The mean (SD) body mass index (BMI) was 30.0 ([6.3]), which indicated the overweight profiles of the psoriatic patients. We had near-normal lipid profiles for the patients, but still we got a high prevalence of dyslipidaemia (51%), having total cholesterol of 179 (38.1) mg/dl and low-density lipoprotein cholesterol of 101.9 (30.9) mg/dl. Hence around 29% of patients in our study population (52 patients) were receiving lipid-lowering therapy at baseline. Despite of low prevalence of type 2 diabetes (9%) enhancement in insulin resistance in psoriatic patients was observed, and it was reported in terms of homeostatic model assessment insulin resistance (IQR, 1.8–4.9; median 3.1). Risk for cardiovascular disease due to eAg was very low in these psoriatic patients (10-year risk; IQR, 0.8–5.8; median, 2.3). Moreover, aortitis was high in these patients at baseline (TBR, 1.69 [0.25]; mean [SD]). The NcAPL (mean [SD], 1.12 [0.47] mm2) composed the TCPL (mean [SD], 1.16 [0.45] mm2). More than 26% LSA was observed in 69 patients (207 arteries) of 144 (432 arteries) evaluated. Also, prevalent HrCP was observed in at least one major artery in 48 patients of 142 evaluated.
Association between aortitis and coronary angiographic indices
In order to assess whether coronary results were congruent to the TBR, we observed psoriatic patients with TBR at the median or higher value, with those with TBR at less than the median value. Interestingly, both lower-than-median (mean [SD], 1.56 [0.11]) and higher-than-median (mean [SD], 1.92 [0.25]) TBRs had similar age but were less dominated with female composition (44 of 88 [50%] vs. 32 of 92 [35%], respectively; p = 0.001) (Table I). However, they had lower high-density lipoprotein cholesterol (mean [SD], 63.1 [18.8] mg/dl vs. 50.2 [14.1] mg/dl; p < 0.001) and greater BMI value (mean [SD], 26.9 [4.1] vs. 33.1 [6.4]; p < 0.001). They had low eAg 10-year risk, but even then, the greater TBR value group had enhanced eAg risk in comparison to the lower TBR subgroup (3.7; IQR, 1.8–8.1 vs. 1.8; IQR, 0.9–4.1; p < 0.001). Greater TBR value patients had enhanced high-sensitivity C-reactive protein concomitant levels, insulin resistance levels, and psoriasis severity, in spite of having similar psoriatic duration.
Comparison of coronary angiographic computed tomographic studies-based features
The greater TBR value group (mean [SD], 1.29 [0.46] vs. 0.95 [0.36]; p < 0.001) had enhanced TCPL values but appeared secondary to enhanced NcAPL (mean [SD], 1.26 [0.45] vs. 0.89 [0.35]; p < 0.001) (Table II). There was no significant difference in dense-calcified load values for these groups (mean [SD], 0.03 [0.10] vs. 0.03 [0.07]; p = 0.62). In comparison to patients with TBR lower than median, patients with greater TBR values had enhanced number of LSA with at least one major artery (40 of 69 [58%] vs. 27 of 75 [36%], respectively; p < 0.001). Patients with greater TBR value had significantly worse LSA severity (p = 0.002). Moreover, greater HrCP prevalence was observed in patients with greater TBR value (44% vs. 24%, p = 0.02). PRP scores for the two subgroups were essentially similar, while difference in LAP scores resulted in significantly different HrCP scores (Table II). When similar analyses were performed for TBR we found that patients with LSA as well as with HrCP had enhanced TBR in comparison to those without LSA and HrCP (Table III).
Table II
Baseline coronary angiographic computed tomographic studies characteristics of our study cohort stratified by median value of early atherogenesis
Table III
Baseline characteristics of our study cohort stratified by luminal stenosis atherosclerosis and high-risk coronary plaques
[i] LSA – luminal stenosis atherosclerosis, HrCP – high-risk coronary plaques, LDL – low-density lipoprotein, HDL – high-density lipoprotein, SBP – systolic blood pressure, eAg – early atherogenesis (10-year risk), HOMA-IR – homeostasis model assessment of insulin resistance, HSCRP – high-sensitivity C-reactive protein, TBR – target-to-background ratio.
Association between aortitis and non-calcified atherosclerotic plaque load, luminal stenosis atherosclerosis, and high-risk coronary plaque features
We found that TCPL (p = 0.46; p < 0.001) and NcAPL (p = 0.47; p < 0.001) both were associated with aortitis and were unaffected by any calibration in other features like age, sex, BMI, etc. (TCPL, β = 0.23; p < 0.001 and NcAPL, β = 0.24; p < 0.001). However, dense-calcified load resulted no such association (detailed data not shown). We found a 20% enhancement in un-calibrated analyses and 10% enhancement in fully calibrated analyses of NcAPL when we enhanced aortitis by just one SD unit. Furthermore, we observed direct association between aortitis and LSA in both un-calibrated (OR = 3.71; 95% CI: 1.84–7.89; p = 0.001) and fully calibrated (OR = 3.38; 95% CI: 1.38–8.19; p = 0.007) analyses (Table IV). However, in the case of LSA severity, we observed analogous results for both the un-calibrated (OR = 4.11; 95% CI: 1.88–8.49; p < 0.001) and fully-calibrated (OR = 3.41; 95% CI: 1.39–7.98; p = 0.006) analyses. We also observed association between enhancement of prevalence of LSA (un-calibrated, 1.36; calibrated, 1.34) and severe LSA (un-calibrated, 1.40; calibrated, 1.34) with unit enhancement of respective SD in both the analyses. Aortitis was also associated with HrCP prevalence (OR = 3.11; 95% CI: 1.51–6.32; p = 0.002), which was retained even after fully calibrated analysis (OR = 2.69; 95% CI: 1.11–6.89; p = 0.03) (Table IV), and with HrCP score in both the analyses (un-calibrated OR = 3.09; 95% CI: 1.54–6.51; p = 0.004 and fully calibrated OR = 2.92; 95% CI: 1.19–7.21; p = 0.02). Finally, we also observed association between aortitis and LAP score (un-calibrated OR = 5.75; 95% CI: 1.88–15.95; p = 0.001 and fully-calibrated OR = 6.29; 95% CI: 1.91–21.32; p = 0.003). On the other hand, PRP score did not show any association with aortitis in both the analyses (un-calibrated OR = 1.51; 95% CI: 0.64–3.58; p = 0.70). Interestingly, HrCP prevalence was enhanced 1.32 times in un-calibrated and 1.29 times in second analyses when we enhance the SD by one unit.
Table IV
Associations between aortitis and luminal stenosis atherosclerosis as well as between aortitis and high-risk coronary plaques (HrCP) and various HrCP scores using coronary angiographic computed tomographic studies
| Model/Values | LSA | HrCP | Various HrCP scores | |||
|---|---|---|---|---|---|---|
| Presence | Severity | Presence | HrCP | LAP | PRP | |
| Un-calibrated: | ||||||
| OR (95% CI) | 3.71 (1.84–7.89) | 4.11 (1.88–8.49) | 3.11 (1.51–6.32) | 3.09 (1.54–6.51) | 5.75 (1.88–15.95) | 1.53 (0.69–3.62) |
| P-value | 0.001 | < 0.001 | 0.002 | 0.004 | 0.001 | 0.39 |
| ΔOR! | 1.36 | 1.40 | 1.32 | 1.35 | 1.55 | 1.12 |
| Calibrated*: | ||||||
| OR (95% CI) | 3.38 (1.38–8.19) | 3.41 (1.39–7.98) | 2.69 (1.11–6.89) | 2.92 (1.19–7.21) | 6.29 (1.91–21.32) | 1.19 (0.51–3.28) |
| P-value | 0.007 | 0.006 | 0.03 | 0.02 | 0.003 | 0.6 |
| ΔOR! | 1.34 | 1.34 | 1.29 | 1.34 | 1.59 | 1.07 |
LSA – luminal stenosis atherosclerosis, HrCP – high-risk coronary plaques, CACTS – coronary angiographic computed tomographic studies, LAP – low-attenuation plaque, PRP – positively-remodelled plaque, OR – odds ratio, CI – confidence interval, ΔOR! – change in odd ratios per unit standard deviation enhancement in target-to-background ratio.
Discussion
We successfully analysed aortitis by 18F-FDG PET and coronary angiographic indices by CACTS, and demonstrated that enhancement in TCPL is predominantly controlled by NcAPL while variation in degrees of aortitis could not affect dense-calcified load. We also found that the extent of coronary angiographic indices, prevalence of LSA and HrCP, more severe LSA, along with quantitative total coronary angiographic load were greater in those with elevated aortitis. Besides, there was strong association between aortitis by 18F-FDG PET and coronary angiographic indices derived from CACTS. Hence, our study will be supporting information for the potential surrogate role of aortitis in eAg.
In spite of well-established usage of 18F-FDG PET as a tool to analyse aortitis, comprehensive evaluation of coronary angiographic indices along with the assessment of eAg and its morphological features are still done by CACTS [21, 25]. Essential prognostic information can be achieved by CACTS-based analysis of LSA [34–36], and CACTS can be utilised in the assessment of future risk of major adverse cardiovascular events by quantification of coronary artery plaques [23]. In recent studies, CACTS has helped scientists to achieve significant prognostic implications by imaging vulnerable coronary plaques [21]. We demonstrated the association between aortitis and TCPL, as well as between aortitis and NcAPL, and found that both were retained even after calibration of traditional risk factors. However, the fact that aortitis may be a marker of early vascular disease [11] is supported by our outcome in which dense-calcified coronary plaque load did not show any association with aortitis.
Additionally, we also established a direct association between aortitis and LSA (in both presence and severity parameters) in major epicardial coronary arteries, and this finally led us to the conclusion that aortitis is a clinically reliable indicator of eAg. Furthermore, direct association between aortitis and HrCP (in prevalence and score) was demonstrated in psoriatic patients. This result was supported by the association between aortitis and LAP. However, association between aortitis and PRP was statistically non-significant. Due to the small absolute value of PRP, interpretation of this result should be made very carefully, and then anyone can get this biologically interesting finding. Thus, association between aortitis and broad coronary angiographic indices was achieved, which predicted the possibility of a surrogate role of aortitis in eAg. Lack of hard cardiovascular outcomes is one major limitation of our work. Also, our study is susceptible to unmeasured confounding as well as to the establishment of casualty due to our small sample size. Furthermore, there are several technical difficulties that need to be taken into account during assessment of coronary inflammation by PET.
We extended our work from a previous but far less novel work in which only aortic arch was used up to entire aorta, along with providing further evidence for an association between aortitis and TCPL, NcAPL, HrCP prevalence, and HrCP subtypes. Our results can be generalised to other inflammatory diseases also, but in the case of longitudinal studies it needs also to be demonstrated in non-inflammatory states.
We can conclude our findings by saying that we established an association between aortitis and broad coronary angiographic indices as well as CACTS-assessed HrCP along with various HrCP scores. In this way, it was shown that the study of aortitis and eAg using 18F-FDG PET by assessing TBR and other cardiovascular risk factors might be a favourable support for the potential surrogate role of aortitis in eAg. These associations should be assessed over longer periods of time and including comparatively large numbers of patients.