Introduction
Atopic dermatitis (AD) is a chronic, relapsing inflammatory skin disease characterized by substantial clinical heterogeneity and complex multifactorial pathogenesis, involving skin barrier dysfunction, immune dysregulation, and environmental factors [1]. Accumulating evidence indicates that Th2-dominant inflammation, keratinocyte barrier impairment, microbial dysbiosis (such as increased Staphylococcus aureus colonization), neuroimmune interactions, and genetic susceptibility (e.g., FLG mutations) collectively contribute to disease development and progression [2]. Patients with moderate-to-severe AD often experience persistent pruritus, extensive eczematous lesions, and recurrent flares, frequently accompanied by sleep disturbance and psychological distress, resulting in substantial impairment of quality of life and social functioning [3]. As AD management has shifted toward mechanism-driven precision therapy, identifying distinct disease phenotypes and achieving individualised treatment have become major clinical challenges.
Dupilumab, a fully human monoclonal antibody targeting the interleukin-4 (IL-4)/IL-13 signalling pathway, effectively suppresses Th2 inflammation and improves skin barrier function, and is now a cornerstone therapy for moderate-to-severe AD. Although dupilumab has demonstrated significant efficacy in improving skin lesions, pruritus, and quality of life [4], treatment response varies considerably across patients. Previous studies have reported that only approximately 40–50% of patients achieve EASI-75 within 3–5 months, while others exhibit delayed, insufficient, or secondary loss of response [5]. This heterogeneity in therapeutic outcomes complicates clinical decision-making and increases economic burden, underscoring the need for reliable tools to identify patients most likely to benefit from dupilumab before treatment initiation.
To address this challenge, increasing studies have leveraged clinical characteristics, serum biomarkers, skin transcriptomic data, microbial data, and integrated multi-omics data to predict the response to dupilumab treatment, but most of them present such deficiencies as limited sample sizes, unsystematic variables, and a reliance on conventional statistical methods failing to capture complex nonlinear relationships. Consequently, the predictive performance and clinical applicability remain suboptimal [6]. Among various candidate indicators, serum periostin, a critical downstream matrix protein of the IL-4/IL-13 signalling axis, is considered a vital molecular marker of Th2-high inflammatory endotype, which is closely implicated in multiple pathological processes like skin barrier repair, fibroblast activation, chronic inflammation, and tissue remodelling [7]. In addition, periostin has exhibited high diagnostic value for asthma, chronic rhinosinusitis with nasal polyps, AD, and other Th2-driven allergic diseases [8, 9], but its independent contribution extent and its complementary relationship with other clinical indicators for forecasting responses to dupilumab treatment have not been systematically appraised.
Aim
Given this, the present study aimed to construct a multivariate prediction model with high discriminative power, good interpretability, and operational practicality by integrating baseline clinical characteristics and Th2-related serum biomarkers, especially periostin, and employing a systematic feature selection process plus multiple machine learning methods. Moreover, rigorous time-independent external validation was introduced in the present study to assess the stability and generalisation ability of the model in real-world clinical settings. It is expected to develop a practical tool for risk stratification and response prediction before initiating dupilumab treatment through the present study, rendering reliable evidence support for the precise management of moderate-to-severe AD.
Material and methods
Study design and subjects
The single-centre, prospective observational cohort study consisted of a modelling phase and an external validation phase. In the modelling phase, 200 adult patients with moderate-to-severe AD who visited our hospital and were initiated on dupilumab treatment from January 2020 to December 2023, and completed at least 16 weeks of follow-up, were enrolled as a modelling cohort, used for feature selection, model training, and internal validation. As to the external validation phase, a total of 60 patients were recruited between January 2024 and December 2024 as a time-independent external validation cohort, used for assessment of model’s temporal generalisation ability and robustness. The present study was conducted as per the Declaration of Helsinki with the informed consent form signed by all subjects and approvals from our hospital ethics committee. Due to the new numbering system for all previous ethics committee approvals, our approval number has been changed into ((2025)L-352).
Sample size estimation
To minimize overfitting and ensure model stability, an events-per-variable (EPV) ratio of approximately 10 was targeted. Thirteen candidate predictors were initially considered, of which 10 were retained after feature selection using Least Absolute Shrinkage and Selection Operator (LASSO) regression. The modelling cohort included 200 patients, providing a sufficient number of events to meet the EPV requirement and aligning with recommended principles for clinical prediction model development and the TRIPOD guidelines [10].
Inclusion and exclusion criteria
Eligible participants were adults (≥ 18 years) diagnosed with atopic dermatitis according to the Hanifin–Rajka criteria [11], with moderate-to-severe disease defined by a baseline EASI score ≥ 16 and an Investigator Global Assessment (IGA) score ≥ 3 [12]. All patients were scheduled to receive standard dupilumab therapy (600 mg loading dose followed by 300 mg every 2 weeks) and had complete baseline clinical and laboratory data with adequate follow-up.
Exclusion criteria included concomitant immune-related diseases, serious infections, or malignancies; recent use of systemic immunosuppressive therapies without adequate washout (cyclosporine, methotrexate, or oral corticosteroids within 4 weeks; JAK inhibitors within 2 weeks); recent topical corticosteroid or calcineurin inhibitor use within 1 week [13]; severe comorbid conditions affecting assessment; or missing key baseline data.
Indicator measurement
Baseline demographic data (age, sex, body mass index, and disease duration) were obtained from medical records. Disease severity was assessed at baseline by trained dermatologists using standardized instruments, including the Eczema Area and Severity Index (EASI), affected body surface area (BSA), Investigator Global Assessment (IGA), Numerical Rating Scale for itch intensity (NRS), and Dermatology Life Quality Index (DLQI) [14].
Fasting peripheral venous blood samples were collected in the early morning prior to dupilumab initiation. Serum periostin levels were measured by enzyme-linked immunosorbent assay (R&D Systems, Minneapolis, MN, USA). Peripheral blood eosinophil counts were determined using an automated haematology analyzer (XN-1000, Sysmex, Japan). Total immunoglobulin E (IgE) concentrations were assessed by chemiluminescence immunoassay (ImmunoCAP, Thermo Fisher Scientific, USA), and serum lactate dehydrogenase (LDH) levels were measured using an automated biochemical analyzer (AU5800, Beckman Coulter, USA). All assays were performed in the same certified laboratory by personnel blinded to study outcomes, following the manufacturers’ instructions.
Data preprocessing and feature selection
Before model development, data integrity was examined, and no missing values were identified for key variables; therefore, no imputation was performed. Continuous variables were standardized using Z-score normalization, with parameters derived from the training cohort and consistently applied to the external validation cohort. Feature selection was conducted using Least Absolute Shrinkage and Selection Operator (LASSO) regression to reduce multicollinearity and overfitting. All 13 candidate variables were entered into the model, and the optimal regularization parameter (λ) was selected through 10-fold cross-validation. Variables with non-zero coefficients were retained, and correlation analysis was subsequently performed to confirm the absence of high collinearity (i.e., |r| < 0.7) before model construction.
Model development and performance assessment
Based on the variables selected by LASSO regression, two categories of prediction models were developed: multivariate logistic regression models and machine learning models. All models were trained using the same modelling cohort and identical preprocessing procedures.
For logistic regression, a full model including periostin and a reduced model excluding periostin were constructed to evaluate the incremental predictive value of periostin. Binary logistic regression was applied, and results were reported as odds ratios (ORs) with 95% confidence intervals (CIs). Model discrimination was assessed using receiver operating characteristic (ROC) curves and the area under the curve (AUC).
For machine learning, Random Forest, eXtreme Gradient Boosting (XGBoost), and Support Vector Machine (SVM) models were developed with and without periostin. Model performance was evaluated using 5-fold stratified cross-validation, with AUC, sensitivity, specificity, accuracy, F1 score, and Youden index reported.
Analysis of model interpretability
To enhance model transparency and interpretability, SHapley Additive exPlanations (SHAP) were applied to the optimal XGBoost model. A SHAP summary plot was generated to illustrate the relative importance of individual features and the direction of their contributions to the predicted probability of treatment response. Higher SHAP values indicate a positive contribution to response prediction, whereas lower values indicate a negative contribution.
External verification
In the external validation phase, the optimal XGBoost model was applied to estimate the probability of treatment response for each patient. Model performance was evaluated using the area under the receiver operating characteristic curve (AUC), sensitivity, specificity, accuracy, F1 score, and the optimal cutoff determined by the Youden index. Model calibration was assessed by comparing predicted probabilities with observed response rates using calibration curves. Decision curve analysis (DCA) was performed to evaluate the net clinical benefit of the model across a range of decision thresholds by comparison with treat-all and treat-none strategies.
Statistical analysis
Python 3.1, primarily such libraries as pandas, numpy, scikit-learn, statsmodels, shap, and matplotlib/seaborn, was employed for statistical analysis. Continuous variables first underwent the Shapiro-Wilk test, and those normally distributed were expressed as mean ± standard deviation and subjected to the independent samples t-test for intergroup comparisons. Categorical variables were expressed as frequencies and percentages and compared by the χ2 test between groups. All tests were two-sided, with p < 0.05 denoting a difference of statistical significance.
Results
Baseline characteristics
Among the 200 patients in the modelling cohort, 125 (62.5%) achieved EASI-75 at week 16 and were classified as responders, while 75 (37.5%) were non-responders. Baseline demographic characteristics, including age, sex, body mass index, and disease duration, were comparable between the two groups (all p > 0.05). Regarding disease severity, baseline EASI scores were slightly lower in responders than in non-responders (p = 0.016), whereas no significant differences were observed for BSA, NRS score, or DLQI. In terms of laboratory indicators, responders exhibited significantly lower baseline serum periostin levels (p < 0.001), eosinophil counts (p = 0.004), and total IgE levels (p = 0.041) compared with non-responders, while LDH levels did not differ significantly between groups (Table 1).
Table 1
Baseline characteristics
LASSO regression for variable selection
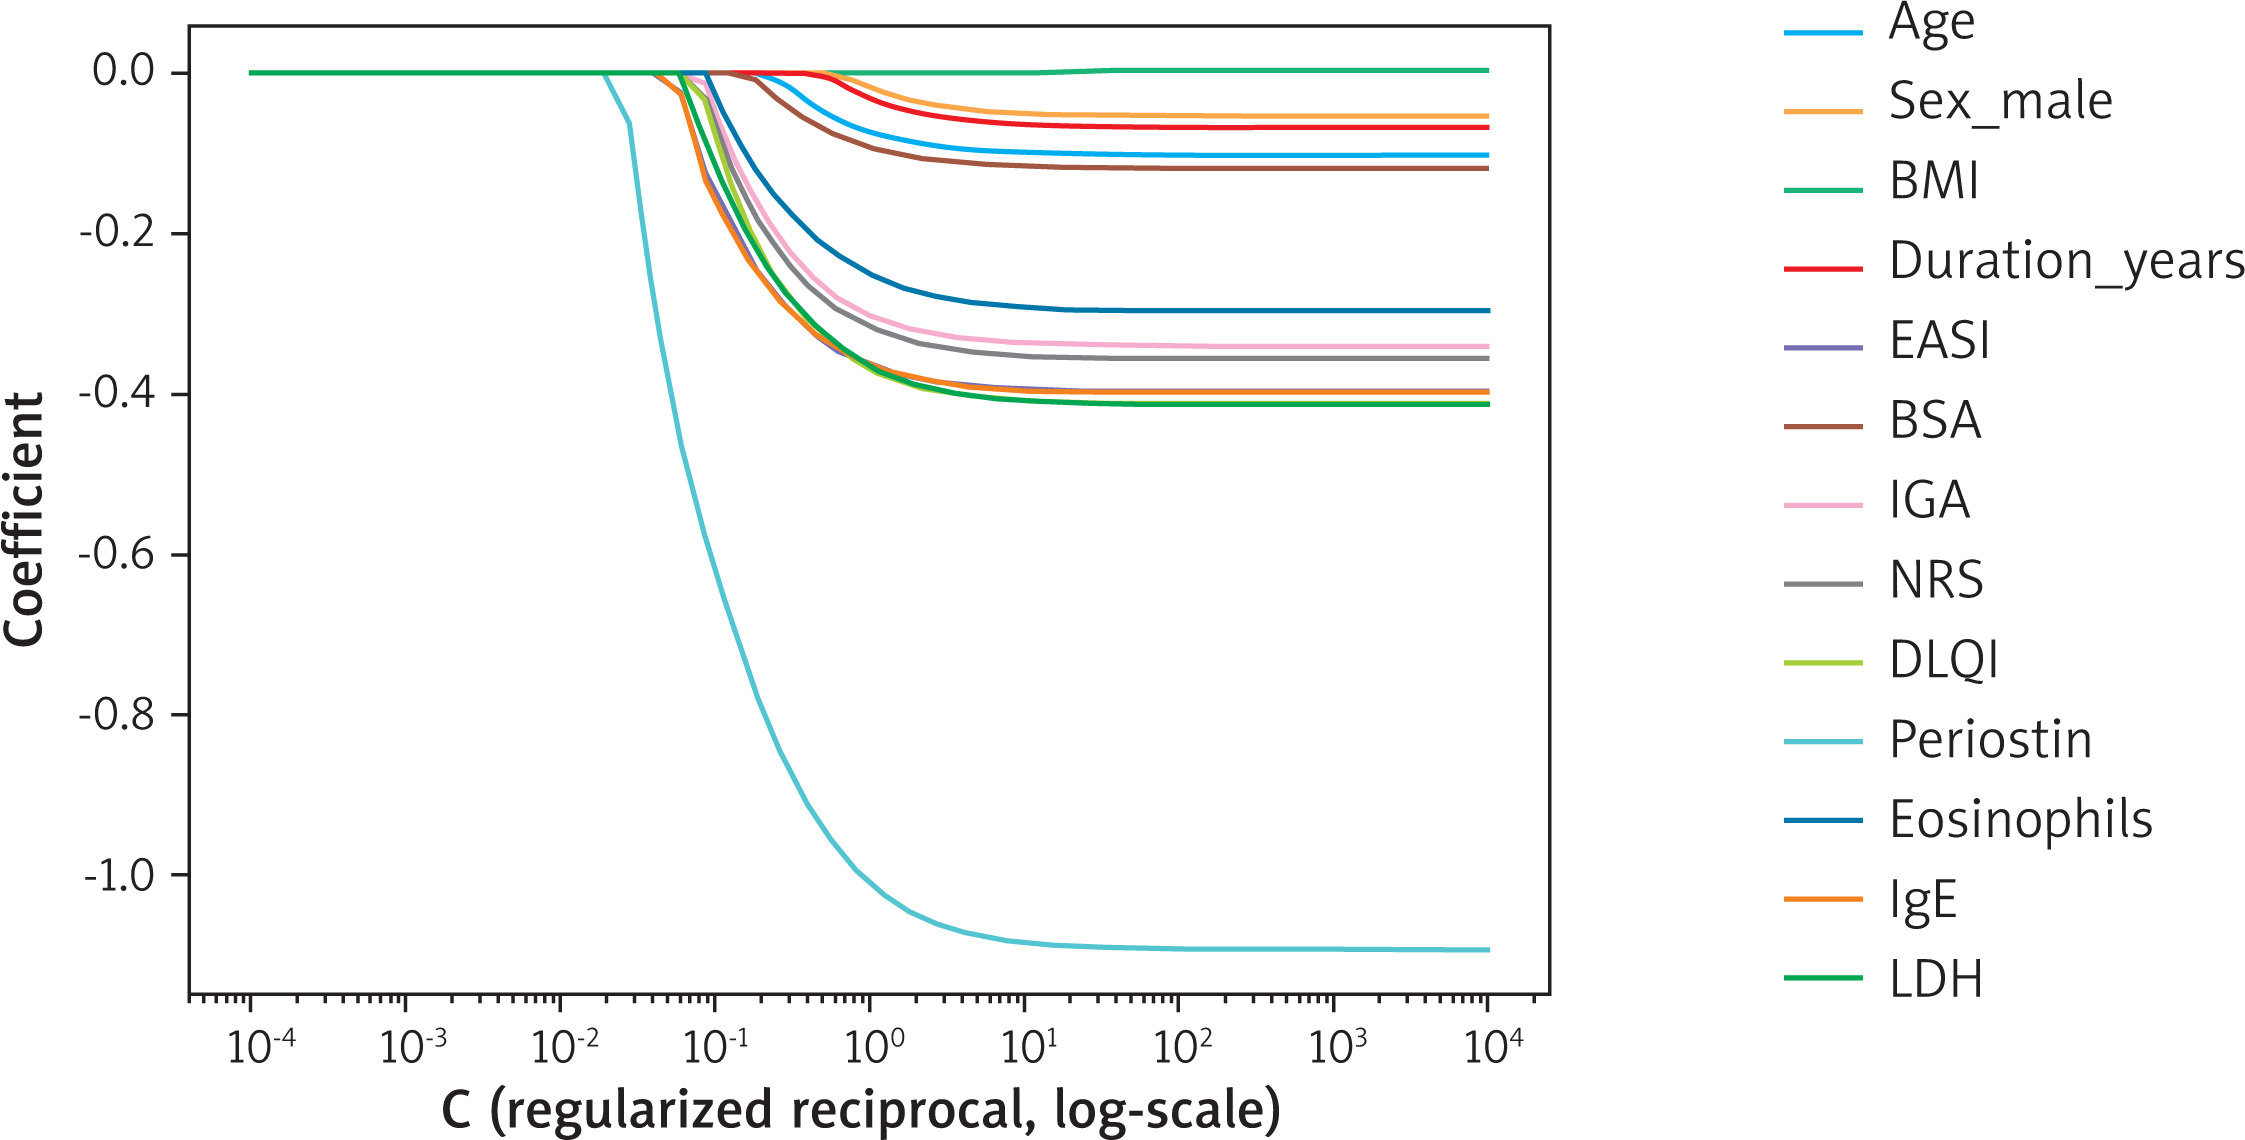
LASSO regression was applied to 13 baseline clinical and laboratory variables to reduce multicollinearity and optimize model generalisability. Using 10-fold cross-validation, the optimal regularization parameter (λ) was selected, resulting in 10 variables with non-zero coefficients: age, EASI, BSA, IGA, NRS, DLQI, periostin, eosinophil count, IgE, and LDH (Figure 1). Among these predictors, periostin showed the largest absolute coefficient (–0.91), indicating the strongest discriminative contribution in distinguishing responders from non-responders. These variables were subsequently used for multivariate logistic regression and machine learning model development.
Performance of multivariate logistic regression models for predicting the response to dupilumab treatment
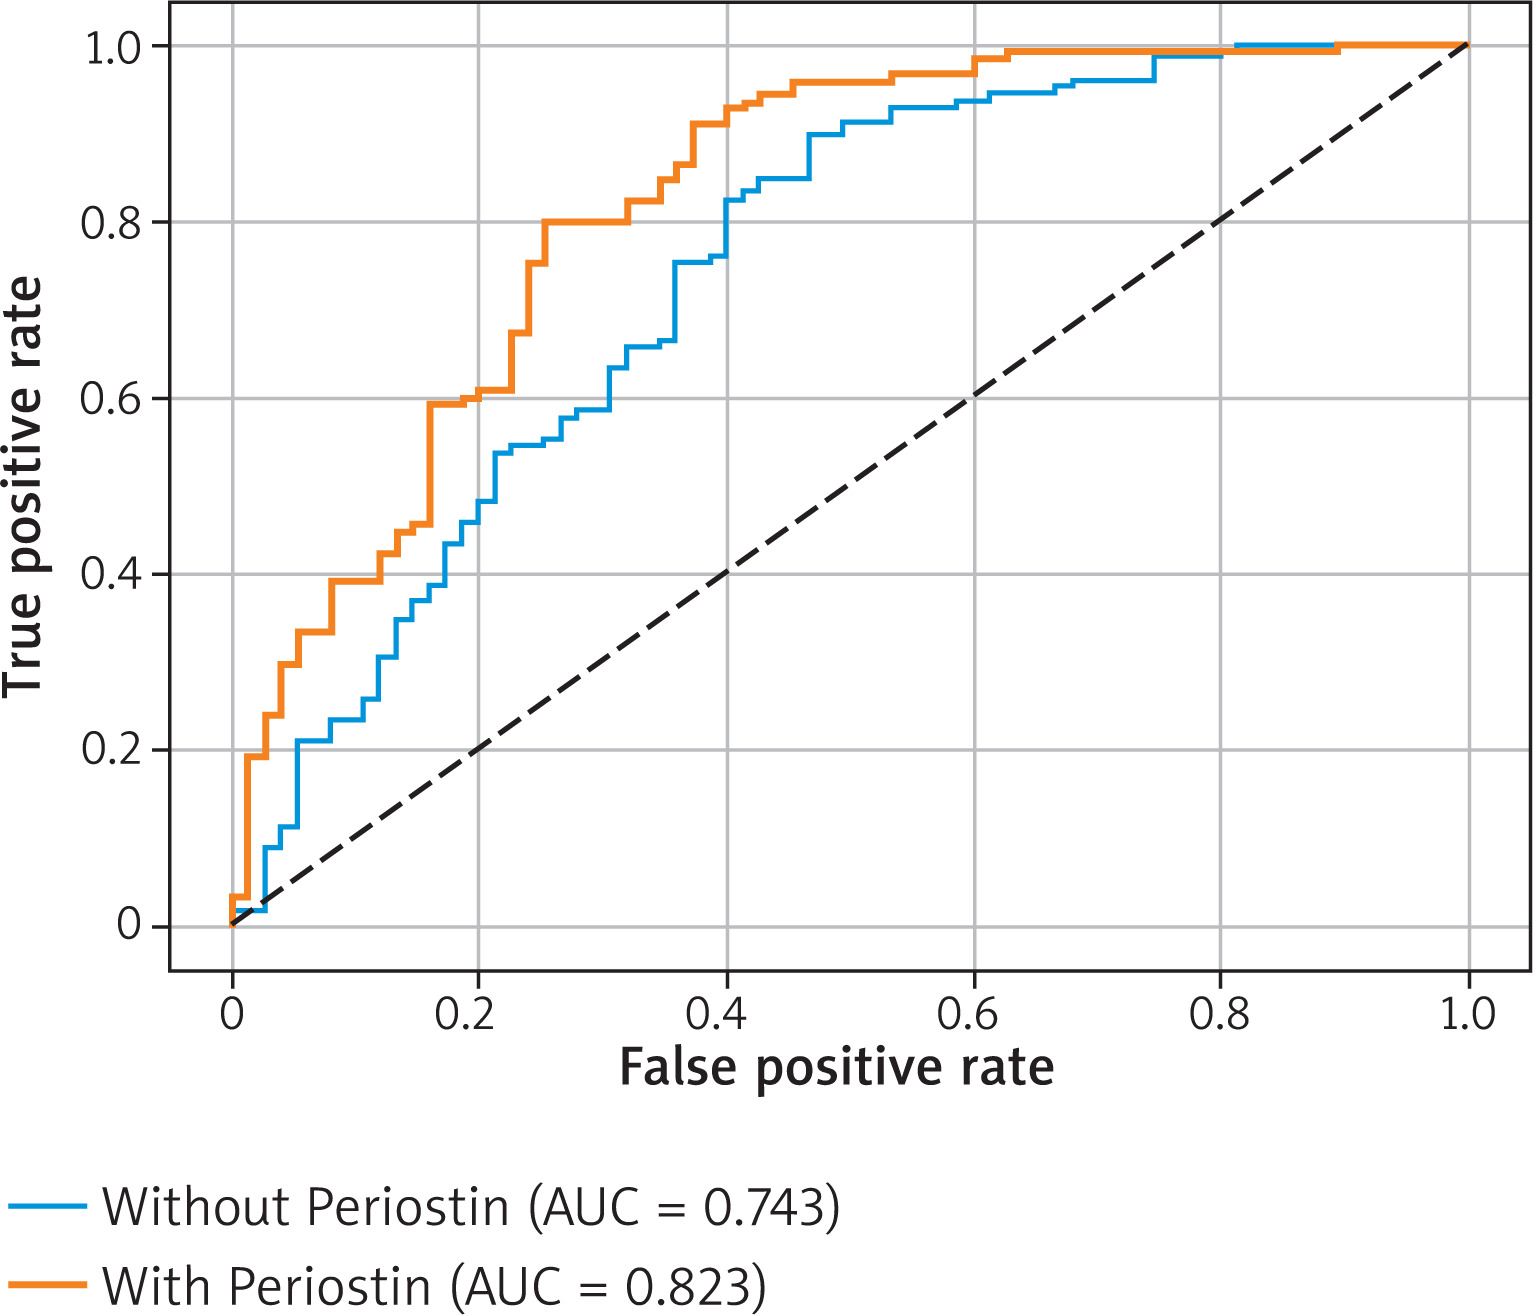
Multivariate logistic regression analyses were conducted to evaluate the independent predictive value of baseline variables for dupilumab response. In the full model incorporating periostin, periostin emerged as the strongest independent predictor (OR = 0.34, 95% CI: 0.22–0.52, p < 0.001), with higher levels associated with a lower probability of achieving EASI-75. Additional significant predictors included baseline EASI (OR = 0.66, p = 0.022), NRS score (OR = 0.70, p = 0.045), DLQI (OR = 0.66, p = 0.029), IgE (OR = 0.68, p = 0.031), and LDH (OR = 0.67, p = 0.034), suggesting that greater disease severity and Th2-related inflammatory burden were associated with poorer treatment response. In contrast, in the model excluding periostin, the overall direction of effects remained consistent, but the statistical significance of several variables decreased, including NRS score (p = 0.098) and eosinophil count (p = 0.094), while IGA score became an independent predictor (OR = 0.71, p = 0.045). Receiver operating characteristic analysis demonstrated superior discriminative performance of the model including periostin compared with the model without periostin (AUC = 0.823 vs. 0.743; Figure 2), indicating a substantial incremental predictive value of periostin in multivariate modelling.
Performance of machine learning models for predicting the response to dupilumab treatment
Random Forest, XGBoost, and Support Vector Machine (SVM) models were developed with and without periostin to compare their ability to predict response to dupilumab treatment. Without periostin, the AUCs of the Random Forest, XGBoost, and SVM models were 0.716, 0.740, and 0.655, respectively, with XGBoost showing the best overall performance (sensitivity 0.865, specificity 0.609, accuracy 0.767, and F1 score 0.821). After incorporating periostin, model discrimination improved across all algorithms, with AUCs increasing to 0.821 for Random Forest, 0.830 for XGBoost, and 0.750 for SVM. The XGBoost model with periostin achieved the highest sensitivity (0.946) and accuracy (0.850), along with improved F1 score and Youden index, indicating superior overall predictive performance. Collectively, models including periostin consistently outperformed their corresponding models without periostin, and the XGBoost model was therefore selected for subsequent analyses (Table 2, Figure 3).
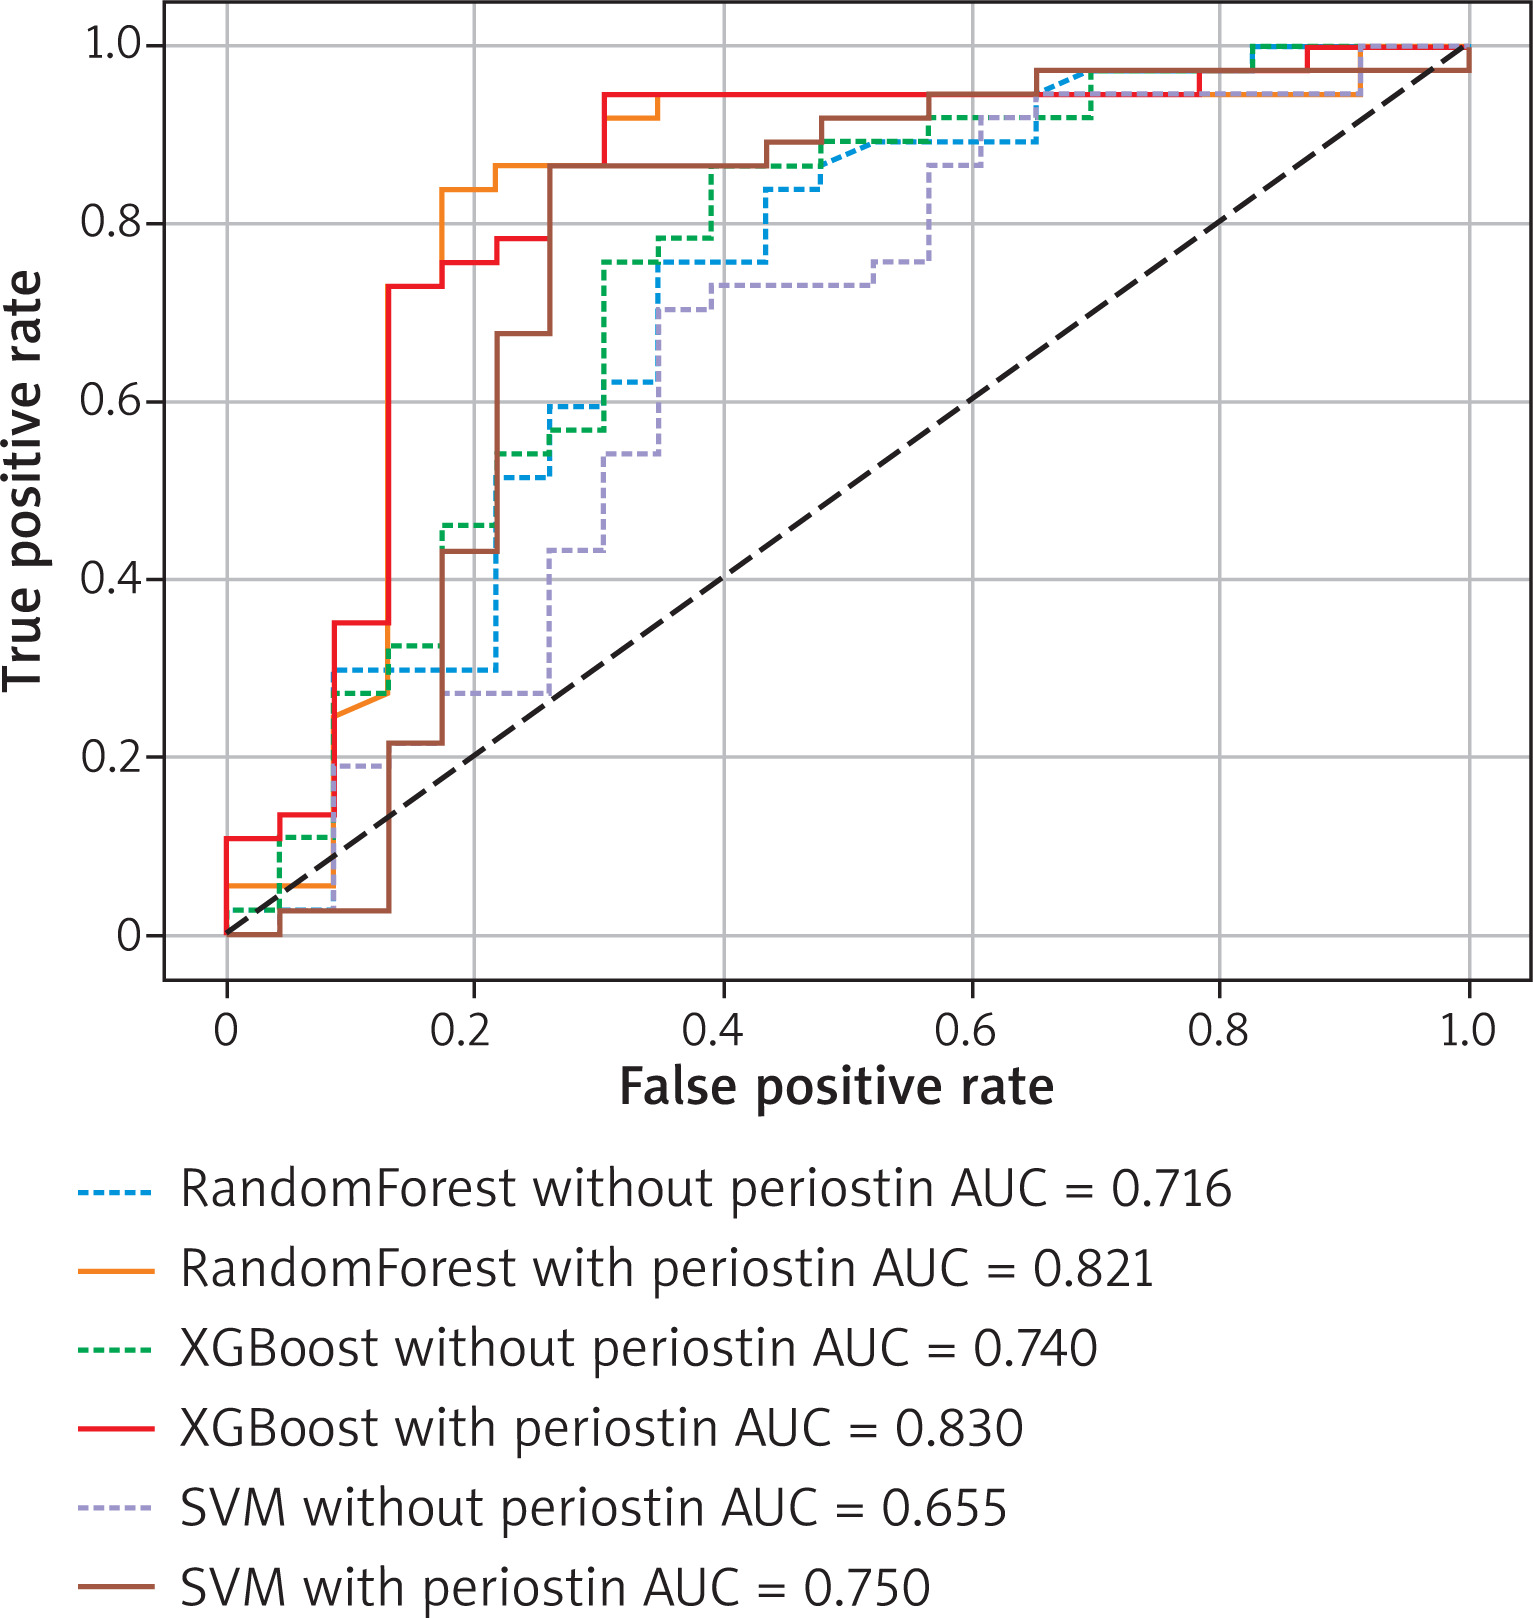
Table 2
Performance parameters of machine learning models for predicting the response to dupilumab treatment
Results of SHAP analysis on the optimal XGBoost model
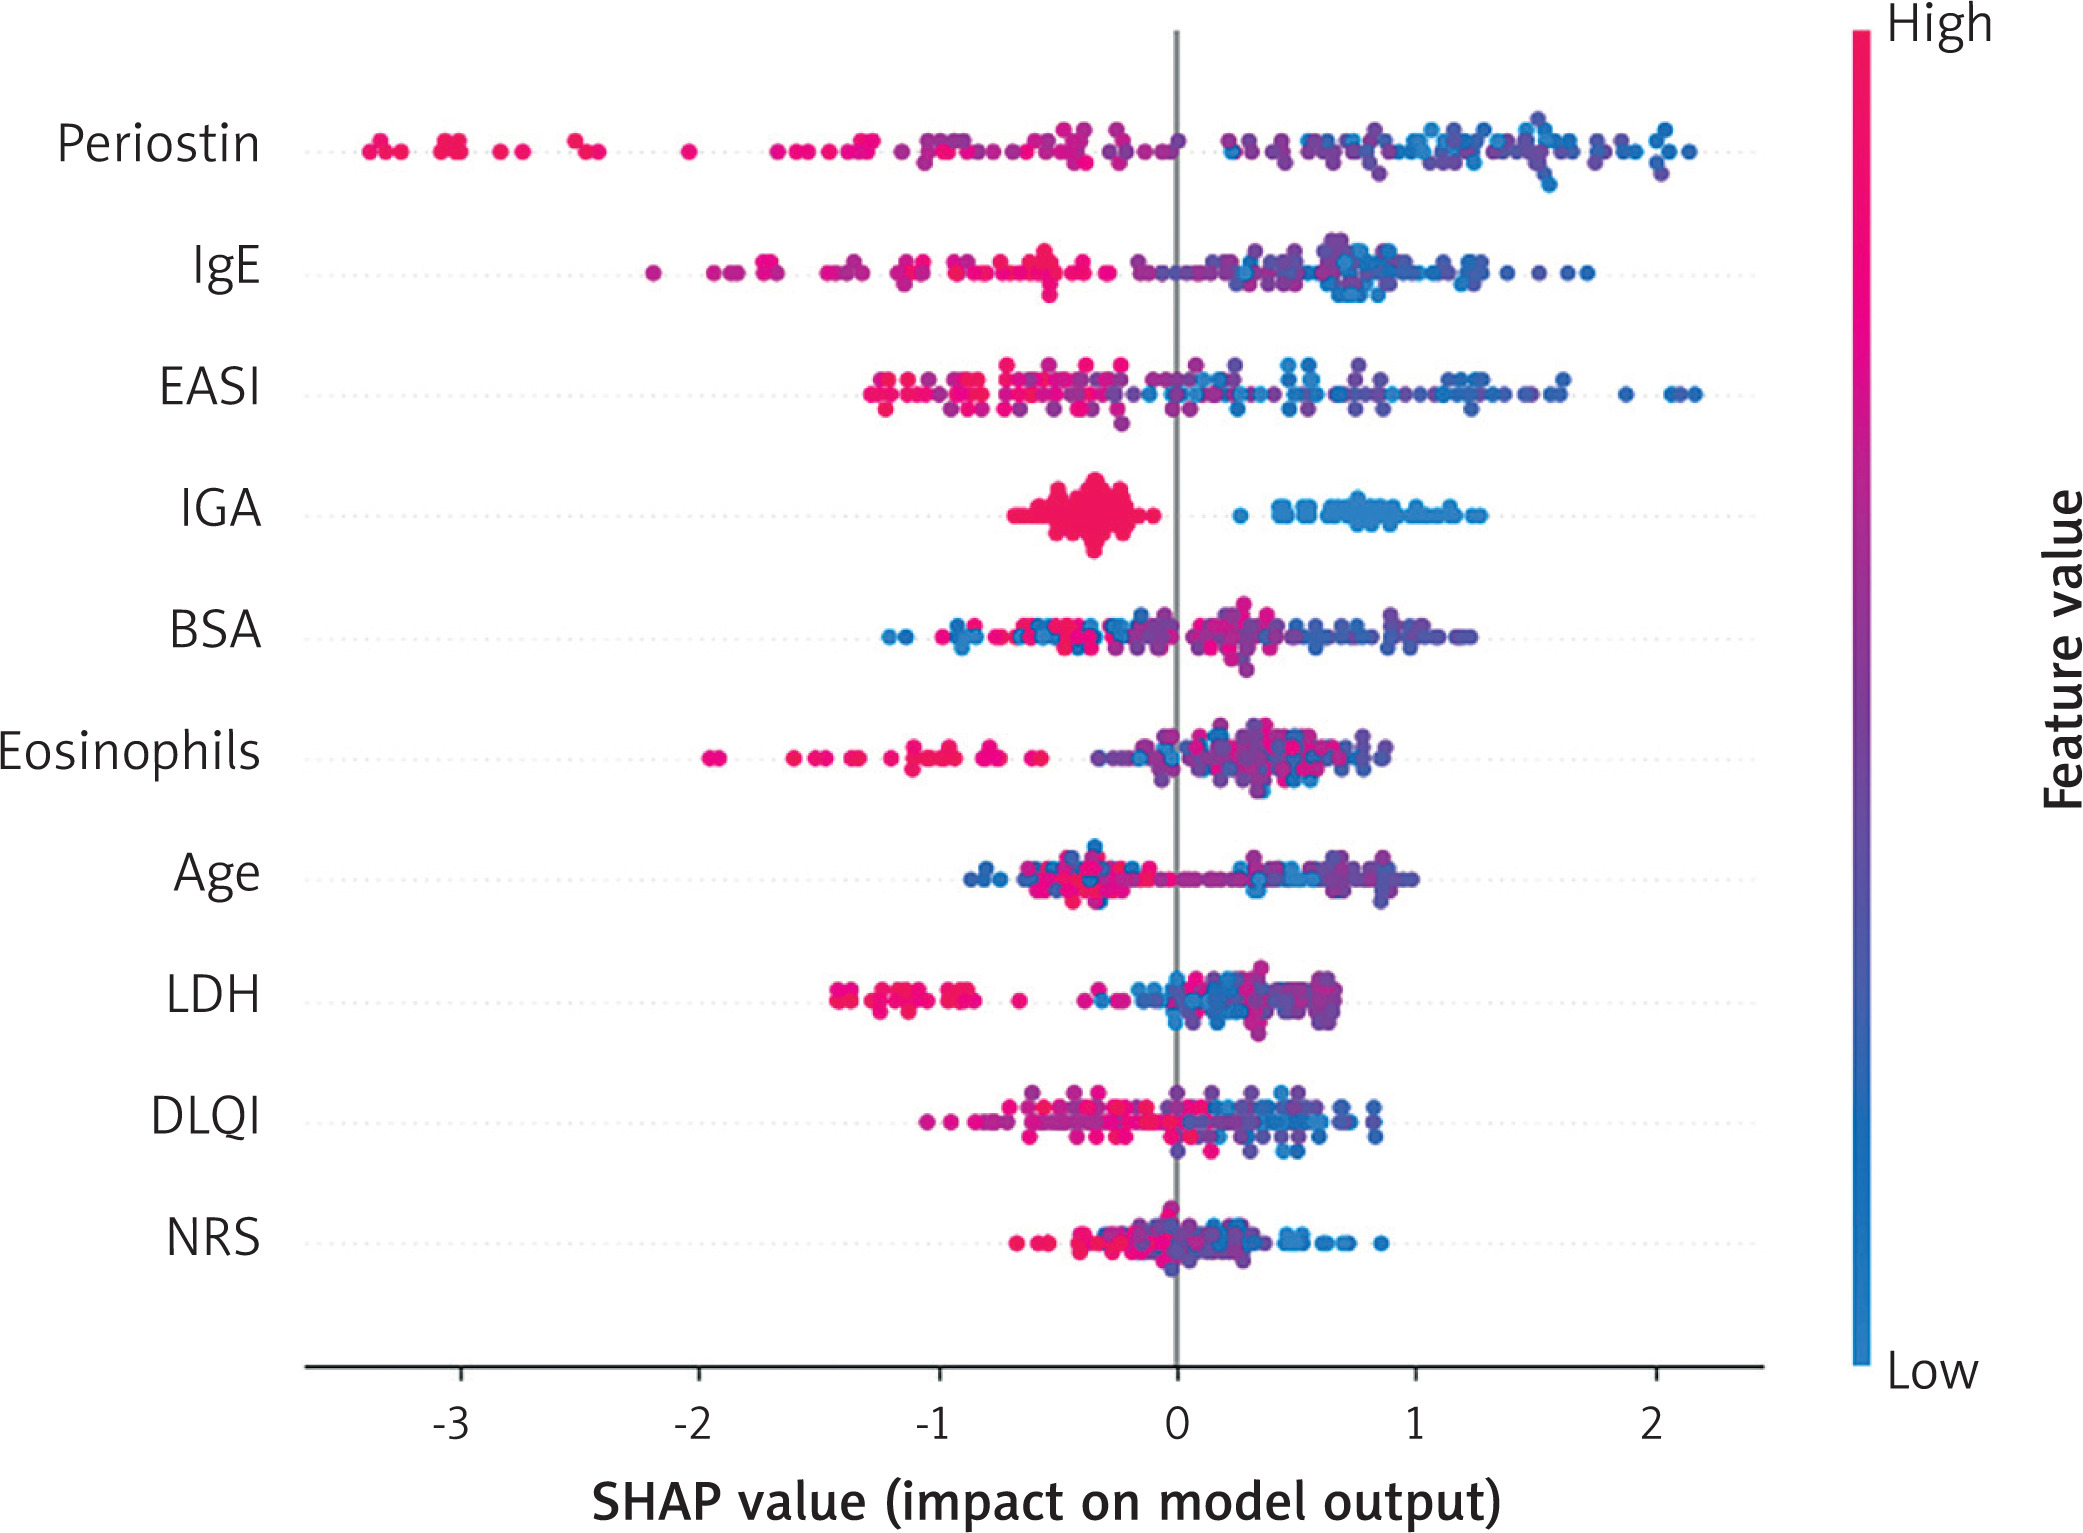
SHAP analysis was performed to interpret the optimal XGBoost model. As shown in the SHAP summary plot (Figure 4), periostin was the most influential predictor, exhibiting the largest SHAP value range. Higher periostin levels were associated with a lower probability of treatment response, whereas lower levels increased the likelihood of achieving EASI-75. IgE, EASI, and IGA also contributed substantially to model predictions, with higher values generally associated with reduced response probability. BSA, eosinophil count, LDH, and DLQI showed moderate contributions consistent with clinical expectations, while age and NRS score had relatively limited influence. Overall, SHAP analysis highlighted periostin as the dominant driver of model predictions and supported the biological plausibility of the model.
Figure 4
SHAP summary plot showing the relative importance and effect direction of each feature in the optimal XGBoost model for predicting the response to dupilumab treatment. Each dot stands for a feature’s SHAP value, and the colour reflects the value of the feature (red for high values, blue for low values). Features are ranked from top to bottom by importance
ROC curves and performance parameters of the optimal XGBoost model for external validation
The optimal XGBoost model was further evaluated in an independent external validation cohort of 60 patients. The model maintained good discriminative ability, achieving an AUC of 0.810 (Supplementary Figure S1), comparable to that observed in the modelling cohort. Using an optimal cutoff value of 0.360 determined by the Youden index, the model yielded an accuracy of 0.783, sensitivity of 0.917, specificity of 0.583, and an F1 score of 0.835. These results indicate robust generalisability and a strong ability of the model to identify responders in an independent population.
Calibration and decision curve analyses in external validation
In the external validation cohort, calibration analysis demonstrated good agreement between predicted and observed response probabilities, particularly in the medium-to-high probability range, with the calibration curve closely aligned with the ideal reference line (Supplementary Figure S2). Minor deviations were observed at the extremes of predicted probability, but the overall calibration error was limited, indicating acceptable accuracy of probability estimation.
Decision curve analysis showed that the optimal XGBoost model provided a higher net clinical benefit than the treat-all and treat-none strategies across a wide range of clinically relevant threshold probabilities (approximately 0.05–0.60; Supplementary Figure S3). These findings suggest that the model may support individualised clinical decision-making by improving responder identification and reducing unnecessary treatment.
Discussion
In this study, we systematically evaluated the predictive value of baseline clinical characteristics and serum biomarkers for dupilumab response in 200 patients with moderate-to-severe atopic dermatitis and developed a multivariable prediction model centred on periostin. Periostin consistently emerged as the strongest predictor across multivariate logistic regression and machine learning models, with lower baseline levels associated with a higher likelihood of achieving EASI-75 at 16 weeks. The optimal XGBoost model demonstrated good discriminative performance in the development cohort (AUC = 0.83) and maintained robust accuracy in a time-independent external validation cohort (AUC = 0.81), supporting the stability and generalisability of the model. These findings indicate that integrating periostin with clinical features and Th2-related biomarkers can enable accurate and interpretable prediction of dupilumab response, providing a practical tool for pre-treatment patient stratification.
Moreover, the key role of the Th2 inflammatory pathway in differential responses to dupilumab treatment was further revealed in the present study at the mechanistic level. As a downstream matrix protein induced by IL-4 and IL-13, periostin is closely related to skin barrier repair, fibroblast activation, and tissue remodelling [15]. High periostin levels not only reflect the intensity of Th2 immune activation, but also denote patient skin lesions with persistent skin structural abnormalities (such as lichenification) and chronic inflammatory states particularly difficult to resolve [16]. Therefore, patients with lower baseline periostin levels potentially present a phenotype dominated by relative early-stage or reversible inflammation and are thus more likely to achieve significant clinical improvement following dupilumab-mediated blockade of IL-4/IL-13 signalling [17]. Similarly, eosinophil count and IgE levels, typical serological markers of systemic Th2 immune activation, reflect disease severity from another dimension [18]. In the present study, both eosinophil count and IgE levels were also significantly lower in the response group than in the non-response group, indicating that non-responders are possibly already in a more intense and widespread Th2 inflammatory state prior to treatment initiation. In the case of high-load inflammation, standard-dose dupilumab may be insufficient to repress overactive pathways rapidly and adequately within the first 16 weeks. As a result, clinical improvements are relatively limited. Previous research has also manifested that dupilumab treatment impedes IgE synthesis in relevant B cell subsets and reduces serum IgE levels, and accordingly, both baseline IgE levels and their variations reflect the overall state of Th2 pathway activity [19]. Notably, SHAP analysis conducted in the present study showed that the abovementioned three indicators were not redundant in the model but provided complementary information from different levels, with IgE reflecting B-cell-mediated allergic reaction, eosinophil count indicating a systemic inflammatory burden, and periostin better capturing features of matrix remodelling and chronic inflammation. The integration of these biological cues from different dimensions enables the model to identify potentially refractory patients more accurately. In addition, the baseline EASI was slightly lower in the response group than in the non-response group, possibly demonstrating that baseline disease activity itself affects efficacy. To mitigate the potential bias from baseline differences, a relative improvement (EASI-75) was employed as the primary endpoint in the present study, and feature selection was performed via LASSO regression before model creation, thus minimizing the effect of baseline inconsistency on predicted results.
Comparison of the results between the present study and previous literature suggests that the construction of machine learning models not only validates the established biological hypotheses, but also enhances their application value in clinic. A previous basic study confirmed that periostin is a key downstream matrix protein of the IL-4/IL-13-mediated Th2 pathway and can serve as a specific biomarker of Th2-high inflammation and tissue remodelling status in allergic diseases [20]. Clinical studies have also manifested that dupilumab treatment can significantly lower the levels of inflammatory markers such as periostin, IgE, and eosinophils [21]. However, the above studies have been largely limited to analysing linear associations between single biomarkers and treatment responses, often failing to capture complex individualisation differences [22]. The present study, on this basis, quantified the core weight of periostin in multidimensional indicators using the feature selection and nonlinear fitting capabilities of XGBoost, a machine learning algorithm. The results revealed that when periostin, together with EASI and IgE, was incorporated into the same nonlinear model, the prediction efficiency could reach an AUC of 0.83, significantly better than that of single indicators. Moreover, existing studies of machine learning for forecasting responses to biologics in AD have predominantly relied on internal cross-validation, lacking rigorous assessment of the model’s generalisability to external populations. In contrast, the present study confirmed model robustness (AUC = 0.81) in the independent cohort over a time span of up to 1 year. This rigorous time-independent validation proves the model’s excellent robustness and generalisation ability across time, thereby ensuring a high degree of predictive reliability.
From a clinical perspective, the prediction model constructed in the present study holds clear clinical translational value. Considering the high cost of dupilumab treatment, identifying patients at high risk for low responses before treatment initiation can effectively prevent resource waste, allowing treatment to be prioritized for those most likely to derive benefits [23]. Moreover, the incorporation of periostin, IgE and eosinophil count endows the model with high operational practicality. Furthermore, the results of SHAP analysis on model interpretability in the present study clearly display the contribution of each variable, enabling physicians to accurately understand the rationale behind the model’s predictions, which is particularly crucial for its clinical acceptance. Additionally, the model can be further leveraged to optimize therapeutic strategies (early planning of combination therapy and increasing of follow-up frequency for high-risk patients for instance).
Despite the relatively clear findings, several limitations should be acknowledged. First, the modelling cohort was derived from a single centre, and although time-independent external validation was performed, multicentre studies across diverse populations are still needed to further confirm generalisability. Second, only baseline clinical and laboratory variables were included; incorporating early dynamic changes in biomarkers such as periostin or eosinophil count may improve prediction of medium- and long-term responses. Third, the models were developed within a traditional machine learning framework, and future studies integrating multimodal data, including imaging, transcriptomic, or microbial features, may further enhance predictive performance. Finally, the model has not yet been prospectively implemented in real-world clinical settings, and further validation is required to assess its practical applicability.
In conclusion, the present study proves the great value of baseline Th2 inflammation-related biomarkers, especially periostin, for predicting early responses to dupilumab treatment in moderate-to-severe AD. The machine learning model integrating clinical characteristics and laboratory indicators exhibits favourable discrimination and robustness, rendering feasible tools and ideas for personalised treatment of AD in the future. The model’s performance and clinical applicability are expected to be further improved with the inclusion of more multicentre data and multi-modal features, thus boosting the development of precision medicine in AD.