
Introduction
International epidemiological studies have revealed geographical variation in the prevalence of allergic rhinitis and asthma. The ISAAC study, involving paediatric populations in over 100 centres in 56 countries, showed 20-fold differences in the prevalence of asthma symptoms and 30-fold differences in the prevalence of allergic rhinitis symptoms [1]. The ECRHS study, targeting populations of young adults in 48 centres of 15 countries, demonstrated considerable differences in the prevalence of asthma [2, 3]. The Epidemiology of Allergic Diseases in Poland (ECAP) study, a country-wide study based on the ECRHS II and ISAAC questionnaires that enrolled respondents from various regions of Poland, revealed the magnitude of this problem in the Polish population, with a mean prevalence of allergic rhinitis of 22.54% [4].
The differences in the prevalence of inhalant allergy are interpreted mainly in terms of considerable environmental differences. Environmental factors that potentially play a role include levels of exposure to inhalant allergens. The ECAP study showed grass and birch pollen as the sources of the most commonly sensitizing outdoor allergens [5]. While the duration and severity of allergy symptoms in sensitized individuals depend on the pollination intensity of the sensitizing taxon [6–13], the available literature does not unequivocally address the question of association between the degree of exposure to pollen in different geographical regions and the rate of sensitization among the respective populations [14–20].
Aim
This study aimed to assess the presence of an association between the prevalence of allergic rhinitis and asthma and the degree of exposure to the pollen of the most sensitizing plant taxa (grasses and birch) in various regions of Poland.
Material and methods
The epidemiological part of our study was part of the ECAP project involving the use of the ECRHS II and ISAAC questionnaires. A total of 20,454 respondents were enrolled in the ECAP; the study group was randomized and stratified based on the PESEL national identification number. The study was conducted via computer-assisted personal interviewing (CAPI) using personal digital assistant (PDA) technology. Completed questionnaires were automatically transferred via General Packet Radio Service (GPRS) to a central unit to form a database. 18,617 questionnaires met the ultimate quality assessment criteria. Of the nine centres where the ECAP study was conducted, four (Wroclaw, Katowice, Warsaw, Bialystok) were included in the present analysis. They were chosen on account of being located in different regions of Poland. Completed questionnaires from a total of 9,443 respondents were analyzed, including 13.9% (n = 1,317) from Wroclaw, 25.8% (n = 2,434) from Katowice, 24.2% (n = 2,281) from Warsaw and 36.1% (n = 3,411) from Bialystok. The study included three groups of respondents: 6–7-year-old children (24.2%, n = 2,278), 13–14-year-old adolescents (25.6%, n = 2,418), and 20–44-year-old adults (50.3%, n = 4,747).
The presence of allergic rhinitis was identified with the question: “Do you suffer from any nasal allergies, including runny nose due to allergy to plant pollen (hay fever)?” The presence of asthma was assessed with the question “Have you ever had asthma?” Accompanying answer: “April, May” to the question “In which months have the problems occurred?” identified individuals with a suspected allergy to birch, while the answers “May, June, July” identified individuals with a suspected allergy to grasses [5, 21].
A total of 24% of the respondents (n = 2,255) were enrolled in the clinical part of the study. They represented all age groups, with 6–7-year-olds (n = 646) constituting 28.6% of this group, 13–14-year-olds (n = 610) constituting 27.1%, and adults (n = 999) constituting 44.3%. Medical history was taken, and physical examination was performed. The allergy was confirmed by a positive skin prick test for inhalant allergens where the response was recorded as the mean diameter of the wheal. A positive result was defined as a diameter ≥ 3 mm [22]. The diagnostic work-up was extended to include an assay for Timothy grass-specific IgE using the reference method CAP (Phadia reagents, UniCAP 100 Laboratory System). A concentration of sIgE antibodies of at least 0.70 IU/ml (classes 2–6) was considered positive. The diagnoses were verified based on the ARIA [23] and GINA criteria [24]. A diagnosis of intermittent allergic rhinitis was made in 287 (12.7%) and persistent allergic rhinitis in 338 (15.0%) of the subjects in the four cities.
Pollen monitoring was carried out in Wroclaw, Katowice, Warsaw, and Bialystok urban centres, located along a transect extending from the south-west to the north-east of Poland, differing in geographical location and some climate characteristics.
In Wroclaw a monitoring station was located in the city centre, on the roof of the University of Wroclaw Institute of Geological Sciences building. In the Katowice metropolitan area, a recording device was placed on the roof of the Faculty of Earth Sciences, Silesian University building, in Sosnowiec, in the Pogoñ district (approx. 15 km from the centre of Katowice). In Warsaw, a recording device was placed on the roof of a building in the district of Bielany and in Bialystok on the roof of a building overlooking the Branicki Palace compound. Measurements were taken at a height of approx. 20–30 m above ground.
Pollen concentrations were recorded, in line with international standards, by the volumetric method using a Burkard-type sampler operating in a continuous volumetric mode. Concentrations were recorded over 7 days and analyzed separately for each 24-hour period. Microscopic analysis was performed according to the 4 horizontal band method, with mean daily pollen counts expressed per 1 m3 of air [25].
Pollen monitoring in the four urban centres over 6 years preceding and including the period when the clinical assessment was performed served to characterize pollen seasons of the taxa that are the most common allergens in the Polish population, namely Poaceae (grasses) and Betula (birch) [5]. The analysis relied on 6-year means and medians of the following variables [25, 26]:
total pollen count (sum of daily counts);
duration of the pollen season, defined according to the 95% method, where the beginning and end of the season are taken to be days when 2.5% and 97.5% of the total annual pollen count were recorded, respectively;
number of days with above-threshold pollen counts (20 grains/m3 for birch, 20 grains/m3 for grass pollen) and high counts (above 80 grains/m3 for birch and 50 grains/m3 for grass pollen);
maximum pollen counts in the pollen season.
Data from one monitoring site can be taken to represent the general pollen spectrum over an area with a 50 km radius [27], thus reflecting the pollen exposure profile of the study population. The symptoms of hay fever become more frequent and more severe when the pollen count rises beyond a certain threshold. The threshold levels of pollen counts in atmospheric air (producing initial symptoms of inhalant allergy in sensitized individuals) and levels of high pollen counts, when symptoms are present in most sensitized individuals, were adopted according to the literature [6, 7, 14].
Statistical analysis
Statistical analysis involved the use of contingency tables, determination of the prevalence of allergic rhinitis and asthma and comparison of differences in prevalence of these two conditions between the centres, separately for each age group, with a proportion test. The pollen monitoring data were analyzed with boxplots, and analysis of variance was used to demonstrate differences in pollen counts between the cities. The assumptions of analysis of variance were verified with the Shapiro-Wilk and Bartlett tests. Spearman’s correlation coefficient was used to determine associations between the variables representing pollen seasons of birch and grasses and data from the epidemiological study. The level of significance was set at 0.05.
The epidemiological study was approved by the institutional Bioethics Committee and carried out as part of the project “Implementation of the system for prevention and early diagnosis of allergic disorders in Poland” (No. 6 P05 2005 C/06572) funded by the Ministry for Health and Ministry for Science in Warsaw, Poland.
Results
Comparison of pollen monitoring data
The pollen monitoring data for two taxa (birch and grasses) obtained during 6 years of monitoring in four urban centres – Katowice, Wroclaw, Warsaw, Bialystok – are discussed below.
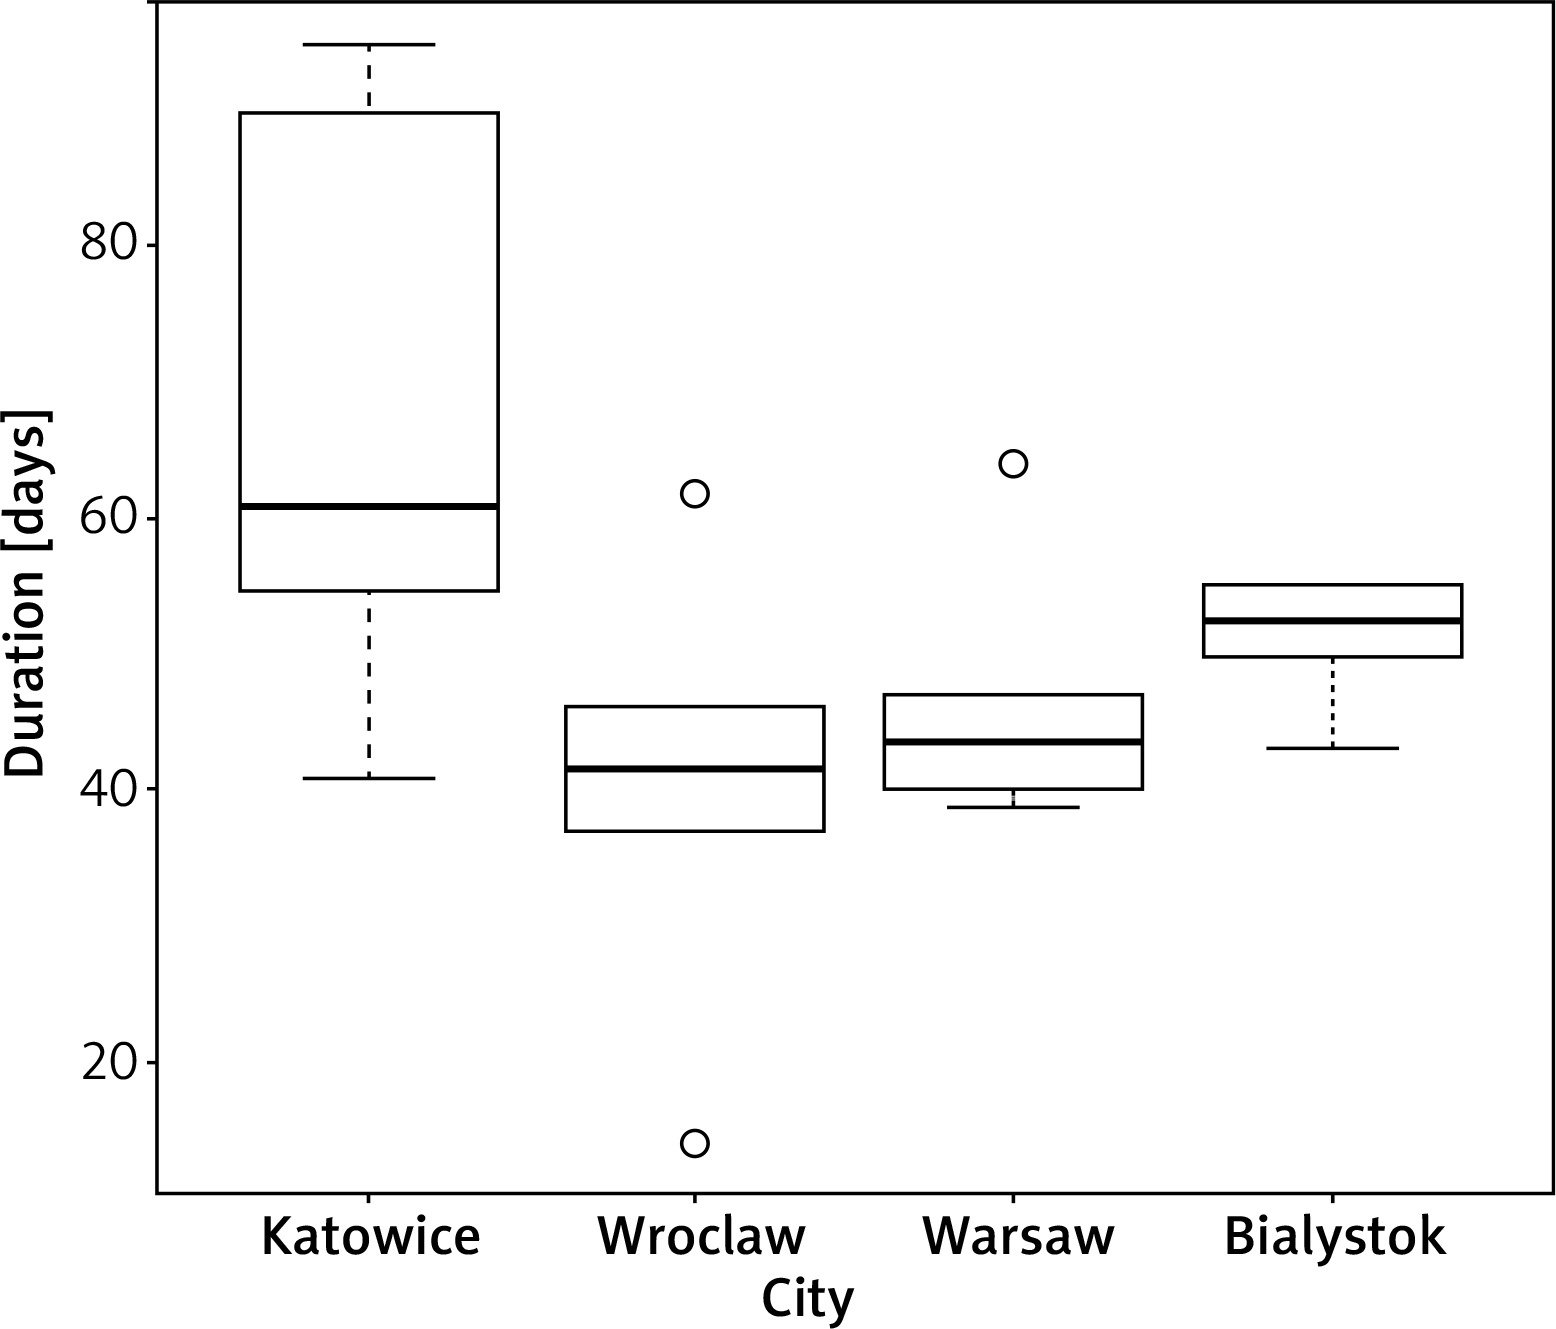
Birch pollen season analysis revealed significant differences in the distribution of season duration; the number of pollen days in the four study areas (ANOVA, p = 0.02217). Six-year medians indicate that the birch pollen season was longest in Katowice and shortest in Wroclaw (Figure 1).
Figure 1
Duration of birch (Betula) pollen season in Katowice, Wroclaw, Warsaw and Bialystok (6-year medians)
Differences in total birch pollen count between the monitoring sites were found not to be statistically significant (ANOVA, p = 0.3935). No significant differences between the cities were also noted for the variables of maximum birch pollen count in the pollen season and the number of days with high counts and above-threshold counts (p > 0.05). During the 6 years of monitoring, the beginning of the birch pollen season was on average earliest in Wroclaw (9 April), preceding by 8 days the respective average date for birch in Bialystok, which was the latest among the four cities. The mean duration of the birch pollen season was much shorter than that of the grass pollen season, which lasted 128 days, but the maximum pollen counts for birch were several-fold higher than the value for grasses.
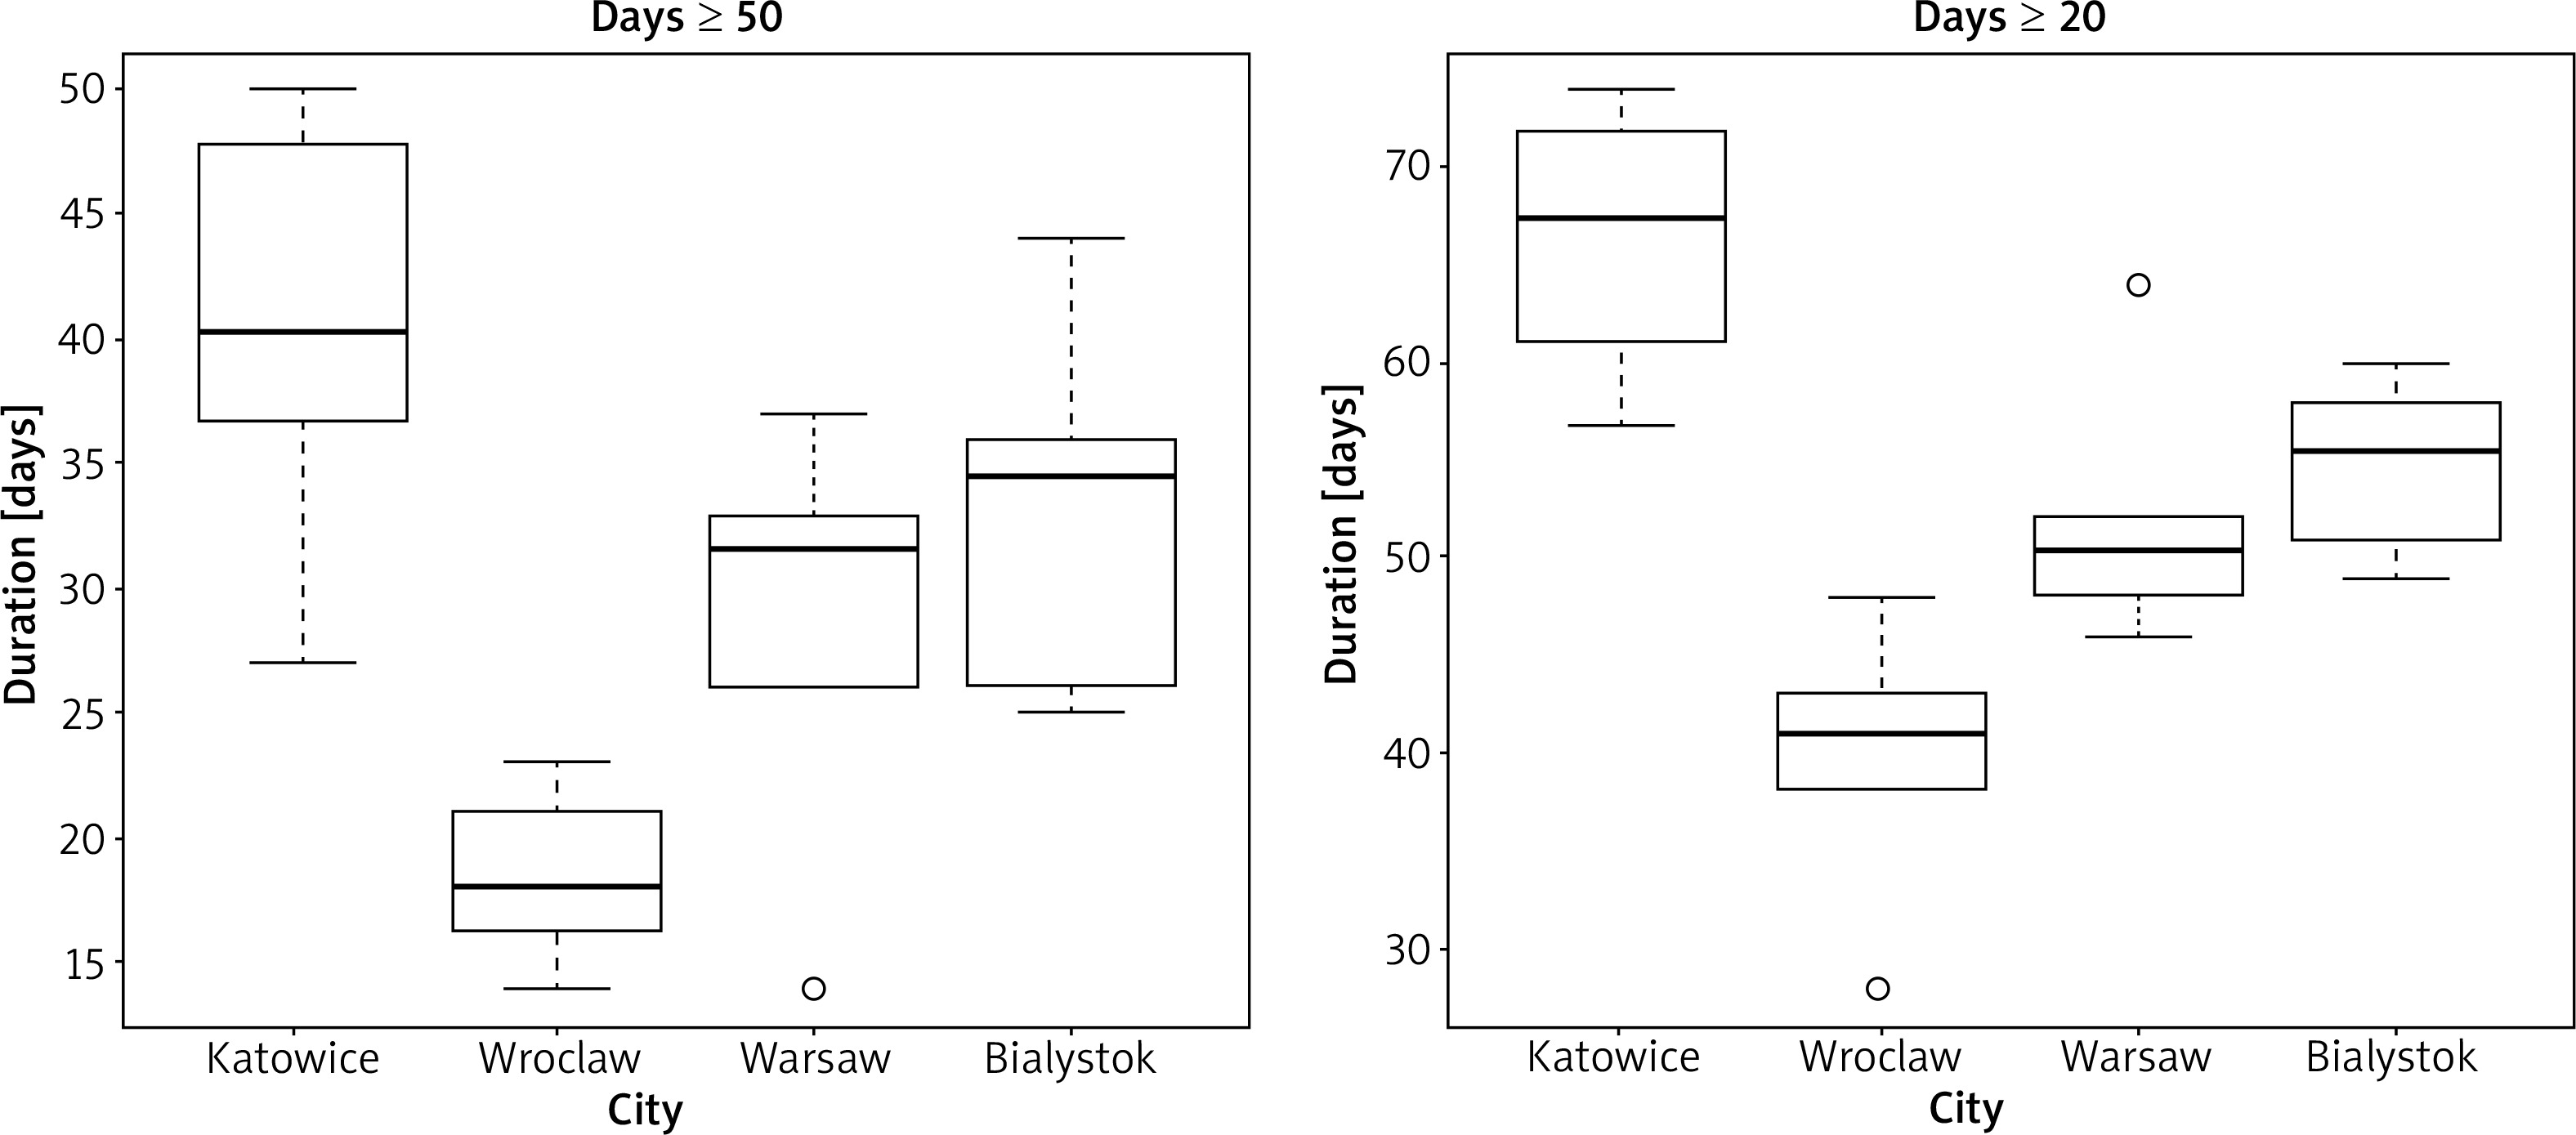
The analysis of grass pollen seasons revealed significant differences in the distribution of the days with above-threshold (at least 20 grains/m3) pollen counts between the study areas (ANOVA, p = 0.000005) and the number of days with high counts (at least 50 grains/m3) (ANOVA, p = 0.000232). Six-year medians indicate that the largest number of days with above-threshold and high pollen counts were recorded in Katowice, and the smallest in Wroclaw (Figure 2).
Figure 2
Number of days during grass (Poaceae) pollen season with pollen counts above the threshold (at least 20 grains/m3) and with high pollen counts (at least 50 grains/m3) in Katowice, Wroclaw, Warsaw and Bialystok (6-year medians)
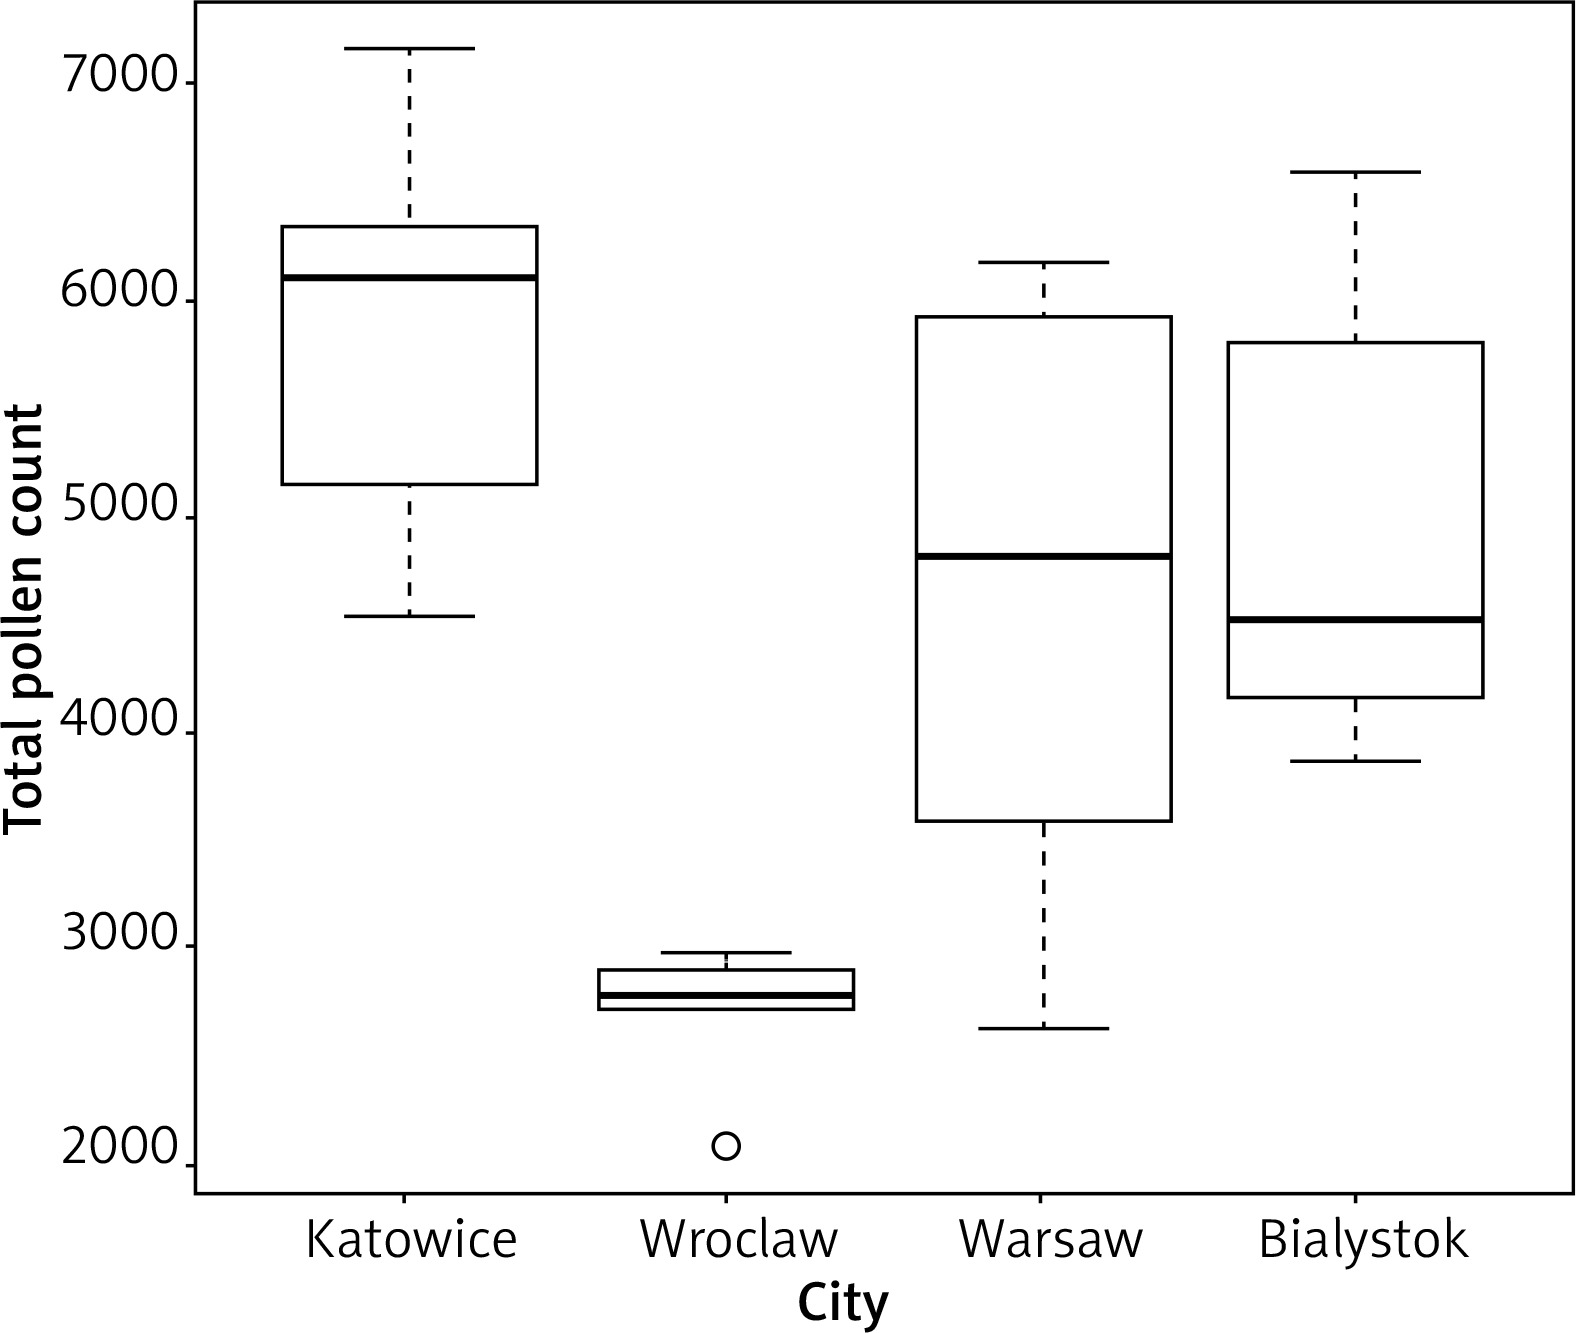
There were significant differences in the distribution of the total grass pollen count between the study areas (ANOVA, p = 0.0001948). Six-year medians indicate the highest grass pollen intensity in Katowice and the lowest in Wroclaw (Figure 3).
Figure 3
Total pollen count for grasses (Poaceae) in Katowice, Wroclaw, Warsaw and Bialystok (6-year medians)
No significant differences were noted between maximum grass pollen counts in the pollen season at the monitoring sites (p > 0.05). In the 6 years of monitoring, the beginning of the grass pollen season was on average earliest in Wroclaw (9 May), preceding by 12 days the average date for grasses in Bialystok (latest among the four centres).
Questionnaire survey
Significant differences were noted between the cities in both the group of 6–7-year-olds and among adults in the prevalence of declared nasal allergy, with symptoms reported in the months corresponding to the pollen seasons of the individual taxa.
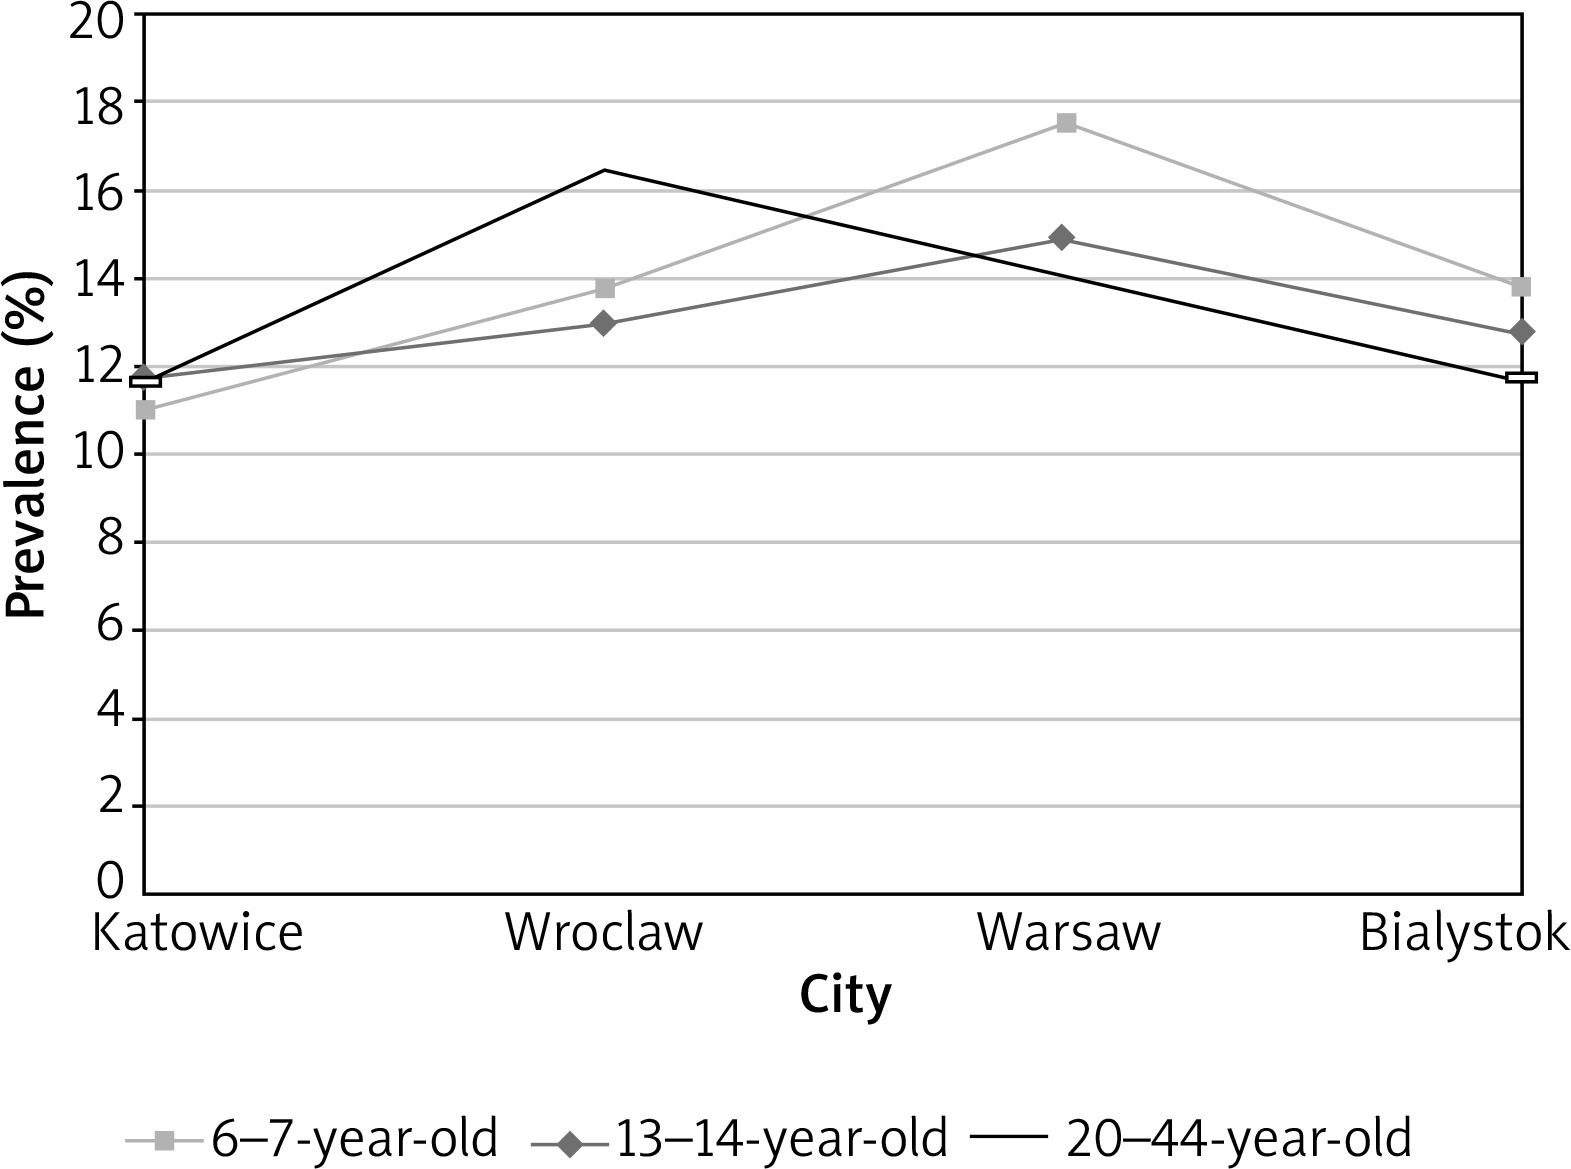
The lowest prevalence of declared nasal allergy among 6–7-year-olds with symptoms indicative of birch pollen allergy was noted in Katowice (11%), and the highest in Warsaw (17.5%, p = 0.025). In adults, the lowest prevalence of declared nasal allergy with symptoms indicative of birch pollen allergy was also noted in Katowice (11.7%), with the highest in Wroclaw (16.5%, p = 0.01). The differences detected in the group of 13–14-year-olds were not statistically significant (p > 0.05) (Figure 4).
Figure 4
Distribution of prevalence of declared allergic rhinitis with symptoms coinciding with months of birch pollen season in the four cities and in individual age groups
In adults, nasal allergy with symptoms coinciding with the grass pollen season was least often declared in Bialystok (13.5%) and Katowice (14.0%). It was most prevalent in Wroclaw (18.4%, p = 0.03). The differences detected in the two remaining age groups were not statistically significant (p > 0.05).
The prevalence of declared asthma with symptoms coinciding with the birch pollen season differed significantly between the cities in all age groups. Among the 6–7-year-olds, the lowest prevalence of declared asthma was noted in Bialystok (0.7%) and Katowice (1.2%), and the highest prevalence was recorded in Wroclaw (3.5%, p = 0.001). In the group of 13–14-year-olds, the lowest prevalence was again noted in Bialystok (1.4%) and Katowice (1.6%), and the highest figures were reported from Warsaw (4.3%) and Wroclaw (4.0%, p = 0.0009). Among adults, too, the lowest figures were recorded in Bialystok (1.3%), and the highest in Wroclaw (3.3%, p = 0.016).
The prevalence of declared asthma with symptoms related to the grass pollen season also demonstrated significant differences between the cities across all age groups. In the group of 6–7-year-olds, the lowest prevalence of declared asthma was noted in Bialystok (0.8%) and Katowice (1.4%), and the highest in Wroclaw (3.2%, p = 0.014). Among the 13–14-year-olds, the prevalence of declared asthma was lowest in Bialystok (1.4%) and highest in Warsaw (4.3%, p = 0.002). Adults declared asthma the least often also in Bialystok (1.0%), and the most often in Wroclaw (3.7%, p = 0.0001).
Clinical evaluation
Analysis of the prevalence of clinically diagnosed intermittent allergic rhinitis in individuals with a confirmed grass pollen allergy (following history taking, physical examination, a positive skin prick test and/or sIgE) revealed statistically significant differences between the cities among the group of 13–14-year-olds and in adults. In the former group, this clinical prevalence was lowest in Katowice (4.59%) and highest in Warsaw (15.34%, p = 0.0056). The difference between the prevalence in Bialystok (7.1%) and Warsaw (15.34%) was also significant in this age group (p = 0.017). In adults, the prevalence of intermittent allergic rhinitis caused by grass pollen allergy similarly demonstrated significant differences, with the lowest prevalence in Katowice (5.13%) and the highest in Warsaw (12.88%, p = 0.0047).
The prevalence of clinically diagnosed persistent allergic rhinitis in individuals with confirmed grass pollen allergy demonstrated statistically significant differences between the cities only in adults, where such differences were noted between Katowice (13.33%) vs. Wroclaw (4.61%, p = 0.006) and Warsaw (4.74%, p = 0.007) and between Bialystok (9.09%) and Warsaw (4.75%, p = 0.0362).
There were differences between the cities in the prevalence of intermittent vs. persistent allergic rhinitis in individuals with a confirmed grass pollen allergy among adults. The highest prevalence of intermittent allergic rhinitis was noted in Warsaw (12.88%), where the prevalence of the persistent form (4.74%) was among the lowest (the lowest figure of 4.61% was recorded for Wroclaw). At the same time, Katowice had the lowest prevalence of intermittent allergic rhinitis of the four cities, at 5.13%, and the highest prevalence of persistent allergic rhinitis, at 13.33%.
The prevalence of clinically diagnosed bronchial asthma with a confirmed allergy to grass pollen allergens (following history taking, physical examination, a positive skin prick test and/or sIgE) did not demonstrate significant differences between the cities in the three age groups. The highest prevalence in this analysis was noted among 13–14-year-olds and ranged from 1.84% in Katowice to 4.29% in Warsaw.
Correlation of pollen season dynamics data for birch and grasses against epidemiological data
The intensity of exposure to allergenic pollen was not significantly associated with the prevalence of allergic rhinitis and asthma. However, we found insignificant negative associations between the duration of birch pollen season vs. declared allergic rhinitis with symptoms coinciding with the pollen season for this taxon (the Spearman correlation coefficient (rho) was –0.4 in the 6–7-year-olds and -1 in adults) and declared asthma (rho was –0.8 in the 6–7-year-olds, –0.6 in the 13–14-year-olds and –0.8 in adults).
There were insignificant inverse associations between the prevalence of declared allergic rhinitis and asthma with symptoms coinciding with the grass pollen season in all age groups vs. the number of days with above-threshold pollen counts, high pollen counts and total grass pollen count (Table 1).
Table 1
Correlation analysis of the prevalence of allergic rhinitis and asthma with symptoms in the grass pollen season against grass pollen data (questionnaire survey). Spearman correlation coefficient; rho (p > 0.05)
In the clinical assessment, we found insignificant negative associations between the prevalence of intermittent allergic rhinitis among the 6–7-year-olds and the number of days with above-threshold pollen counts (rho = –0.8), high pollen counts (rho = –0.8) and total grass pollen count (rho = –0.4). At the same time, these associations were insignificantly positive among the 13–14-year-olds (rho = 0.4, 0.2 and 0.8, respectively) and in the adult group (rho = 0.2, 0.2 and 0.4, respectively).
There were insignificant inverse associations between the prevalence of clinically diagnosed persistent allergic rhinitis among the adults and the number of days with above-threshold pollen counts (rho = –0.4), high pollen counts (rho = –0.4) and total grass pollen count (rho = –0.2). At the same time, these associations were insignificantly positive (rho = 0.4, 0.4 and 0.8, respectively) among the 6–7-year-olds and (rho = 0.4, 0.4 and 0.2, respectively) among the 13–14-year-olds.
Discussion
Our analysis of 6-year pollen monitoring in four urban centres located in different regions of Poland far away from one another revealed a diversity of patterns of birch and grass pollen season dynamics. With regard to the youngest age group analyzed (6–7-year-olds), the time frame of the analysis accounted for most of their lives. The level of exposure to grass pollen allergens in Wroclaw was noticeably lower than in the other cities. One of the reasons could be the fact that in four out of the 6 years of study, total precipitation in the grass pollinating season was the lowest in Wroclaw, whereas according to Makra et al., in the years with rainfall greater than usual, grasses can produce a higher amount of biomass, which means higher pollen production [28]. Another reason could be differences in the proportion of green areas in the total area of the cities. According to Rojo et al., urban green spaces are one of the most important types of land use that contribute to the amount of pollen [29]. Based on information obtained from a Local Data Bank in Poland [30], in the monitoring years, Wroclaw was characterized by the lowest proportion of green areas (including parks, lawns, street and estate greenery) in the city area, amounting to approximately 5.5%, compared to 7.3% in Warsaw, where this contribution was the highest. The lower exposure to birch pollen in Wroclaw can be linked to the surroundings of this city. According to the Polish Forest Data Bank database [31], there are no big clusters of birch trees in forests located near Wroclaw, in contrast, for example, to the Katowice metropolitan area.
Differences in exposure to pollen are reflected in the diversity of allergic symptoms severity and duration in sensitized individuals, a finding confirmed in numerous publications [6–13]. This association was also visible in our study. In Katowice, where the grass pollen season was the longest and total pollen count was the highest, allergic rhinitis patients sensitized to this allergen were most often diagnosed with persistent allergic rhinitis (according to the ARIA criterion), and least often, of the four cities, with the intermittent form. A reverse trend was noted in Wroclaw, where the grass pollen season in the study period was the shortest and least intense.
Despite the above, data on the effect of pollen exposure on the prevalence of inhalant allergy are scarce and inconsistent.
There are publications confirming the claim that the prevalence of allergic rhinitis and asthma is greater in centres with higher pollen loads. Silverberg et al. found a positive association between total pollen counts and hay fever prevalence in a study of the under-17 American population [16]. Yoshida et al. documented in the ISSAC study a positive association between cedar pollen counts and allergic diseases in Japanese schoolchildren [19]. Ariano et al. compared two centres in Italy with significantly different ragweed pollen loads to conclude that allergy prevalence seemed to be associated with ragweed pollen pressure [20].
However, our study did not find evidence of a positive association between pollen exposure and prevalence of allergic rhinitis and asthma. Analysis of the coefficient of correlation between declared allergic disease prevalence (by centre) and pollen data showed that the associations were fairly weak and tended to be negative. None were statistically significant. The findings of the questionnaire survey are in agreement with an analysis of children within the ISAAC study by Burr et al. [14], and of adults within the GERID study by Marchetti et al. [15], where the prevalence of allergic rhinitis was inversely associated with pollen exposure.
Burr et al. [14] analyzed data from the ISSAC study (28 centres in 11 countries, including 9 in Europe) with regard to 1-year pollen data among children. They found a weak but consistent tendency for the prevalence of allergic disease to be inversely associated with pollen exposure. The tendency remained negative after accounting for some potential confounders, such as relative humidity as a weather factor and gross national product as a lifestyle factor. The authors suggested an analogy with reports of lower prevalence of hay fever and asthma in rural than in urban areas [32–34], where, apart from exposure to numerous environmental factors associated with farming, exposure to pollen is more frequent and concentrations are higher than in urban areas. Along these lines, Burr et al. suggested that high-level exposure to pollen allergens not only does not constitute a risk factor for the development of inhalant allergy, but may actually afford some protection [14], by analogy to the mechanism that has been proposed to explain the induction of tolerance to perennial allergens in children [35, 36]. The GERID study of Marchetti et al., conducted in a population of young adults at 6 centres in different regions of Italy, revealed a similar tendency [15]. The authors noted that allergic rhinitis was less frequent in centres with higher pollen loads, but asthma prevalence was not associated with pollen counts. Both these papers were wholly based on questionnaire surveys.
A strength of our study is the inclusion of a clinical component complementing the survey component. The associations between the prevalence of clinically diagnosed inhalant allergy in the course of sensitisation to grass pollen allergens and the severity of exposure to grass pollen were not statistically significant and there was no uniformity between trends observed in the different age groups.
The level of air pollution is a potential confounder in analysing the association between exposure to pollen and the prevalence of inhalant allergy [37]. Various components of air pollution can induce or increase inflammation in the respiratory mucosa and increase hyper-reactivity [38]. They can also affect the intensity of pollen grain production by allergenic plants and modify their allergenicity [39]. Further studies should be designed to address this issue, accounting for co-existing factors that may potentially affect these associations, including air pollution.


