Introduction
Primary aldosteronism (PA) is the most common cause of secondary hypertension [1]. The 2 main subtypes of PA are aldosterone-producing adenoma (APA) and bilate-ral hyperplasia [1]. Unilateral adrenalectomy is beneficial and the best treatment option for patients with unilateral APA. Targeted adrenal venous sampling (AVS) is therefore usually performed to determine surgical indications and treatment strategies in patients showing PA. AVS is considered the most accurate and reliable method to judge the lateralization of APA [2-4].
Catheterization of the right adrenal vein (RAV) can be difficult compared with that of the left adrenal vein because of its short length, variable anatomy, and compression by the inferior vena cava (IVC) when the patient is lying supine [5,6]. Identification of the RAV preceding AVS is widely known to be important for minimizing the AVS procedure time [7]. Contrast-enhanced multidetector-row computed tomography (MDCT) has been reported as a practical modality to identify RAVs and interpret their anatomical variations correctly [8,9]. In contrast, magnetic resonance imaging (MRI) offers an advantage over MDCT in that no radiation exposure is needed. In addition, the implementation of chemical shift MRI with in-phase (IPI) and opposed-phase imaging (OPI) has allowed better characterization of adrenal adenoma than unenhanced CT [10,11]. MRI can also distinguish between adrenal nodules and small blood vessels (flow voids) [12]. Accordingly, identification of RAVs using unenhanced MRI could allow reductions in radiation exposure and doses of contrast agent, even though subsequent AVS remains necessary for the diagnosis of unilateral APA. However, the identification rate of RAV using unenhanced MRI has yet to be elucidated.
In this study, we aimed to evaluate the feasibility of unenhanced MRI to identify RAVs.
Material and methods
Subjects
This retrospective study was approved by the institutional review board for human research at the National Hospital Organization Kyushu Medical Centre. Our study reviewed 196 consecutive patients (99 men, 97 women; median age 52 years; range 23-78 years) who received AVS between January 2016 and January 2021. Among these, patients who underwent abdominal MRI before the AVS were included in the present study. Unenhanced MRI was not performed for the identification of RAVs. Patients with severe respiratory motion artifacts on MRI were excluded from the study. Thirty-three patients with suspected PA fulfilled the inclusion criteria (Figure 1). Three patients were excluded from the study due to severe respiratory motion artifacts on MRI. As a result, 30 patients (16 men, 14 women; median age 60 years; range 34-76 years) were analysed in this study.
Magnetic resonance imaging
MR images were obtained using a 1.5-T system (Achieva; Philips Medical Systems, Best, the Netherlands [n = 8] or Magnetom Symphony Tim; Siemens, Erlangen, Germany [n = 6]) or a 3.0-T system (Ingenia; Philips Medical Systems [n = 16]).
Chemical shift MR imaging was acquired in a single breath-hold using a transverse 2-dimensional gradient-echo T1-weighted sequence with echo times (TEs) of 2.3 or 2.38 ms (OPI) and 4.6 or 4.76 ms (IPI) for the 1.5-T systems, and TEs of 1.15 ms (OPI) and 2.3 ms (IPI) for the 3.0-T system. These TEs correspond with the first OP and IP echoes. Other scanning parameters on OPI and IPI are provided in Table 1. Transverse fat-suppressed T2-weighted spin echo images (T2WI; number of excitations = 1; 25 sections; slice thickness = 3 mm; gap = 1 mm) were also obtained. The acquisition parameters of each scanner for fat-suppressed T2WI are also shown in Table 1.
Table 1
MRI scanner and scanning parameters
AVS procedure
A short 5-Fr sheath was placed into the right femoral vein for AVS. A 5-Fr reverse catheter designed for the RAV (MK Adrenal-R shape) or a Cobra catheter was used to target the RAV. A high-flow-type microcatheter was inserted into the left adrenal vein below the confluence of the inferior phrenic vein. Correct positioning of the catheter was confirmed by injecting a small volume of diluted iodine-contrast material. Catheterization of the RAV was considered successful when the cortisol level was > 200 µg/dl or the selectivity index (calculated as the ratio of cortisol level in the RAV and IVC) was > 5 after adrenocorticotropic hormone (ACTH) stimulation [9,13]. Adrenal venous samples were obtained from the bilate-ral adrenal veins, and external iliac venous samples were collected at sheath placement and just prior to sheath removal.
Image evaluation
Identification of the RAV on MR imaging was performed by 2 independent radiologists (with 19 and 10 years of experience) who were blinded to the AVS results. RAVs were defined as a tubular or linear structure arising from the right adrenal gland and entering the IVC either directly or indirectly [8]. All MR image data were displayed on a picture and archiving communication system. Visualization of the RAV was scored by each observer on a 3-point scale: 3 = excellent; 2 = fair; and 1= poor. Scores of 2 or 3 were considered as positive results, and identification rates for RAV were calculated for OPI, IPI, and T2WI.
Statistical analyses
All statistical analyses were performed using PASW Statistics version 18 (SPSS Inc., Chicago, IL), and graphs were generated using GraphPad Prism 7 (GraphPad Software, La Jolla, San Jose, CA). Inter-observer agreement on the rating of RAVs was evaluated using κ statistics. The κ value was interpreted as follows based on the article by Landis and Koch [14]: poor, 0 to 0.20; fair, 0.21 to 0.40; moderate, 0.41 to 0.60; good, 0.61 to 0.80; and perfect, 0.81 to 1.
Second, the identification rate of RAVs was compared among OPI, IPI, and T2WI using McNemar’s test [15-17]. In all statistical analyses, the level of significance was set at p < 0.05.
Results
Selective AVS was considered successful in 27 of 30 patients (90.0%). A unilateral adrenal nodular lesion was observed in 23 of 30 patients (76.7%) on unenhanced MR imaging. Among these, 10 patients (10/23, 43.5%) were diagnosed with unilateral APA consistent with AVS results. Most inconsistencies between MR imaging and AVS were caused by identification of a unilateral adrenal nodule on MR imaging, while AVS suggested bilateral APA.
Table 2 indicates the results for inter-observer agreement. Good inter-observer agreement was found for OPI (κ = 0.744), whereas fair agreement was obtained for IPI (κ = 0.375) and T2WI (κ = 0.348). Table 3 provides identification rates for the RAV among OPI, IPI, and T2WI. The identification rate for the RAV was significantly higher with OPI (36/60, 60.0%) than with IPI (16/60, 26.7%; p < 0.001) or T2WI (9/60, 15.0%; p < 0.001). Hypointense bands around the RAV were clearly seen on OPI. No significant difference was found between IPI and T2WI for the identification rate of RAV (p = 0.092). Representative images from MR imaging and digital subtraction angio-graphy are shown in Figures 2 and 3.
Table 3
Identification rate of the RAV
| Observer | OPI | IPI | T2WI |
|---|---|---|---|
| 1 | 18/30 (60.0) | 11/30 (36.7) | 7/30 (23.3) |
| 2 | 18/30 (60.0) | 5/30 (16.7) | 2/30 (6.7) |
Figure 2
Chemical shift magnetic resonance (MR) imaging with in-phase (IPI; A and D) and opposed-phase imaging (OPI; B and E), and fat-suppressed T2-weighted imaging (T2WI; C) on 3.0-T MR imaging of a 74-year-old female with left aldosterone-producing adenoma (APA). The right adrenal vein (RAV) is clearly identifiable on OPI (A; rated as 3 by both observers; arrow) but is not visualized on IPI or fat-suppressed T2WI (rated as 1 by both observers). The left adrenal adenoma appears slightly hyperintense on IPI (D; arrowhead) and hypointense on OPI (E; arrowhead). Fluoroscopic imaging shows the RAV draining into the inferior vena cava (IVC; F)
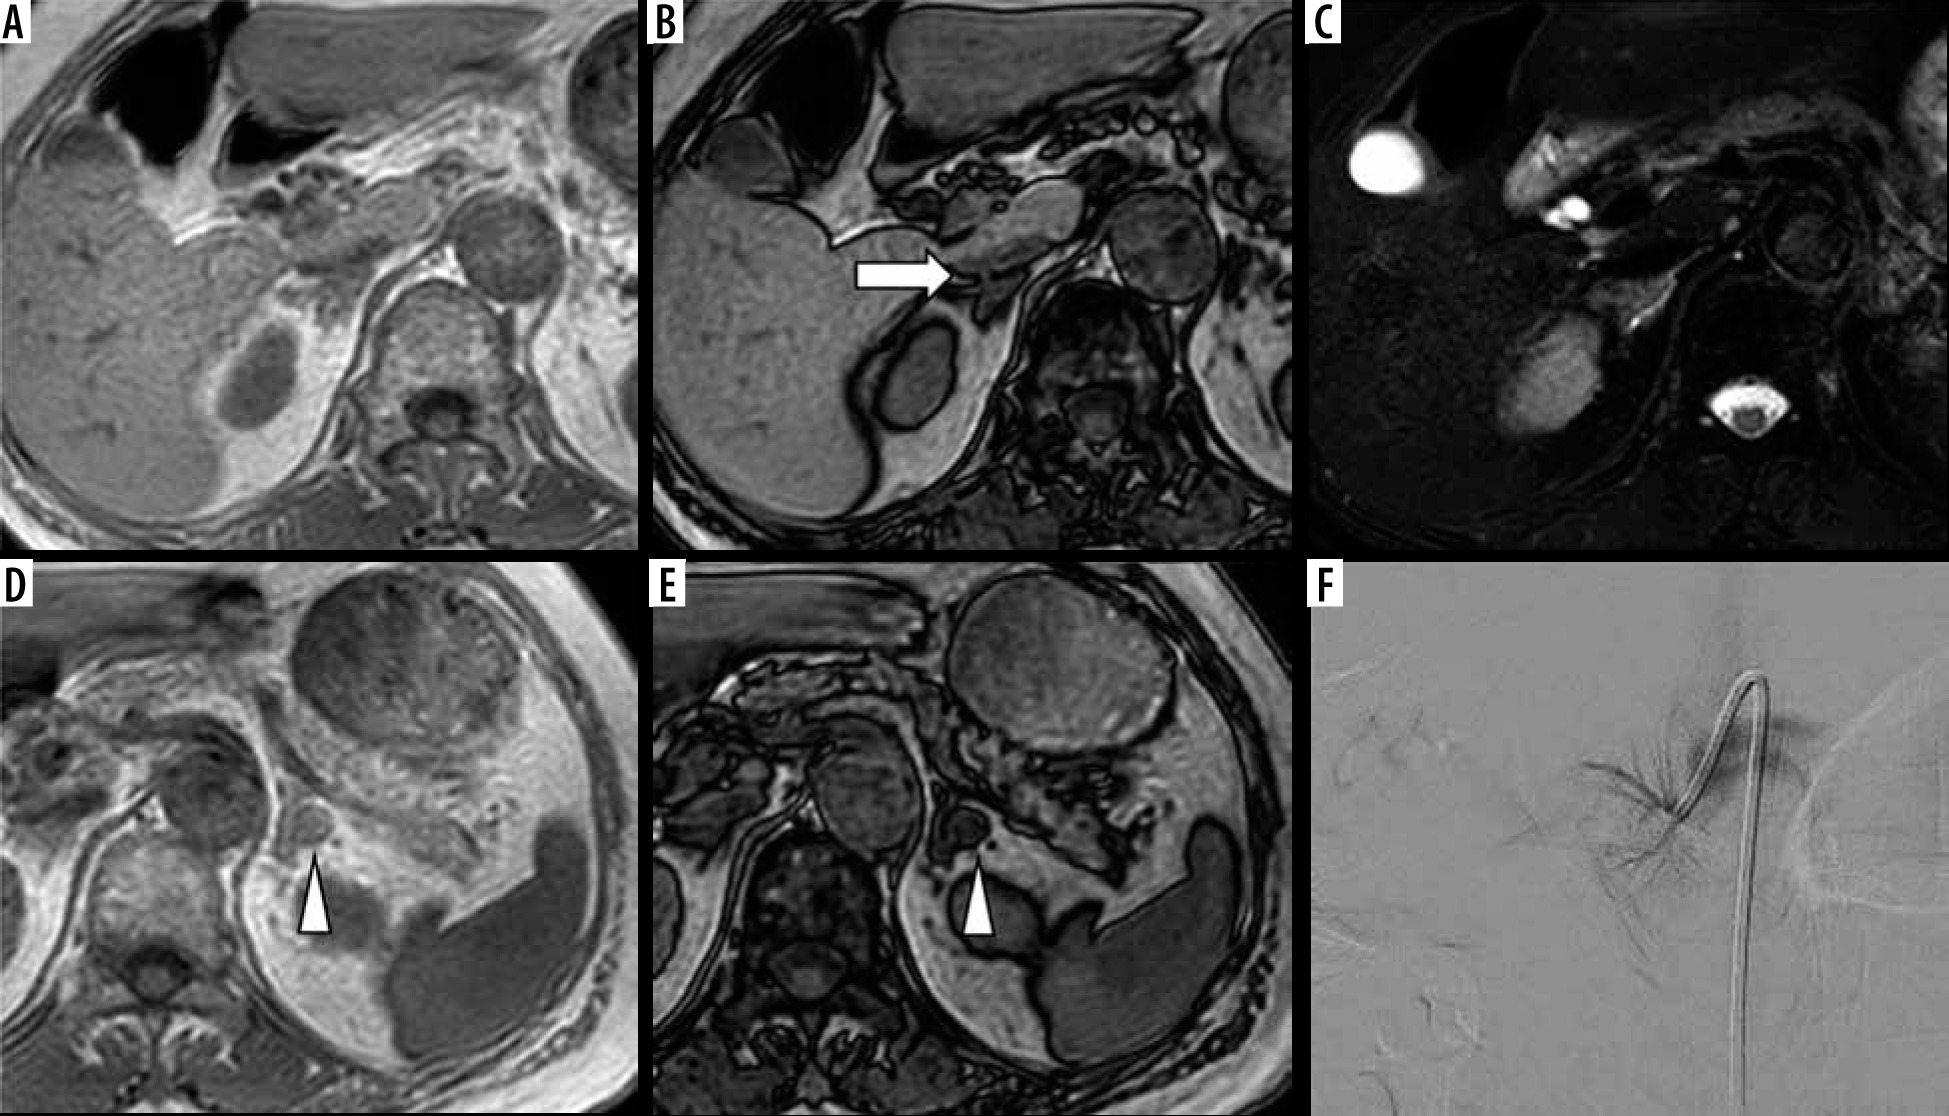
Figure 3
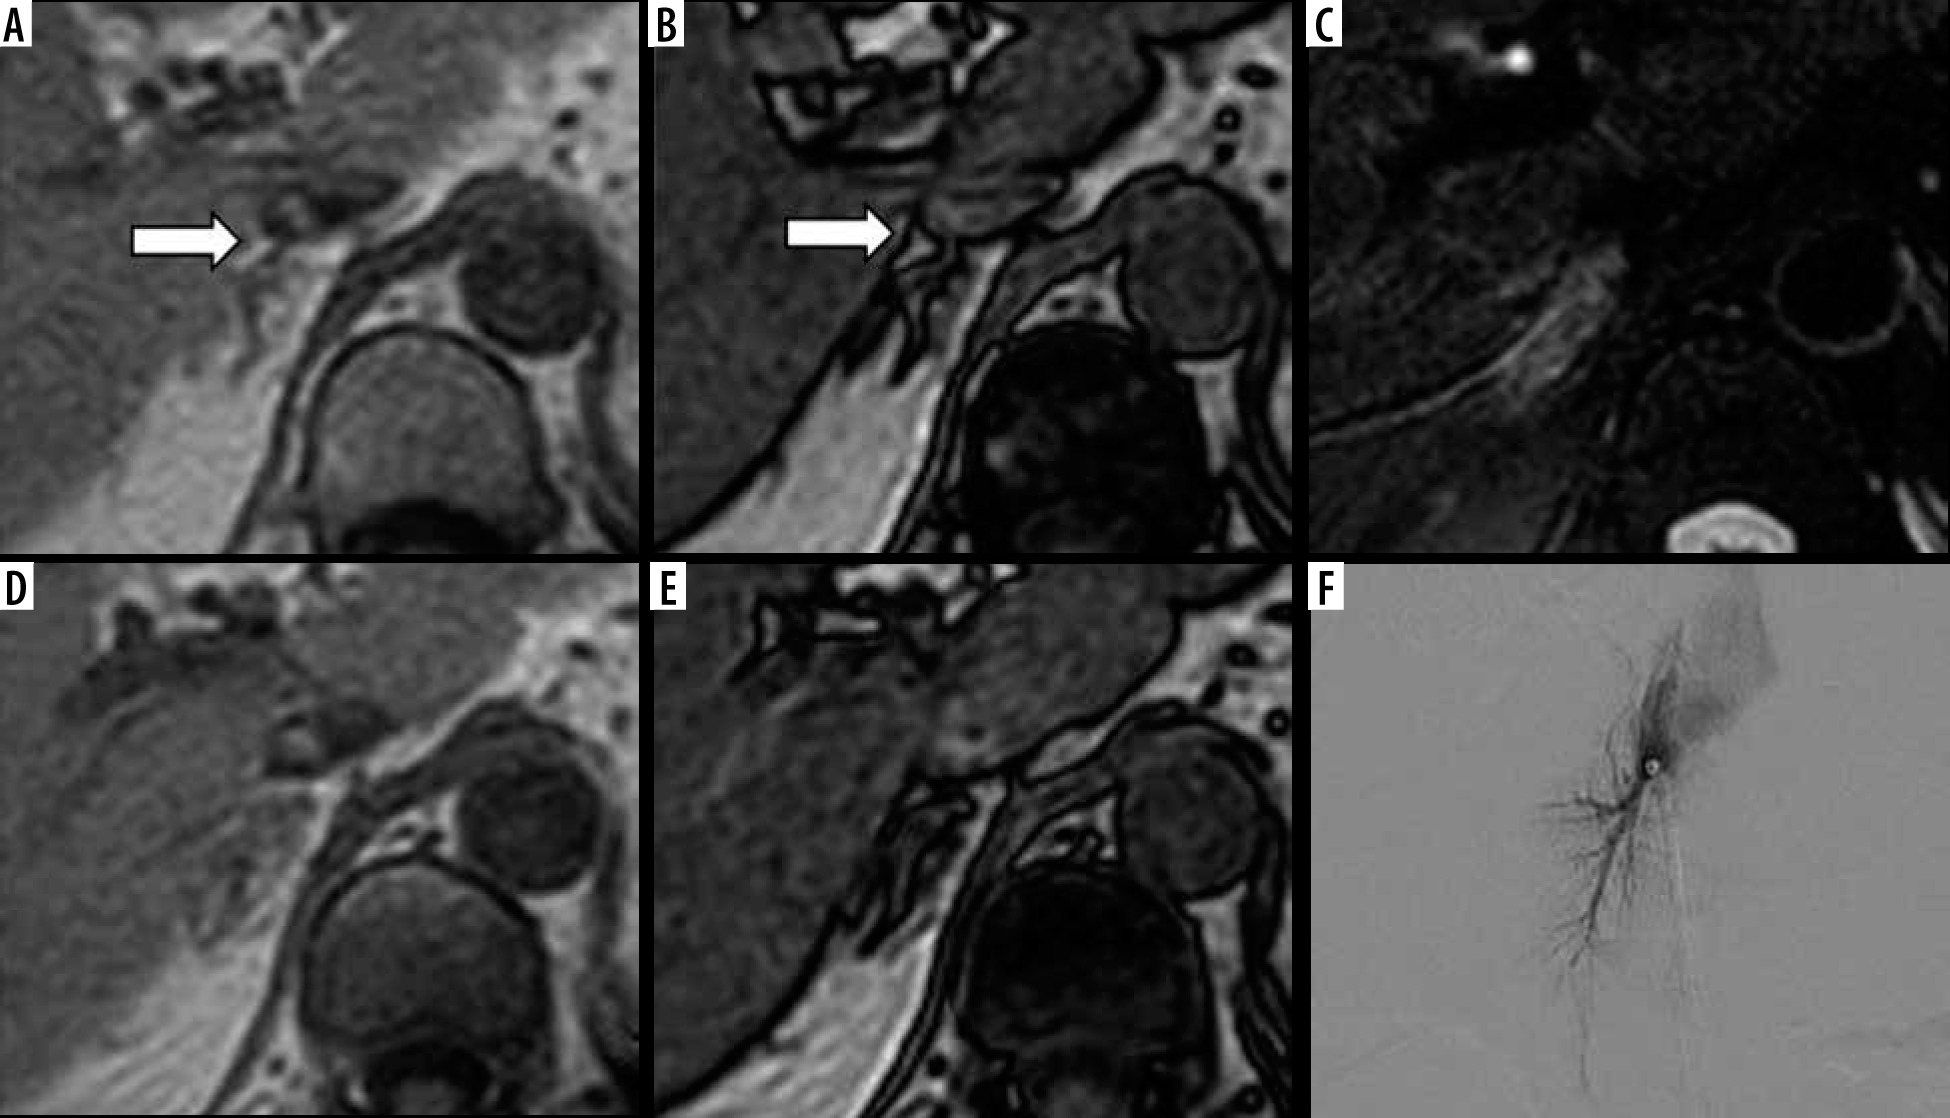
Chemical shift magnetic resonance (MR) imaging with in-phase (IPI; A and D), opposed-phase imaging (OPI; B and E), and fat-suppressed T2-weighted imaging (T2WI; C) on 3.0-T MR imaging of a 56-year-old female with left aldosterone-producing adenoma (APA). The right adrenal vein (RAV) is clearly identifiable on OPI (A; rated as 3 by both observers; arrow). The RAV is scored as 2 on IPI by both observers (B) but is not visualized on fat-suppressed T2WI (C; rated as 1 by both observers). Caudal slices on IPI (D) and OPI (E) confirm the RAV (arrow in B). Fluoroscopic imaging depicts the RAV draining into the IVC (F)
Discussion
In the present study, the identification rate of RAVs appeared to be higher with OPI than with IPI or T2WI. In addition, good inter-observer agreement was found with the OPI. These results demonstrate the feasibility of OPI for identifying RAVs before AVS although contrast-enhanced MDCT is far superior for the detection of RAVs.
RAVs are usually short (4-15 mm long) with small internal diameter (2-6 mm) [18], which might be one reason identification of the RAV has not been performed using MR imaging, instead using contrast-enhanced MDCT before the AVS procedure. The right adrenal gland is located behind the IVC [19] and is usually surrounded by fat [18]. Type 2 chemical shift artifacts are commonly seen as a sharp demarcation at the interface between organ and visceral fat, referred to as the “India ink” artifact [20]. This India ink artifact has been applied to diagnose fat-containing tumours and sources of inflammation such as acute pancreatitis [20]. Hypointense bands (India ink artifact) around the RAV were clearly seen on OPI caused by the type 2 chemical shift artifact; the dark bands may have contributed to the higher identification rate and higher inter-observer agreement for the RAV compared to IPI and T2WI in this study. We assume OPI offers advantages over IPI and T2WI in terms of RAV identification, especially in cases of a RAV with greater length, because surrounding fat highlights the type 2 chemical shift artifact.
Our results indicated that adrenal nodular lesions identified on MR imaging were not consistent with AVS results in some cases. Most inconsistencies between MR imaging and AVS in this study involved a unilateral adrenal nodule being identified on MR imaging, while bilateral APA was suggested from AVS results. Minami et al. reported that 9 of 23 patients with unilateral adrenal adenoma on CT were confirmed to have bilateral adenomas, and some patients with bilateral or no apparent adenomas on CT were diagnosed with unilateral APA based on AVS results [4]. As a consequence, AVS remains the gold-standard method to determine the laterality of aldosterone hypersecretion [4].
This study has several limitations that merit consideration when interpreting the results. First, the number of subjects was relatively small, and the scanning MR sequences were limited to OPI, IPI, and fat-suppressed T2WI. Future studies with larger sample sizes and the addition of optimized MR sequences will provide more accurate and robust results. Second, there is still room for improvement in scanning parameters such as slice thickness because RAVs are usually short in length and narrow in internal diameter [7,18]. However, we believe that hypo-intense bands around the RAV are useful to identify the veins compared to other sequences. Lastly, RAVs could not be confirmed by AVS, which is the gold standard of AVS identification. Nevertheless, identifying the RAV as a tubular or linear structure between the right adrenal gland and IVC appears reasonable [8].