Introduction
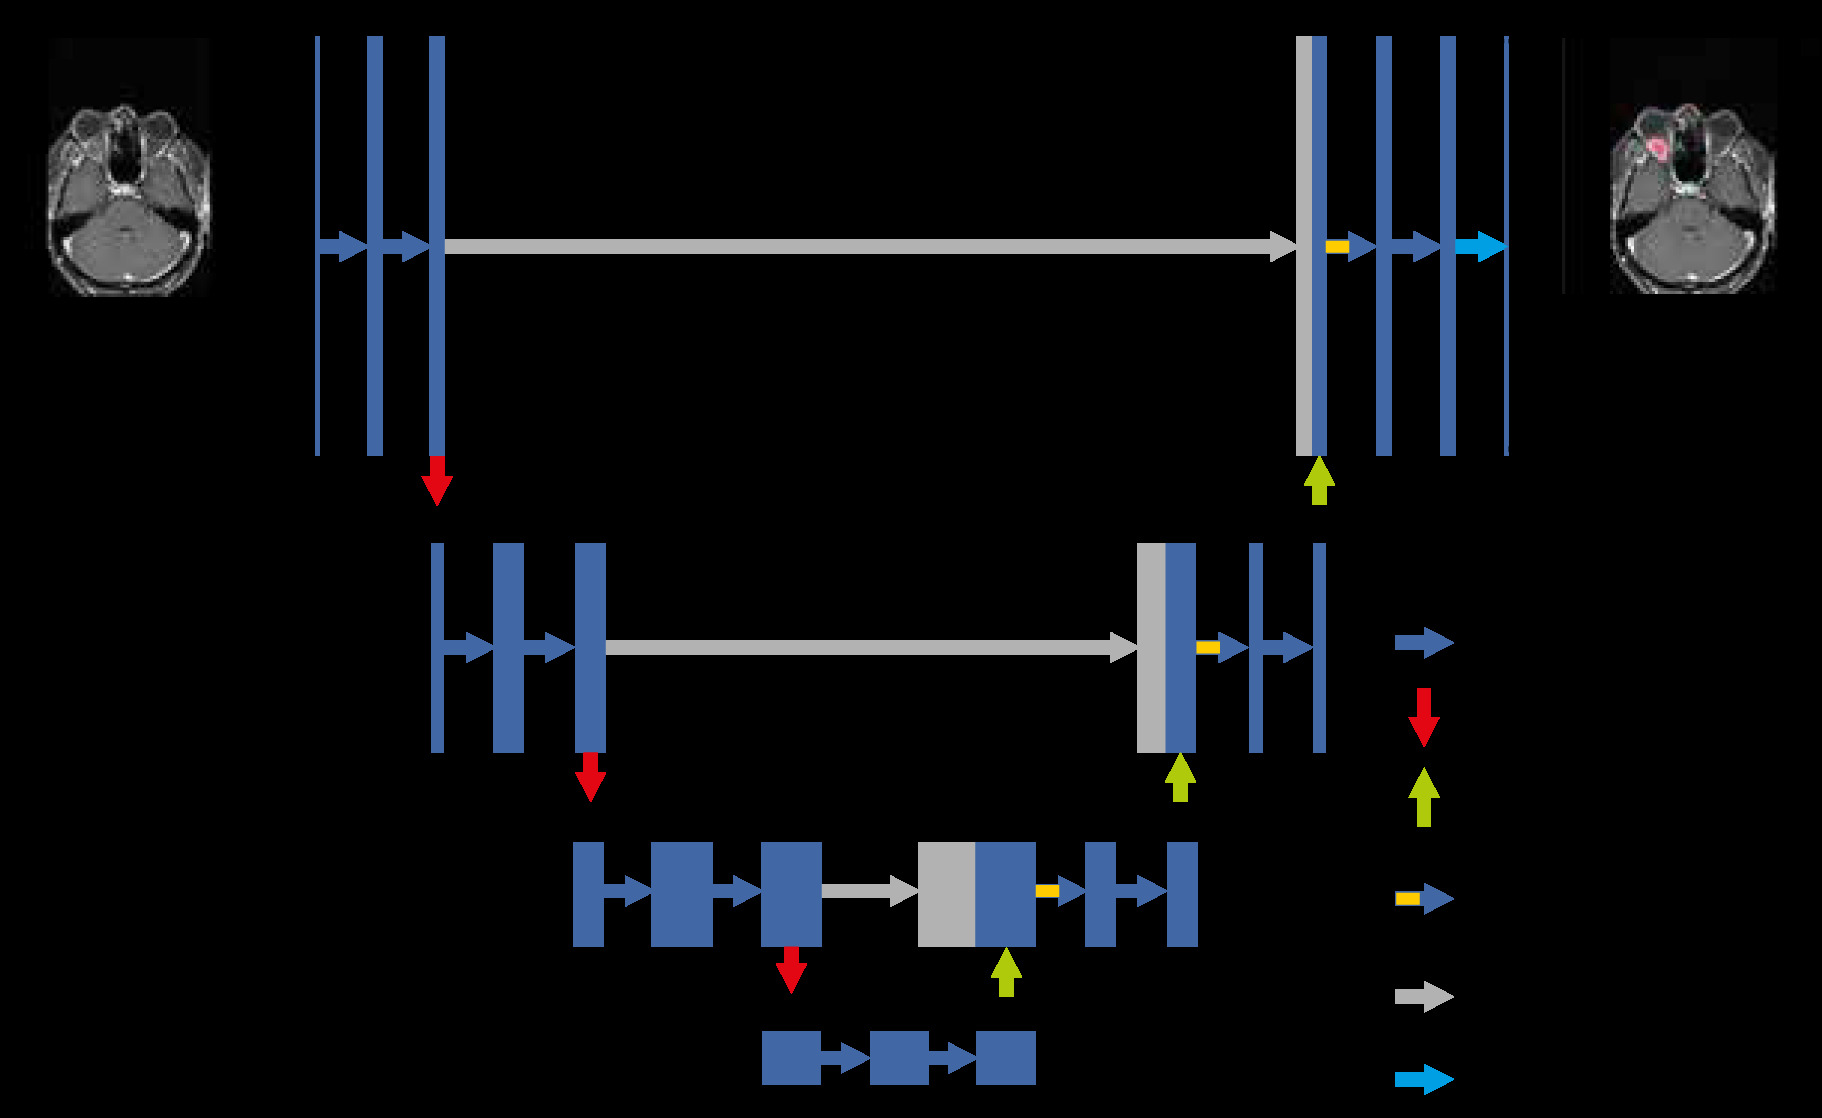
Preoperative imaging and localization of the lesion are very important in orbital and periorbital tumours [1]. The main methods in the evaluation of orbital and periorbital-periocular lesions are orbital ultrasound, computed tomography (CT), and magnetic resonance imaging (MRI) [2]. Orbital MRI has an important place in the evaluation of orbital and periorbital lesions because it does not use radiation, provides more information about the internal structure of the lesion, and better demonstrates invasion to surrounding tissues. Conventional fat-suppressed, T1-weighted sequences are indispensable in conventional orbital MRI examinations. In addition to these sequences, multiparametric images assist in the dia-gnosis [3,4]. For orbital lesions, their location in orbital compartments may also guide the diagnosis [5]. With the introduction of deep learning methods in radiology, features such as detection, classification, and segmentation have been integrated into imaging. A convolutional neural network (CNN) is a frequently used algorithm in these steps [6,7]. The traditional UNet architecture [8] extended to handle volumetric input has 2 phases: the encoder part of the network where it learns representational properties at different scales and gathers contextual information, and the decoder part where it extracts information from the observed context and previously learned features. Skip connections used between the corresponding encoder and decoder layers enable the deep parts of the network to be trained efficiently and allows the comparison of the same receiver characteristics with different receiver areas [9]. Segmentation is often used in the first stage of image analysis. Image segmentation can be defined as separating an image into meaningful regions in which different features are kept [10]. In our study, we aimed to perform segmentation in orbital and periorbital lesions using deep learning methods.
Material and methods
Ethical approval for this study was obtained from the Ethics Committee of the Eskisehir Osmangazi University (No. 25403353-050.99-E.46807). Contrast-enhanced orbital MRIs taken between 2010 and 2019 were retrospectively screened from the picture archiving and communication system (PACS). The scans had been performed on 3 T (General Electric, Discovery 750 W with GEM Suit) and 1.5 T (Siemens, Magnetom Avanto) MRI devices. The axial contrast-enhanced T1-weighted sequences of 95 patients were examined. In cases of multiple MRI examinations, only one examination for each patient was included in the study. The imaging protocol was as follows: pixel resolution: 706 x 706; echo time (TE): 11 ms; repetition time (TR): 680 ms; window centre/window width: 446/945; slice thickness: 2.5 mm for 1.5 T, and pixel resolution: 705 × 705; echo time (TE): 9.5 ms; repe-tition time (TR): 578 ms; and window centre/window width: 3175/6351; slice thickness: 3 mm for 3T. A total of 302 axial sectional images obtained from 95 patients were included in the study. MR imaging of 42 patients was performed at 1.5 T, and MR imaging of 53 patients was performed at 3 T.
The mask images of the tagged regions were created and saved with the same names. The dataset was divided into 3: training, test, and validation. Finally, 110 slices obtained from 42 patients taken at 1.5 T were used in the training phase, 15 slices were used in the validation phase, and 12 slices were used in the testing phase. Also, 122 slices obtained from 53 patients taken at 3 T were used in the training phase, 20 slices were used in the validation phase, and 23 slices were used in the testing phase.
In total, 232 of 302 images were used in training, 35 in validation, and 35 in the test phase. The number of training and validation data was increased 4 fold by applying data augmentation (horizontal, vertical, and both). As a result, the total number of training and validation data increased to 928 and 140, respectively. Pytorch UNet was used to train the data with 100 epochs, and the model that provided the best results, i.e. the 77th epoch model, was recorded. Digital imaging and communications in medicine (DICOM) is a digital data format standard developed to be used in the storage, display, and analysis of 2- and 3-dimensional scientific data obtained from medical imaging devices [11]. In this study, there were 302 images in the raw dataset of grey-space DICOM images. While these images were in the form of a square with a size of 705 × 705 and 706 × 706 pixels, all images were converted to a 512 × 512 pixel standard so that the segmentation process would give better results.
After the mask images of the tagged regions of the images were created and saved with the same names, the dataset was divided into 3 parts as training, verification, and test at a ratio of 8 : 1 : 1, respectively. The reliability of the model was increased by increasing the sample size in the training and validation datasets 4 fold by applying the augmentation method. In this process, horizontal, vertical, and both horizontal and vertical symmetries of each image are taken. This increased the training dataset volume from 232 to 928 images and the verification dataset volume from 35 to 140 images.
The traditional Pytorch UNet architecture extended to handle volumetric input was used to perform training with 100 epochs. Skip connections used between the corresponding encoder and decoder layers allowed for the deep parts of the network to be trained efficiently and facilitated comparison of the same receiver characteristics with different receiver areas [8]. The threshold value of the intersection over union (IoU) statistic (the Jaccard index), which measures the similarity between finite sample sets and is calculated by dividing the size of the intersection by the size of the combination of the sample sets [12], was selected as 50%, and the results were calculated.
Statistical analysis, model construction, training, and validation
Statistical analysis was evaluated with the SPSS v.22 package program (IBM Corp., Chicago, USA). Descriptive statistics were given as a mean ± standard deviation.
In this study, an AI model was designed using UNet inception architecture to segmentation. The training process was handled on a PC equipped in the Eskisehir Osmangazi University Faculty AI Laboratory, which included a Dell PowerEdge T640 Calculation Server (Dell Inc., Texas), a Dell PowerEdge T640 GPU Calculation Server with 32 GB RDIMM, an NVIDIA Tesla V100 16G Passive GPU display card (Dell Inc., Texas), and a Dell PowerEdge R540 Storage Server (Dell Inc., Texas).
Results
A total of 95 patients with orbital lesions were included in the study. The mean age of the patients was 45.36 ± 10.23 years. Thirty-seven patients were female, and 58 patients were male. Fifty-six of these patients were diagnosed radiologically and pathologically while the remaining 39 did not have a pathological diagnosis. Multiple sections were taken from the single view of each patient. Each patient had a single lesion. Of the orbital lesions, 12 were basal or squamous cell carcinomas of the skin originating from the eyelid and around the eye, 20 were orbital multiple myelomas, 15 were cavernous venous malformations, and 9 were cysts. The remainder of the lesions belonged to patients who were not followed up. Segmentation was applied to the lesions. The 77th epoch was identified as the best model providing the following results: true positives, 23; false positives, 4; and false negatives, 8. Examples of the segmentation process and UNet architecture of the accurately identified lesions are shown in Figures 1 and 2. The precision, sensitivity, and F1 score values are given in Table 1. A flow chart of the model was also constructed (Figure 3).
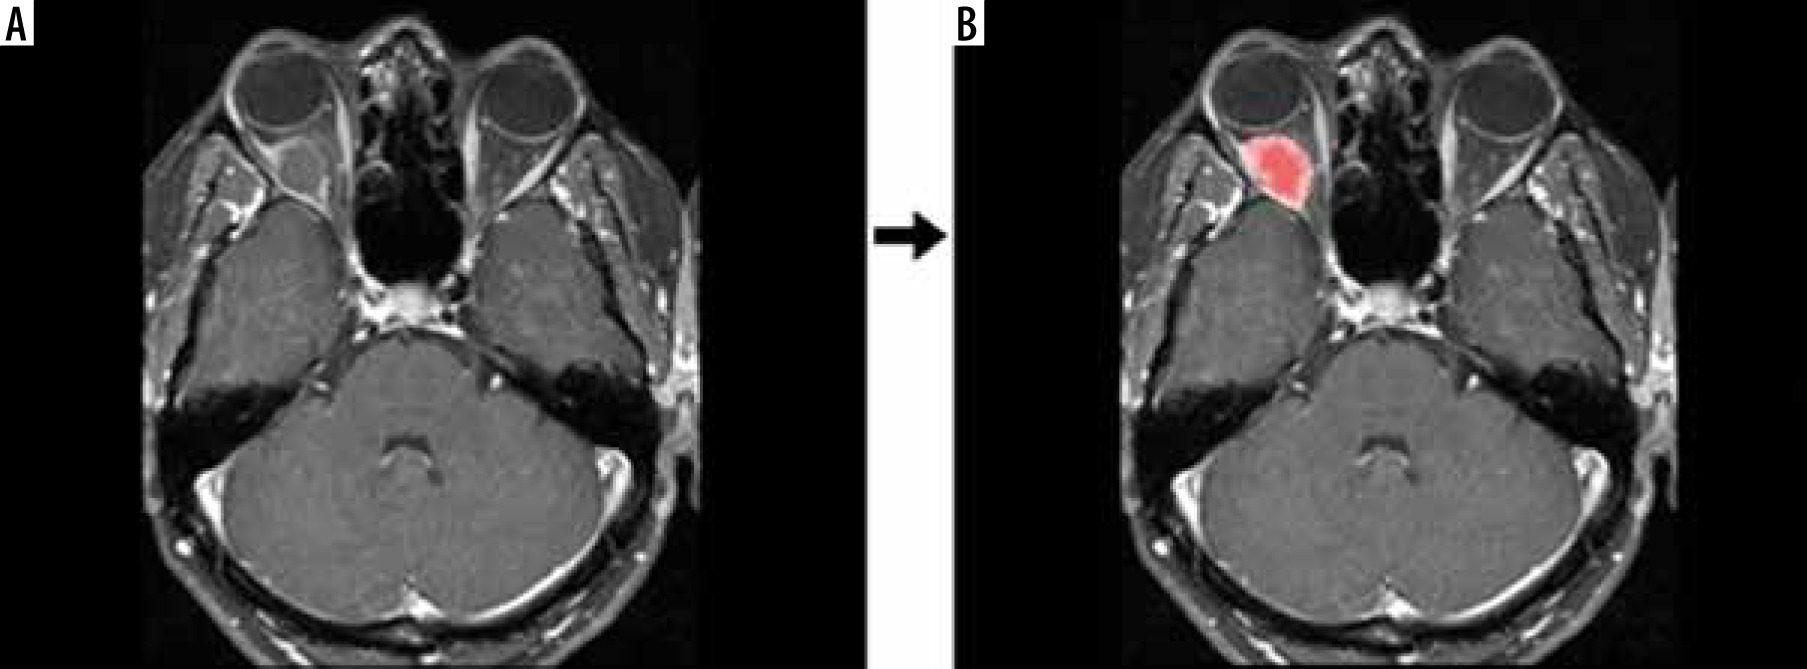
Figure 1
Raw data (A) and segmentation (B) output of the contrast-enhanced, T1-weighted, fat-suppressed, axial image of a patient who was primarily considered to have a dermoid cyst, which was not pathologically confirmed

Discussion
The current study was designed according to the segmentation of orbital and periorbital lesions.
The precision, sensitivity, and F1 score were determined as 0.85, 0.74, and 0.79, respectively. In our study, segmentation revealed the most successful model to be the 77th epoch. Because there are few studies on this subject in the literature, orbital and periorbital lesions are rarely detected, and segmentation and artificial intelligence are a current topic, our study makes a great contribution to the literature. Of course, better results will be obtained as a result of segmentation studies with more homogeneous patient groups.
Manual segmentation is widely used in many clinics, but it is a time consuming and demanding task with results varying between operators. There are many segmentation studies on CT. Manual segmentation is also widely used in the treatment phase in radiation oncology [13,14]. Particularly in the segmentation process performed in non-contrast CT, there may be difficulties due to low soft tissue contrast [15]. The soft tissue contrast resolution of MRI is better than that of CT [16]. Therefore, the segmentation process can be performed more successfully in MRI examinations. In the literature, segmentation has been used in many radiology studies; however, we found no segmentation study in orbital and periorbital lesions in MRI. The literature contains only a few studies on segmentation regarding the orbit. In 2 of these studies, segmentation was performed in optical coherence tomography [17,18]. In one of them, 3D images were used, and the segmentation performance and detection performance were measured in this study [18].
In another study, the segmentation procedure was undertaken on oxygen-induced retinopathy images, and in contrast to our study, it was performed automatically [19].
Segmentation is performed on either whole-volume images or cross-sectional views [20]. Our segmentation process consisted of the cross-sectional views of the lesions. We used the axial sections of MRI images obtained from the PACS of our hospital. Since volumetric MRI studies can take a longer time during imaging, volume images were not available for all patients. With the developing MRI technologies, volume images are more commonly used [21], which can help extend the use of segmentation in orbital lesions over volume images in the future. Similarly, Brown et al. [22] performed manual and automatic segmentation on orbital fat tissue on T1-weighted images using 3 T and 1.5 T MRI, and compared these processes and used them for calibration. In another study, segmentation was performed in the inner boundary of the bony orbit in both CT and MR exa-minations. In this study, CNN was used, and time was saved with automatic segmentation compared to manual segmentation [23].
In our study there was no categorization in terms of lesions, and they were all collected in a single group. Because there were no groups of similar number showing a homogeneous distribution, a single group was formed. This can be considered as one of the limitations of our study. Also, the small sample size, heterogeneity of pathologies, heterogeneity of image quality, and the use of augmentation to increase the volume of data should be counted as study limitations in our study.
In the presence of groups with a sufficient and homogeneous distribution, segmentation can also be compared between these groups.
Automatic segmentation will reach an important stage in the future in head and neck radiology and is clinically important because it will provide a significant time advantage when evaluating MRI.
Conclusions
We achieved successful results in segmentation by deep learning method in orbital and periorbital lesions. When datasets with the same pathology are obtained in orbital and periorbital lesions, a correlation between the MRI images and pathological diagnosis can be observed in the segmentation process. We consider our study to be one of the pioneering works on this subject, which will shed light on further segmentation studies to be carried out in orbital MRI images.