Introduction
Breast cancer is the most common malignancy worldwide, accounting for 14% of all new cancer cases in the world in 2016 [1]. The incidence of breast cancer is mainly observed in women over 40–49 years of age [2]. The main risk factors are age [3], positive family history of cancer [4], early menarche [5] and late childbearing [4, 5], woman’s age at menopause [6], and race [7], while in 75–80% of women no risk factor is found [8]. Regarding the socio-economic factors, increased incidence of breast cancer was found for women with higher education [9–12], highest income [10], and creative core occupation [10, 11]. A recent study suggests an association between socio-economic factors and breast cancer and, more specifically, proves that breast cancer tends to be higher across richer countries. Women from richer countries are prone to higher demand for treatments represented by oral contraceptives (OCs) and hormone therapy (HT), factors which increase the risk of breast cancer [13].
Prior studies have found increased risk of stroke in patients with breast cancer, who were given radiotherapy (RT). More specifically, it has been found that RT to the supraclavicular lymph nodes gives a significant dose of radiation to the proximal carotid artery, which increases the risk of carotid stenosis and ischaemic stroke [14]. Moreover, cancer is not a well-established independent risk factor for arterial thromboembolism, and cancer patients do not systematically receive treatments to prevent myocardial infarction and stroke, resulting in an increased risk for such cases in cancer patients [15–17].
This work studies breast cancer and stroke in the United States in the years 2007–2017 in order to find statistically significant predictors for cancer and a possible link between breast cancer and stroke.
Material and methods
The data used in this work come from the National Health Interview Survey dataset [18] and cover the period 2007–2017. The number of breast cancer and stroke patients examined was 37,634 and 71,227, respectively.
Statistical analysis
The statistical methods used to extract the results of this work are the χ2 test for categorical and one-way analysis of variance (ANOVA) for continuous variables, to check the statistical significance of human breast cancer in relation to selected characteristics of patients such as gender, age, race, origin, education, family income, poverty status, health insurance coverage, place of residence, and region. Factors that determine the prevalence of cancer were assessed by using multiple logistic regression analysis. To better assess the predictors of cancer, we used data from patients with a new diagnosis of cancer compared to a matched cohort of patients without cancer. Predictors were represented using the OR and 95% confidence intervals, and p < 0.05 was considered as statistically significant. The Pearson correlation coefficient was used for the relationship between cancer and stroke for the years 2007–2017. The study was carried out using the IBMSPSS 25 software package for Windows.
Results
To check the zero hypotheses that the mean of the patients in the United States with malignant neoplasms of the breast did not differ according to their socio-economic characteristics, the χ2 test and one-way analysis of variance (ANOVA) were used. As shown in Table I, there is a statistically significant difference in the number of malignant neoplasms of the breast in relation to gender, and it occurs mainly in women (99.4%). Moreover, the age group with the most frequent occurrence of breast cancer is from 45 to 64 years old (69%), while the most common origin and race is white (88.9%), not Hispanic or Latino (48.6%). The education level that was found to be statistically significant was “less than a high school diploma” (13.2%). Employment status that was found to be statistically significant was “Not employed but has worked previously” (49.4%). The financial status that was found to be statistically significant was “not poor”, with a family income of $35,000 or more (38.6%). Health insurance coverage was found to be statistically significant in both age groups under 65 years (76.5%) and 65 years and over (59.5%) was “private”. In addition, the marital status that the most breast cancer patients had was “married” (52.2%). Finally, the region with the most frequent occurrence of breast cancer was the south (35%), with a population size of one million or more (51.3%).
Table I
χ2 and one-way analysis of variance (ANOVA) test
Table II shows the multiple logistic regression analysis and odds ratios in order to find the predictors for the occurrence of breast cancer.
Table II
Statistically significant predictors of breast cancer in US using multivariate logistic regression
As shown in Table II, all prognostic factors are statistically significant (p < 0.05). According to multiple logistic regression, the risk of breast cancer is significantly higher with female gender (odds ratio (OR) = 1.0), age over 75 years and 45–64 years old (OR 1.0 and 0.99, respectively), white race (OR = 1.94), and high school diploma education status (OR = 1.2). Moreover, those who were unemployed but had worked previously had twice the risk of developing breast cancer (OR = 2.0). In addition, the risk of cancer is significantly higher with family income “$35,000–$49,999” (OR = 1.29), poverty status “not poor” (OR = 1.0), and health insurance coverage “Medicaid” under 65 years old and “Private” over 65 years old (OR = 1.95 and OR = 1.27, respectively). Widowed women had 11 times the risk of developing breast cancer (OR = 11.3). Finally, the risk of breast cancer was significantly higher in the region “northeast” (OR = 1.2) and place of residence “not in a metropolitan statistical area” (OR = 1.0).
Figure 1 shows the trends in breast cancer and stroke during the years 2007–2017 in the United States. The incidence of breast cancer and stroke continued to increase from 2007 to 2017.
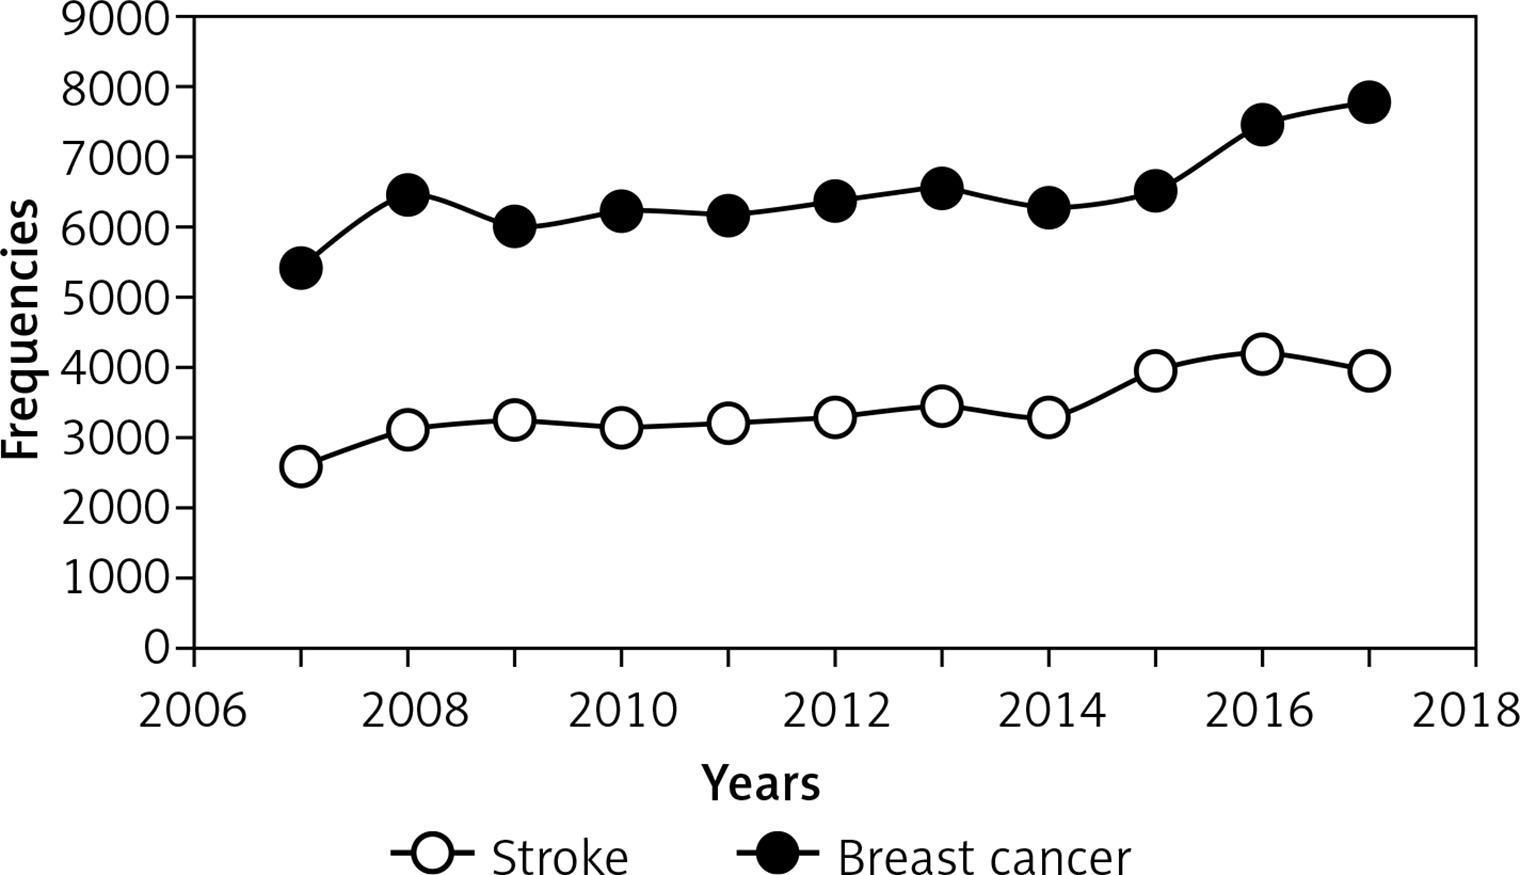
Table III shows the Pearson correlation coefficient among the total number of breast cancer and stroke patients for the years 2007–2017. As can be seen from Table III, the incidence of cancer is statistically significant with stroke (p < 0.05). The Pearson correlation coefficient between the total number of cancer patients and stroke patients is 0.872, which indicates that there is a strong correlation between breast cancer and stroke.
Discussion
Increasing attention should be given to the increasing number of breast cancer patients in the United States during the years 2007–2017. It has been noted that the characteristic of patients with the highest risk is their marital status, and more specifically, it was found that widowed women have 11 times higher risk of developing breast cancer (OR = 11.3). Moreover, employment status plays a crucial role in developing this type of cancer. Women who were unemployed but had worked previously had twice the risk of developing breast cancer (OR = 2.0). Finally, white race is a prognostic risk for this type of cancer; it was found that white women in the U.S. have two times higher risk of developing breast cancer (OR = 1.94).
The importance of this study lies in the association of multiple socio-economic variables with cancer, which reflects the complexity and multidimensional nature of deprivation as well as the various roles of these dimensions throughout life, which in turn reflects the longest gestation period for cancer. More specifically, we found that partner and work deprivation were two determinants in an adult’s life, which rapidly increased the risk of cancer. We also found that not only deprivation but also the death of a partner plays a key role in the increased risk of developing cancer.
Moreover, we found a link between breast cancer diagnosis and stroke. One possible explanation is that cancer can cause a hypercoagulable state through circulating microparticles, secretion of proliferative factors, and alterations in platelet activity and endothelial function [19, 20]. Additionally, several cancer treatments, particularly platinum-based compounds, may increase thrombotic risk [19, 21].
In conclusion, this paper has highlighted that different socioeconomic variables are associated with different cancer risks, while deprivation (of work and husband) proved to be the primary prognostic risk factor for cancer. Moreover, incident cancer is associated with an increased risk of stroke.