Introduction
Psoriasis is a long-term inflammatory illness that affects the immune system and affects about 2–3% of the world’s population. It causes a lot of physical, mental, and social problems [1, 2]. Clinically, it manifests as erythematous, scaly plaques due to keratinocyte hyperproliferation, aberrant differentiation, and sustained immune cell infiltration [3]. Psoriasis is now known to be a systemic inflammatory illness that often goes together with metabolic syndrome, cardiovascular disease, and other immune-mediated comorbidities [4–7].
Psoriatic arthritis (PsA) is one of the most serious systemic effects of psoriasis, affecting up to 30% of people with the disease [8, 9]. PsA is a long-term inflammatory arthritis that affects joints in the hands and feet as well as the spine. If it is not recognised and treated early, it can cause permanent joint damage and loss of function [8, 10]. There is more and more evidence that psoriasis and PsA are two separate clinical manifestations that are part of the same disease spectrum. This is because they share genetic and immunological processes [11, 12].
Recent research in immunopathogenesis has shown that the interleukin-23/interleukin-17 (IL-23/IL-17) axis is a key route in both psoriasis and PsA [13, 14]. IL-17-related cytokines cause keratinocytes to become active, draw in neutrophils, start new blood vessels, and keep inflammation going in skin and synovial tissues [15]. Dysregulation of nuclear factor-kappa B (NF-κB) signalling exacerbates chronic inflammation by promoting keratinocyte proliferation and the generation of pro-inflammatory cytokines.
Genome-wide association studies and other genetic investigations have found many susceptibility loci that play a role in immune regulation and cytokine signalling [11, 16, 17]. TRAF3IP2 has become one of the most important genetic risk factors for both psoriasis and PsA [18–20]. Act1 is an important adaptor protein for IL-17 receptor signalling that TRAF3IP2 encodes. It helps activate the NF-κB and MAPK pathways downstream [21, 22].
Methotrexate remains a commonly used systemic treatment for moderate-to-severe psoriasis and PsA, despite the availability of targeted biologic therapies. This is because it is effective at modulating the immune system, is inexpensive, and has been used in clinical practice for a long time [23, 24]. MTX works by inhibiting lymphocyte proliferation, modulating cytokine production, and suppressing inflammatory pathways that are important to psoriasis [23, 24].
Aim
This study aims to examine the correlation between the TRAF3IP2 (rs13190932) polymorphism and the susceptibility to psoriasis and psoriatic arthritis, its link with disease severity and systemic inflammatory and metabolic indicators, and its influence on the short-term response to methotrexate therapy.
Material and methods
Study design and setting
This prospective observational cohort study was carried out at a tertiary-care dermatology facility in Egypt from February 2025 to December 2025. The research sought to assess the correlation between the TRAF3IP2 (rs13190932) gene polymorphism and susceptibility to disease, inflammatory load, and short-term response to methotrexate (MTX) treatment in individuals with psoriasis and PsA.
Ethical considerations
The institutional medical ethics committee approved the study protocol. Written informed consent was obtained from all individuals before enrolment.
Study population
The study included: 120 patients with psoriasis, including 40 patients with psoriatic arthritis, 40 healthy controls matched for age and sex.
Inclusion criteria
The patients must be between the ages of 18 and 70, have psoriasis vulgaris (moderate or severe) or psoriatic arthritis, have a PASI score of at least 7, and be eligible for methotrexate treatment. The therapeutic dose for most patients is 12.5–25 mg/week. Patients were instructed to take folic acid daily except on the day of the MTX dose.
Exclusion criteria
Hepatic or renal impairment, other autoimmune illnesses. Patients currently undergoing immunosuppressive or systemic therapies. Patients with known genetic disorders. Patients with active or uncontrolled infections. Pregnancy or lactation and methotrexate contraindications. Previous TRAF3IP2 genetic testing.
Clinical assessment
A comprehensive medical history was collected for all patients, encompassing disease start, duration, progression, prior therapies, joint involvement, and familial history of psoriasis or autoimmune disorders.
The Disease Activity Index for Psoriatic Arthritis (DAPSA) was used to measure the activity of psoriatic arthritis. It incorporates counts of sensitive and swollen joints, levels of C-reactive protein (CRP), the patient’s overall estimate of disease activity, and the severity of pain [25].
The Psoriasis Area and Severity Index (PASI) was used to rate the severity of psoriasis. It looks at erythema, induration, desquamation, and body surface area involvement and gives a score from 0 to 72 [26]. Clinical evaluations were conducted at baseline and following 12 weeks of MTX treatment.
Laboratory investigations
Every participant had tests for liver and renal function, lipid profiles, inflammatory markers (CRP and erythrocyte sedimentation rate (ESR)), and complete blood counts.
Genotype analysis
To conduct genetic studies, participants, including controls, provided venous blood (2 ml) in aseptic EDTA vacutainers was stored at – 80°C until batch processing. Real-time PCR and TaqMan SNP genotyping kits genotyped TRAF3IP2 (rs13190932).
DNA extraction
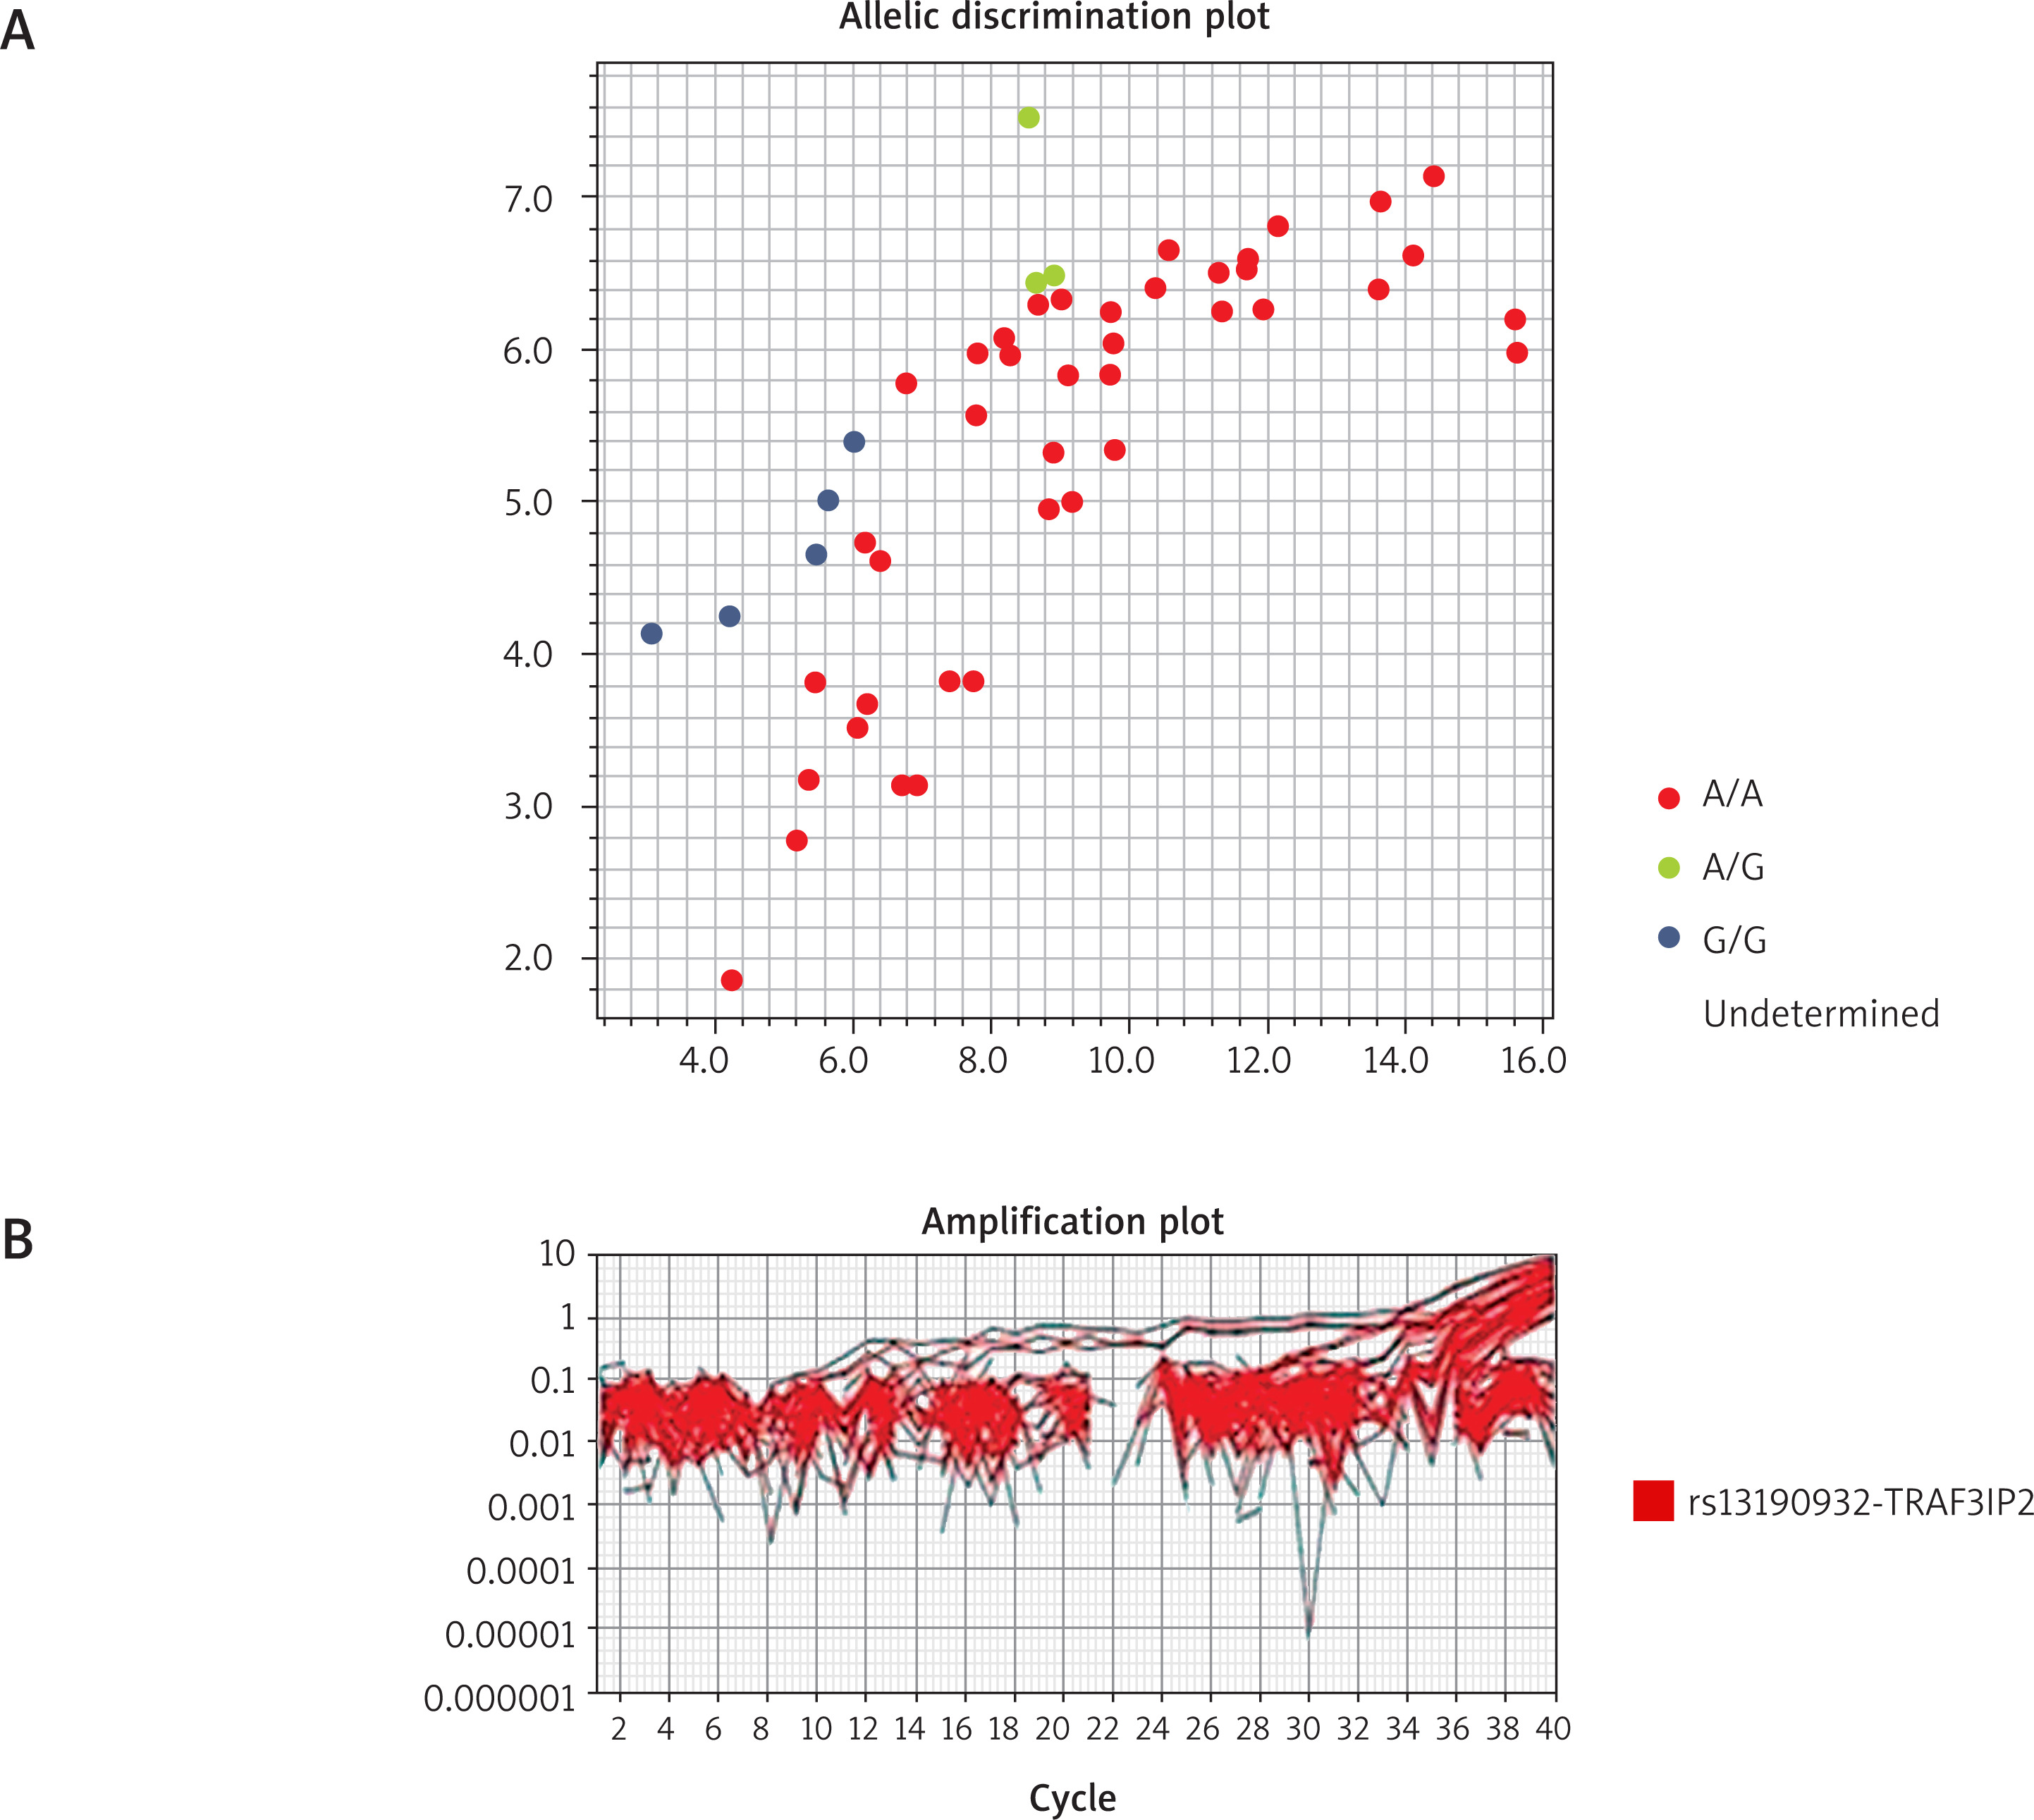
The QIAamp DNA Blood Mini Kit (Cat. No.: 51104, Qiagen, Valencia, CA, USA) extracted genomic DNA from patients and healthy controls. To genotype DNA, 10 µl master mix, 1.25 µl primer/probe mix, 3.75 µl DNase-free water, and 5 µl genomic DNA was used in PCR reactions. A negative control used DNase-free water alone. Denaturation at 95°C for 10 min, 40 cycles of 94°C for 15 s, 50°C for 60 s, and 72°C for 2 min, and a final extension at 72°C for 1 min were the cycling conditions. A 7500 real-time PCR equipment (Applied Biosystems Inc., USA, version 2.0.1) was utilised. TaqMan Genotyping Master Mix (Thermo Fisher Scientific, cat. no. 4371355) was used according to the manufacturer’s instructions. To identify the A/G variation in CAGGTGACCTGCCGGGATACAGGCC[A/G]CTG. The instrument software automatically named genotypes (AA, AG, GG) using fluorescence clustering and exported representative amplification traces and allelic discrimination plots as Figures 1 A, B.
Figure 1
Using TaqMan real-time PCR to genotype the TRAF3IP2 (rs13190932) polymorphism. A – An allelic discrimination plot showing AA, AG, and GG genotype clusters that show allele-specific fluorescence signals for the A and G alleles. B – Amplification curves showing allele-specific fluorescence signals for the A and G alleles
Sample size calculation
We utilised the G*power 3 algorithm [27] to calculate the sample size. An estimated minimum sample size of 160 participants was required to find an effect size of 0.3, an α error probability of 0.05 and an 80% power to evaluate TRAF3IP2 (rs13190932) polymorphism in psoriasis and PsA. Each participant was allocated to one of four groups. In the first, there were 40 patients with moderate psoriasis; in the second, 40 patients with severe psoriasis; in the third, 40 PsA patients; and in the fourth, 40 control group patients.
Statistical analysis
Data were analysed using SPSS version 27. The Shapiro-Wilk test was used to check for normality, and it showed that continuous variables did not have a normal distribution. Consequently, the data were represented as median and interquartile range. The Mann-Whitney U test or Kruskal-Wallis test with Bonferroni correction was used to compare groups. The Wilcoxon signed-rank test was used for within-group comparisons. Categorical variables were presented as frequencies and percentages. Spearman’s rank correlation was used to assess correlations. A two-tailed p-value of less than 0.05 was deemed statistically significant. We assessed whether the genotype distributions were in Hardy-Weinberg equilibrium.
Results
Demographic data of the studied groups
No significant differences were observed between psoriasis patients and controls in demographic or lifestyle parameters (Table 1).
Table 1
Demographic data of the studied groups
[i] Variables with non-normal distribution were analysed using non-parametric tests. E or FEExact tests were applied when χ2 assumptions were violated. The data were presented as median and quartiles [median (Q1–Q3)] for non-parametric data and for categorical data was presented as number (percentage), p-value– comparison between the two studied groups using Mann-Whitney U test “U” for nonparametric continuous data, p-value–comparison between categorical data using χ2 test “Chi” or Fisher’s Exact test “FE” or Exact test “E”, p-value > 0.05 considered statistically not significant, *p-value < 0.05 considered statistically significant, **p-value < 0.01 considered highly statistically significant.
Laboratory findings according to disease severity
Laboratory abnormalities increased progressively for patients across moderate psoriasis, severe psoriasis, and PsA, with PsA patients having the most inflammatory and metabolic conditions. Laboratory differences were seen mostly between patient categories and controls in pairwise analysis. Patients with severe psoriasis had lower haemoglobin and higher white blood count (WBC) counts compared to patients with moderate psoriasis and controls (p < 0.003). Platelet counts differed significantly only between PsA patients and controls (p = 0.009). PsA patients had greater total cholesterol, low-density lipoprotein (LDL), and triglycerides and lower high-density lipoprotein (HDL) compared to patients with moderate psoriasis and controls (p ≤ 0.006). All patient groups had higher triglycerides than controls (p < 0.001). Compared to controls, all patient groups had significantly elevated inflammatory markers (CRP and ESR), with greater CRP separating patients with moderate from those with severe psoriasis and PsA (p ≤ 0.001). Liver enzymes (ALT, AST) and total bilirubin were significantly higher in patients with PsA and severe psoriasis compared to controls and patients with moderate psoriasis (p ≤ 0.021). Although all readings were within normal clinical ranges, certain comparisons showed minor but statistically significant variations in creatinine and urea (Table 2).
Table 2
Laboratory data distribution between patients’ subgroups and controls
| Parameter | Diagnosis | P-value | |||
|---|---|---|---|---|---|
| Moderate (n = 40) | Severe (n = 40) | PsA (n = 40) | Control (n = 40) | ||
| CBC parameters | |||||
| Hb [g/dl] | |||||
| Pre-treatment | |||||
| Min.–max. | 12.08–13.43 | 11.53–12.98 | 11.08–12.77 | 12.8–14 | |
| Median (Q1–Q3) | 12.48 (12.22–12.95) | 12.29 (11.96–12.63) | 12.06 (11.46–12.59) | 13.3 (13.1–13.8) | < 0.001**H |
| Follow-up 12w | |||||
| Min.–max. | 12.3–13.6 | 11.8–13.26 | 11.21–12.9 | ||
| Median (Q1–Q3) | 12.73 (12.5–13.22) | 12.47 (12.12–12.82) | 12.22 (11.66–12.73) | < 0.001**H | |
| P-value2 | < 0.001**W | < 0.001**W | < 0.001**W | ||
| WBC [× 103/μl] | |||||
| Pre-treatment | |||||
| Min.–max. | 7.86–8.47 | 8.54–9.48 | 8.46–9.73 | 3.1–4.6 | |
| Median (Q1–Q3) | 8.24 (8.13–8.39) | 9.09 (8.77–9.32) | 8.93 (8.74–9.29) | 4 (3.54–4.27) | < 0.001**H |
| Follow-up 12w | |||||
| Min.–max. | 6.34–7.23 | 7.25–8.04 | 7.3–8.57 | ||
| Median (Q1–Q3) | 6.83 (6.7-6.98) | 7.66 (7.44-7.87) | 7.78 (7.52-8.11) | < 0.001**H | |
| P-value2 | < 0.001**W | < 0.001**W | < 0.001**W | ||
| PLTs [× 103/μl] | |||||
| Pre-treatment | |||||
| Min.–max. | 224–265 | 190–275 | 205–264 | 224–279 | |
| Median (Q1–Q3) | 244 (239.25–254) | 243.5 (216.25–265.75) | 243 (218.75–247) | 248.5 (233.75–261.5) | 0.091H |
| Follow-up 12w | |||||
| Min.–max. | 190–264 | 151–274 | 164–264 | ||
| Median (Q1–Q3) | 241.5 (218–252.75) | 238 (184.25–266) | 240.5 (189–247.5) | 0.043*H | |
| P-value2 | 0.027*W | 0.010*W | 0.008**W | ||
| Lipid profile parameters | |||||
| Cholesterol [mg/dl] Pre–treatment | |||||
| Min.–max. | 186–215 | 192–215 | 191–218 | 185–205 | |
| Median (Q1–Q3) | 195 (189.5–211.75) | 201 (194.5–207) | 205 (198–213.75) | 197.5 (191–201.75) | < 0.001**H |
| HDL [mg/dl] Pre–treatment | |||||
| Min.–max. | 30–45 | 30–40 | 30–35 | 40–53 | |
| Median (Q1–Q3) | 38.5 (33.25–42.75) | 35.5 (32.25–37) | 32 (31–33) | 44.5 (41.25–48.75) | < 0.001**H |
| LDL [mg/dl] Pre–treatment | |||||
| Min.–max. | 90–105 | 90–110 | 96–110 | 74–103 | |
| Median (Q1–Q3) | 99 (95–103.75) | 103 (93.25–106) | 104 (100–109) | 91 (85–95.75) | < 0.001**H |
| Triglycerides [mg/dl] Pre–treatment | |||||
| Min.–max. | 145–165 | 151–165 | 155–165 | 133–149 | |
| Median (Q1–Q3) | 156 (150–163.75) | 159 (155.25–161.5) | 161.5 (157.5–163.75) | 145 (140–148) | < 0.001**H |
| Inflammatory markers parameters | |||||
| CRP [mg/dl] Pre–treatment | |||||
| Min.–max. | 15–26 | 105–133.6 | 70.5–136.3 | 2.3–3.5 | |
| Median (Q1–Q3) | 19.5 (17.5–22.75) | 120.8 (112.9–127.8) | 124 (94.78–134.23) | 3.1 (2.9–3.3) | < 0.001**H |
| ESR [mm/h] Pre–treatment | |||||
| Min.–max. | 40–53 | 45–65 | 50–65 | 17–24 | |
| Median (Q1–Q3) | 47.5 (44.25–51) | 52.5 (47.25–60.75) | 60.5 (52.25–64) | 21 (19.25–23) | < 0.001**H |
| Liver function tests | |||||
| ALT [U/l] | |||||
| Pre-treatment | |||||
| Min.–max. | 39–52 | 40–50 | 45–50 | 26–39 | |
| Median (Q1–Q3) | 44.5 (41.75–46.75) | 45.5 (43.25–47.75) | 47.5 (46–49) | 32 (30–35.5) | < 0.001**H |
| Follow-up 12w | |||||
| Min.–max. | 43–55 | 42–57 | 44–59 | ||
| Median (Q1–Q3) | 48 (45–51) | 51 (49.25–54.5) | 53.5 (49.5–56.75) | < 0.001**H | |
| P-value2 | < 0.001**W | < 0.001**W | < 0.001**W | ||
| AST [U/l] | |||||
| Pre-treatment | |||||
| Min.–max. | 37–52 | 38–50 | 42–50 | 20–34 | |
| Median (Q1–Q3) | 43.5 (40.5–45.75) | 44.5 (41.25–46) | 46.5 (45–48) | 28 (24–31) | < 0.001**H |
| Follow-up 12w | |||||
| Min.–max. | 38–51 | 43–57 | 42–56 | ||
| Median (Q1–Q3) | 45.5 (43–47.75) | 46 (44–49.75) | 49.5 (47.25–53) | < 0.001**H | |
| P-value2 | 0.004**W | < 0.001**W | < 0.001**W | ||
| Total bilirubin [mg/dl] | |||||
| Pre-treatment | |||||
| Min.–max. | 0.95–1.1 | 0.98–1.14 | 0.97–1.18 | 0.71–1.14 | |
| Median (Q1–Q3) | 1.04 (0.99–1.08) | 1.06 (1.02–1.12) | 1.09 (1.04–1.16) | 0.95 (0.73–1.1) | 0.009**H |
| Follow-up 12w | |||||
| Min.–max. | 1–1.24 | 1.12–1.28 | 1.07–1.32 | ||
| Median (Q1–Q3) | 1.09 (1.06–1.15) | 1.2 (1.16–1.22) | 1.21 (1.17–1.24) | < 0.001**H | |
| P-value2 | < 0.001**W | < 0.001**W | < 0.001**W | ||
| Kidney function tests | |||||
| Creatinine [mg/dl] | |||||
| Pre–treatment | 0.9–1.15 | 0.82–1.18 | 0.84–1.25 | 0.83–1.15 | |
| Min.–max. | 1 (0.96–1.08) | 1.03 (0.95–1.08) | 1.06 (0.98–1.18) | 1.01 (0.94–1.1) | 0.201H |
| Median (Q1–Q3) | |||||
| Follow–up 12w | |||||
| Min.–max. | 0.9–1.17 | 0.9–1.2 | 0.9–1.19 | ||
| Median (Q1–Q3) | 1.03 (0.95–1.11) | 1.1 (0.95–1.13) | 1.04 (0.95–1.12) | 0.105H | |
| P-value2 | 0.367W | 0.015*W | 0.286W | ||
| Urea [mg/dl] | |||||
| Pre-treatment | 18–24 | 16–24 | 18–26 | 17–25 | |
| Min.–max. | 21 (20–22.75) | 21.5 (20.25–23) | 23 (20–24) | 21 (20–22) | 0.054H |
| Median (Q1–Q3) | |||||
| Follow-up 12w | |||||
| Min.–max. | 18–26 | 18–26 | 19–25 | ||
| Median (Q1–Q3) | 21.5 (20.25–23.5) | 22 (20.25–24) | 22 (20–23) | 0.092H | |
| P-value2 | 0.355W | 0.026*W | 0.170W | ||
Variables with non-normal distribution were analysed using non-parametric tests. The data were presented as median and quartiles [median (Q1–Q3)] for non-parametric data and for categorical data were presented as number (percentage), p-value–comparison between more than two studied groups using Kruskal-Wallis 1-Way ANOVA (K samples) test “H” for nonparametric continuous data, significance values have been adjusted by the Bonferroni correction for multiple tests, for comparison between two intervals follow-up times in related samples among the patient group Wilcoxon Signed Ranks Test “W” for nonparametric continuous data was used. P-value > 0.05 considered statistically not significant,
TRAF3IP2 (rs13190932) genotype distribution
A statistically significant difference in genotype distribution was detected between psoriasis patients and controls (p = 0.003). The AA genotype was markedly more frequent among psoriasis patients (80%) compared to controls (60%), whereas the GG genotype was significantly less frequent (8.3% vs. 30%). Under the dominant model (AA + AG vs. GG), psoriasis patients showed a significantly higher prevalence of AA + AG genotypes (91.7%) than controls (70%) (p < 0.001; OR = 4.543, 95% CI: 1.780–11.593). Allelic analysis revealed a significantly higher frequency of the A allele in psoriasis patients (85.8%) compared to controls (65%), and a lower frequency of the G allele (14.2% vs. 35%), with a significant difference between groups (p < 0.001; OR = 3.262, 95% CI: 1.817–5.858), suggesting a potential association of the A allele with increased psoriasis susceptibility (Table 3).
Table 3
Frequencies of genotypes and alleles of polymorphism between psoriasis patients and controls
| Variable | Polymorphism genotype, n (%) | Allele, n (%) | |||||||
|---|---|---|---|---|---|---|---|---|---|
| AA | AG | GG | (AA + AG) | GG | AA | (AG + GG) | A | G | |
| Psoriasis (n = 120) | 96 (80%) | 14 (11.7%) | 10 (8.3%) | 106 (91.7%) | 10 (8.3%) | 96 (80%) | 24 (20%) | 206 (85.8%) | 34 (14.2%) |
| Control (n = 40) | 24 (60%) | 4 (10%) | 12 (30%) | 28 (70%) | 12 (30%) | 24 (60%) | 16 (40%) | 52 (65%) | 28 (35%) |
| P-value (χ2) | 0.003** (11.916) | < 0.001** (11.223) | 0.011* (6.400) | < 0.001** (16.671) | |||||
| OR CI | – | 4.543 (1.780–11.593) | 2.667 (1.229–5.787) | 3.262 (1.817–5.858) | |||||
Genotype distribution in controls was tested for Hardy–Weinberg equilibrium. The data were presented as number (percentage); p-value – comparison between psoriasis patients and control groups using χ2 test; OR – odds ratio, CI – confidence interval. P-value > 0.05 considered statistically not significant,
Frequencies of genotypes and alleles of polymorphism between psoriatic arthritis (PsA) patients and controls
Genotype and allele distributions of the studied polymorphism differed significantly between PsA patients and the control group. The AA genotype was significantly more frequent among PsA patients compared to controls (75% vs. 60%, p = 0.010), whereas the GG genotype was more prevalent in controls (30% vs. 5%), though this difference did not reach statistical significance (p = 0.152). Combined genotype analysis demonstrated a significantly higher frequency of (AA + AG) genotypes in PsA patients compared to controls (95% vs. 70%, p = 0.003), indicating an increased risk of PsA (OR = 8.143, 95% CI: 1.686–39.317). Allelic analysis revealed a significantly higher A allele frequency among PsA patients than controls (85% vs. 65%, p = 0.003), while the G allele was significantly more frequent in controls, suggesting a strong association between the studied polymorphism and susceptibility to psoriatic arthritis (Table 4).
Table 4
Frequencies of genotypes and alleles of polymorphism between psoriatic arthritis (PsA) patients and controls
| Variable | Polymorphism genotype, n (%) | Allele, n (%) | |||||||
|---|---|---|---|---|---|---|---|---|---|
| AA | AG | GG | (AA + AG) | GG | AA | (AG + GG) | A | G | |
| Psoriasis “PsA” (n = 40) | 30 (75%) | 8 (20%) | 2 (5%) | 38 (95%) | 2 (5%) | 30 (75%) | 10 (25%) | 68 (85%) | 12 (15%) |
| Control (n = 40) | 24 (60%) | 4 (10%) | 12 (30%) | 28 (70%) | 12 (30%) | 24 (60%) | 16 (40%) | 52 (65%) | 28 (35%) |
| P-value (χ2) | 0.010* (9.143) | 0.003** (8.658) | 0.152 (2.051) | 0.003** (8.533) | |||||
| OR CI | – | 8.143 (1.686–39.317) | 2.000 (0.769–5.198) | 3.051 (1.418–6.568) | |||||
Genotype distribution in controls was tested for Hardy–Weinberg equilibrium. The data were presented as number (percentage); p-value–comparison between psoriasis PsA patients and control groups using χ2 test; OR – odds ratio, CI – confidence interval. P-value > 0.05 considered statistically not significant,
Frequencies of genotypes and alleles of polymorphism between psoriasis (moderate, severe) patients, “PsA” patients and controls
Psoriasis subgroups and controls had significantly different genotype distributions (p = 0.0099). The AA genotype was more common in patients with severe (85%), moderate (80%) psoriasis, and PsA (75%) than controls (60%), but the GG genotype was far less common in patients with severe (10%), moderate (10%) psoriasis, and PsA (5%). Under the dominant model (AA + AG vs. GG), severe (90%), moderate (90%) psoriasis, and PsA patients (95%) had a significantly higher frequency of AA + AG genotypes than controls (70%) (p = 0.006), indicating a less common GG genotype in psoriasis patients. In contrast, the recessive model (AA vs. AG + GG) showed no significant difference (p = 0.0584). Allelic analysis showed that severe (87.5%), moderate (85%) psoriasis, and PsA patients (85%) had a significantly higher A allele frequency than controls (65%) and a significantly lower G allele frequency (12.5%, 15%, and 15% vs. 35%, respectively). Overall allele distribution differed significantly between groups (p = 0.0007).
Correlation analysis
Among psoriasis patients, baseline PASI showed significant positive correlations with baseline DAPSA (r = 0.411, p = 0.008), WBC count (r = 0.724, p < 0.001), LDL (r = 0.286, p = 0.002), CRP (r = 0.769, p < 0.001), ESR (r = 0.419, p < 0.001), ALT (r = 0.240, p = 0.008), and AST (r = 0.285, p = 0.002). While there was a significant negative correlation with BMI (r = –0.192, p = 0.036), haemoglobin level (r = –0.300, p = 0.001), and HDL (r = –0.301, p = 0.001).
Baseline DAPSA showed a significant positive correlation with CRP (r = 0.364, p = 0.021), while there was a significant negative correlation with total cholesterol (r = –0.349, p = 0.028).
Methotrexate dose demonstrated significant positive correlations with baseline PASI (r = 0.256, p = 0.005), WBC count (r = 0.269, p = 0.003), CRP (r = 0.451, p < 0.001), ESR (r = 0.191, p = 0.037), ALT (r = 0.443, p < 0.001), and AST (r = 0.441, p < 0.001). While there was a significant negative correlation with haemoglobin level (r = –0.300, p = 0.001) and HDL (r = –0.394, p < 0.001).
Relationships between baseline PASI, baseline DAPSA, and polymorphism genotype among the patient group
Baseline PASI scores were comparable across polymorphism genotypes, with medians of 22 (10.25–34) for AA, 20 (9–35) for AG, and 20 (11–23.75) for GG. PASI ranges were 7–45, 8–48, and 8–35, respectively, with no significant differences between genotypes (AA vs. AG p = 0.628; AA vs. GG p = 0.530; AG vs. GG p = 0.474).
Baseline DAPSA scores in the PsA subgroup were similar across polymorphism genotypes, with medians of 23 (18.75–32) for AA, 28 (20.25–32.25) for AG, and 22.5 (16–29) for GG. DAPSA ranges were 14–35, 19–33, and 16–29, respectively, with no significant differences between genotypes (AA vs. AG p = 0.529; AA vs. GG p = 0.458; AG vs. GG p = 0.356).
Treatment response
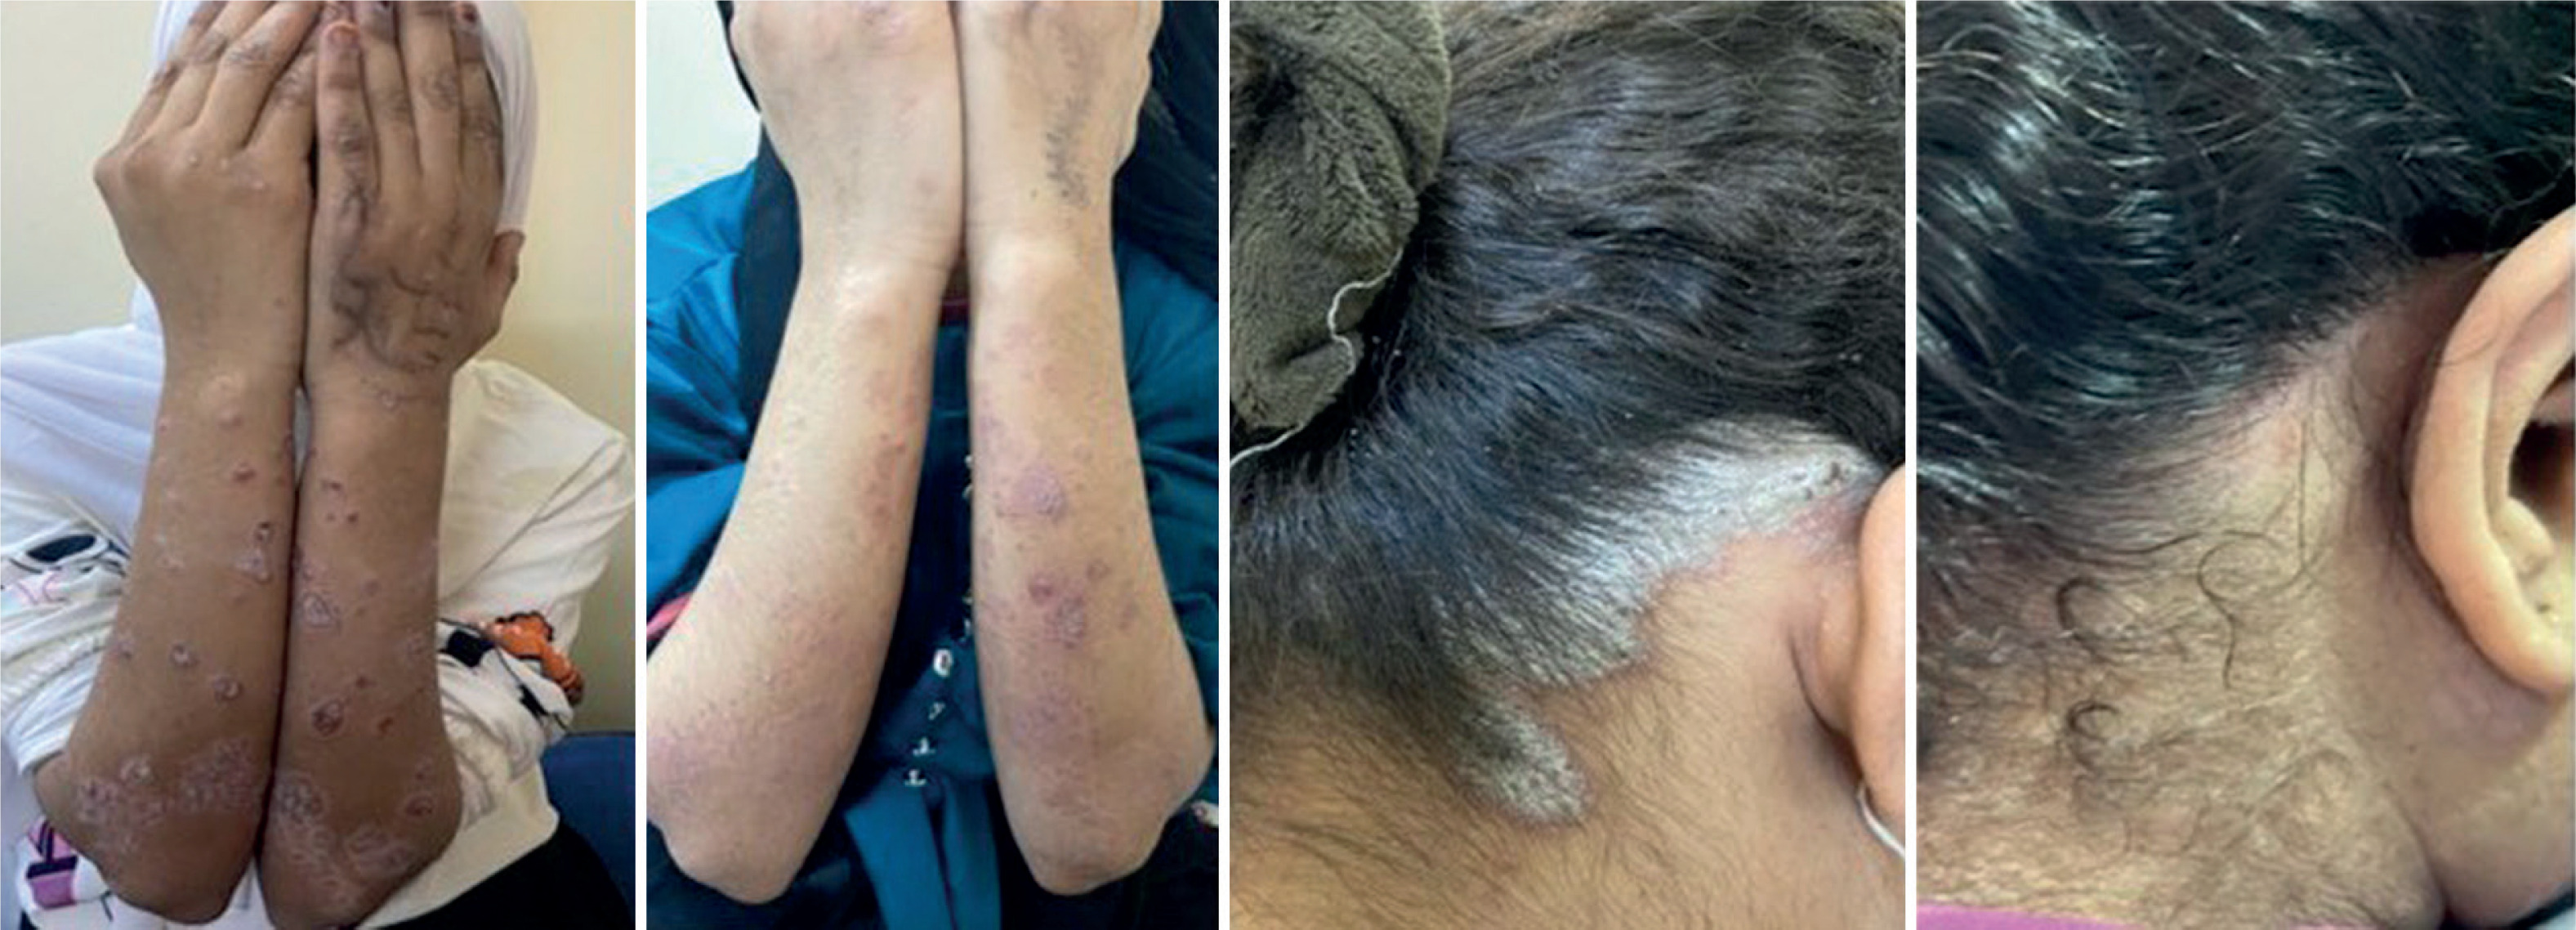
After 12 weeks of methotrexate treatment, PASI and DAPSA scores improved significantly, and most patients reached PASI 75 or higher. Figures 2–4 show examples of typical clinical responses.
Figure 2
Clinical amelioration of cutaneous and articular disease activity in a patient with psoriatic arthritis subsequent to methotrexate therapy. The baseline evaluation showed that the Psoriasis Area and Severity Index (PASI) score was 20 and the Disease Activity Index for Psoriatic Arthritis (DAPSA) score was 32. After 12 weeks of treatment with methotrexate (25 mg/week), there was a clear improvement in the patient’s condition, with the PASI score dropping to 8 and the DAPSA score dropping to 14
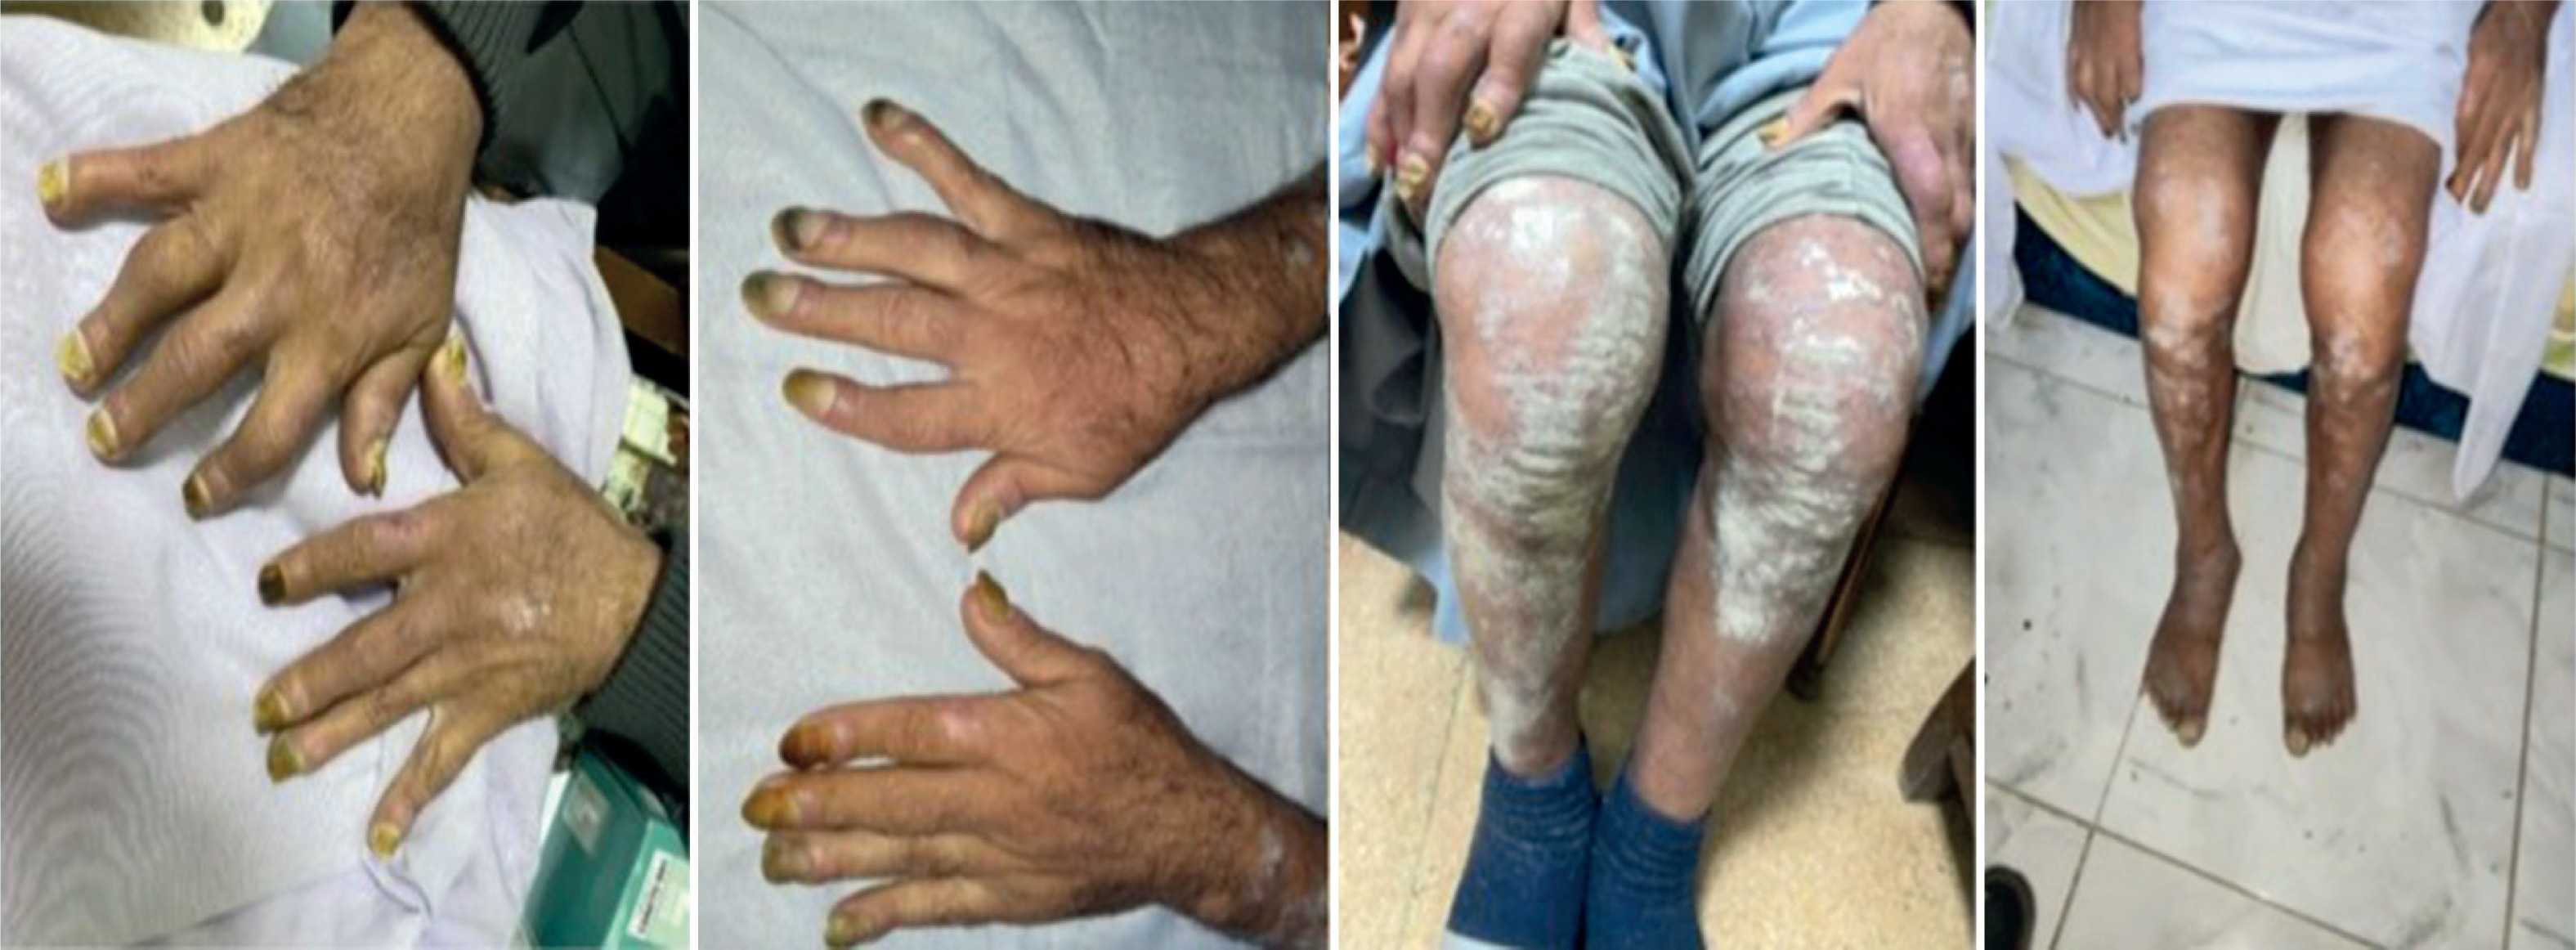
Figure 3
A typical clinical response to methotrexate for moderate plaque psoriasis. At the beginning, the patient’s psoriasis was moderate, with a PASI score of 12. After 12 weeks of methotrexate therapy (12.5 mg/week), lesions had almost completely resolved, and the PASI score after treatment was 1
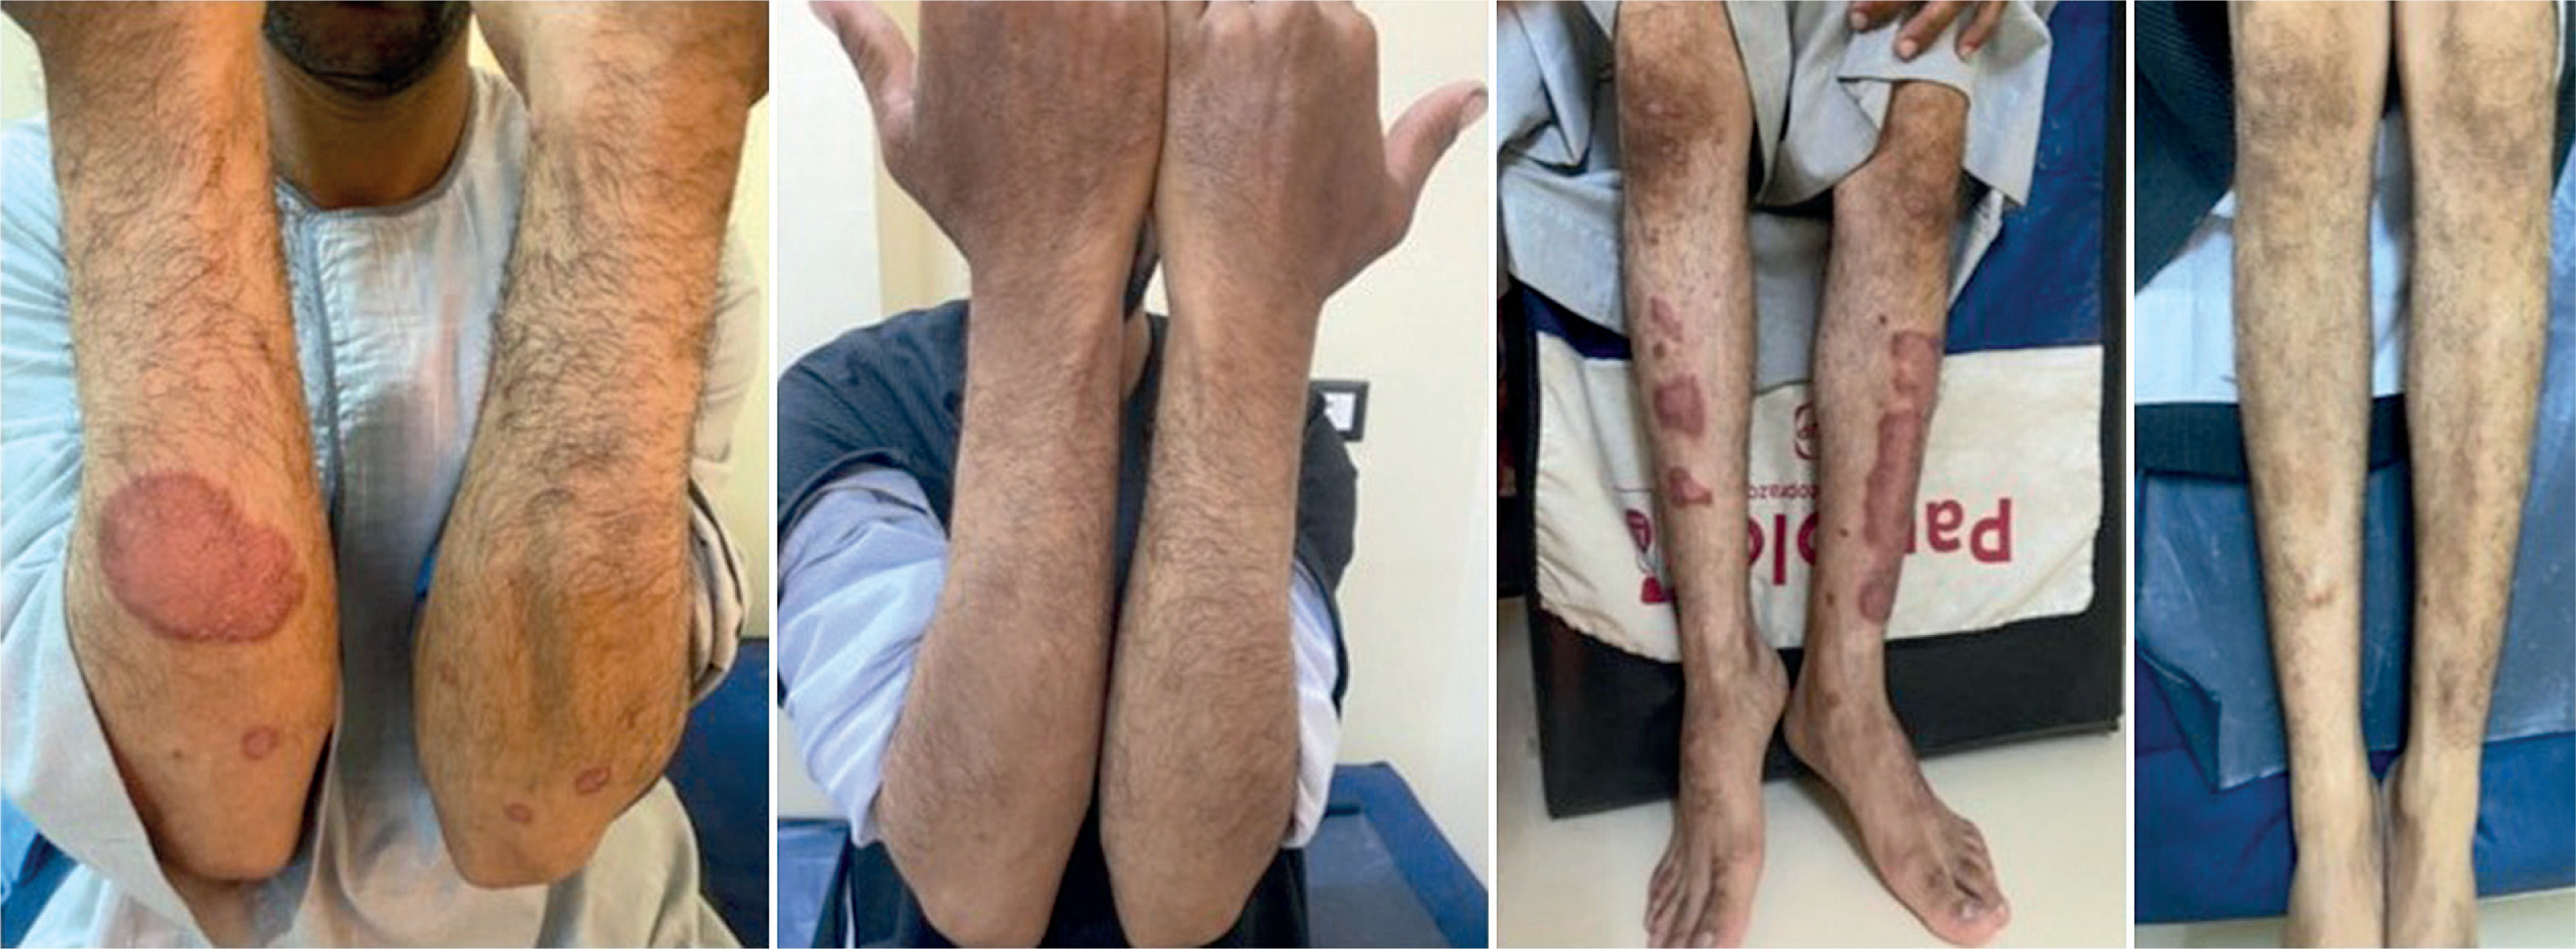
Figure 4
Significant clinical improvement in severe psoriasis after 12 weeks of methotrexate therapy. At baseline, the PASI score was 28, indicating severe plaque psoriasis. After 12 weeks of methotrexate therapy (12.5 mg/week), a notable improvement in disease severity was noted, evidenced by a reduction in PASI score to 6
Significant differences in disease severity and treatment response were observed among moderate psoriasis, severe psoriasis, and PsA subgroups (all p < 0.001). Baseline PASI was lowest in moderate psoriasis [median 9 (8–11.75)], higher in PsA [26.5 (14.5–35)], and highest in severe psoriasis [31.5 (25.75–35.75)]. PASI improvement was greatest in moderate psoriasis [92% (88.25–100)] compared with severe psoriasis [81% (78–87)] and PsA [81.5% (72–91.25)]. Complete clearance (PASI100) was most frequent in moderate psoriasis (40%), whereas PASI75 predominated in severe psoriasis (75%) and PsA (50%) (p < 0.001). In PsA patients, DAPSA scores markedly improved from a median of 25.5 (19–32) at baseline to 7 (3.25–13.75) post-treatment, with a median reduction of 70.2% (41.03–81.18). Methotrexate doses differed significantly among groups, being lowest in moderate psoriasis [12.5 (12.5–12.5) mg/week] and highest in PsA [18.75 (12.5–25) mg/week] (p < 0.001) (Table 5).
Table 5
Severity scores distribution between patients’ subgroups
| Parameter | Diagnosis | P-value | ||
|---|---|---|---|---|
| Moderate (n = 40) | Severe (n = 40) | PsA (n = 40) | ||
| Baseline PASI | ||||
| Min.–Max. | 7–12 | 20–45 | 10–48 | |
| Median (Q1–Q3) | 9 (8–11.75) | 31.5 (25.75–35.75) | 26.5 (14.5–35) | < 0.001**H |
| PASI change | ||||
| Min.–Max. | 88–100 | 49–96 | 59–100 | |
| Median (Q1–Q3) | 92 (88.25–100) | 81 (78–87) | 81.5 (72–91.25) | < 0.001**H |
| PASI Response Category | ||||
| 50 | 0 (0%) | 4 (10%) | 10 (25%) | < 0.001**E |
| 75 | 14 (35%) | 30 (75%) | 20 (50%) | |
| 90 | 10 (25%) | 6 (15%) | 8 (20%) | |
| 100 | 16 (40%) | 0 (0%) | 2 (5%) | |
| Baseline DAPSA | ||||
| Min.–Max. | 14–35 | |||
| Median (Q1–Q3) | 25.5 (19-32) | |||
| DAPSA Post-treatment | ||||
| Min.–Max. | 1–23 | |||
| Median (Q1–Q3) | 7 (3.25–13.75) | |||
| DAPSA change | ||||
| Min.–Max. | 34.29–96.3 | |||
| Median (Q1–Q3) | 70.2 (41.03–81.18) | |||
| Treatment (Methotrexate dose mg/week) | ||||
| Min.–Max. | 12.5–25 | 12.5–25 | 12.5–25 | |
| Median (Q1–Q3) | 12.5 (12.5–12.5) | 12.5 (12.5–25) | 18.75 (12.5–25) | < 0.001**H |
Variables with non-normal distribution were analysed using non-parametric tests. E or FE: Exact tests were applied when χ2 assumptions were violated. PASI change was calculated as a percentage improvement from baseline. The data were presented as median and quartiles [median (Q1–Q3)] for non-parametric data and for categorical data were presented as number (percentage), p-value–comparison between more than two studied groups using Kruskal-Wallis 1-Way ANOVA nonparametric continuous data, significance values have been adjusted by the Bonferroni correction for multiple tests, p-value–comparison between categorical data using χ2 test “Chi” or Fisher’s Exact test “FE” or Exact test “E”, p-value > 0.05 considered statistically not significant,
Relationships between PASI and DAPSA change and polymorphism genotype among all patients (n = 120)
In the overall patient cohort (n = 120), PASI change differed significantly across polymorphism genotypes. Patients with the AA genotype (n = 96) showed a median PASI change of 88 (Q1–Q3: 79.25–94.75; range: 49–100), those with AG (n = 14) had a median of 85 (77–89; range: 65–89), and GG carriers (n = 10) had a median of 80 (80–89; range: 80–92). A significant decrease in PASI change was observed in GG compared to AA (p 2 = 0.042), while comparisons between AA vs. AG (p 1 = 0.259) and AG vs. GG (p 3 = 0.476) were not statistically significant.
In the PsA subgroup, DAPSA change showed no significant differences between genotypes. Median DAPSA change in AA (n = 30) was 69.93 (Q1–Q3: 40.41–81.03; range: 34.29–96.3), in AG (n = 8) it was 73.88 (48.36–87.92; range: 36.67–96.3), and in GG (n = 2) it was 75.11 (range: 68.97–81.25). Comparisons between AA vs. AG (p 1 = 0.628), AA vs. GG (p2 = 0.508), and AG vs. GG (p3 = 0.694) were all non-significant.
Discussion
Psoriasis and PsA are now recognised as chronic systemic immune-mediated inflammatory illnesses, rather than diseases confined to the skin or joints. By combining genetic, clinical, and laboratory data, this this study provides further insight offers more understanding of the TRAF3IP2 (rs13190932) polymorphism’s influence on disease susceptibility, systemic inflammation, and therapeutic response.
A key finding of this study is that patients with psoriasis had significantly higher frequencies of the AA genotype and A allele of TRAF3IP2 (rs13190932) than healthy controls. This finding substantially corroborates earlier genome-wide association and candidate gene studies that identified TRAF3IP2 as a significant susceptibility locus for psoriasis and psoriatic arthritis across many populations [16–20]. These consistent findings underscore the significance of TRAF3IP2 as a substantial genetic risk factor in psoriatic illness.
TRAF3IP2 encodes Act1 (NF-κB activator 1), which is an important adaptor protein for signalling through the interleukin-17 (IL-17) receptor. Act1 facilitates the downstream activation of the NF-κB and MAPK pathways, which are pivotal to psoriatic inflammation [21, 22]. Dysregulation of this signalling axis promotes excessive cytokine production, keratinocyte hyperproliferation, and persistent immune activation, which are all signs of psoriasis and PsA [13–15]. Consequently, the genetic association identified in this study reasonable and underscores the pathogenic significance of the IL-17/Act1 pathway in illness onset.
Even though TRAF3IP2 (rs13190932) is strongly linked to disease susceptibility it did not have a meaningful effect on baseline PASI or DAPSA scores or overall disease severity. This indicates that the polymorphism predominantly influences disease onset rather than its progression or activity. These results align with previous studies indicating that many psoriasis susceptibility loci elevate disease risk without directly affecting clinical severity [11, 28]. Disease manifestation and advancement are probably influenced by intricate connections among many genetic variants, epigenetic mechanisms, immunological networks, metabolic variables, and environmental triggers, including obesity, stress, and smoking [19, 28, 29].
The laboratory results of this investigation further corroborate the systemic inflammatory characteristics of psoriatic illness. Patients demonstrated markedly increased inflammatory markers (CRP and ESR) and metabolic irregularities, including dyslipidemia, in comparison to healthy controls. These findings are consistent with emerging data connecting psoriasis to persistent low-grade systemic inflammation and heightened cardiovascular risk [4–6]. Inflammatory and metabolic abnormalities significantly intensified from mild psoriasis to severe psoriasis and PsA, corroborating the notion of a biological continuum of systemic immune activation. The most severe inflammatory burden in PsA patients supports the idea that joint involvement is a more advanced systemic expression of psoriatic illness [3, 30].
Significant correlations between PASI and DAPSA scores and inflammatory markers such as CRP, ESR, and white blood cell count indicate that clinical disease activity reflects systemic inflammation. Negative associations with haemoglobin and high-density lipoprotein cholesterol may be explained by inflammation-related anemia and altered lipid metabolism, both well-recognised consequences of chronic immune activation [5–7].
Methotrexate therapy resulted in significant improvements in both PASI and DAPSA scores after 12 weeks, confirming its clinical efficacy. These findings are consistent with previous studies supporting methotrexate as an effective systemic treatment for psoriasis and PsA [6, 23, 24]. Despite the availability of biologic agents, methotrexate remains a cornerstone of therapy due to its immunomodulatory effects, affordability, and effectiveness in both skin and joint disease [12, 31].
Importantly, no association was detected between the TRAF3IP2 (rs13190932) genotype and methotrexate response, indicating that this polymorphism lacks pharmacogenetic utility. This observation aligns with earlier studies demonstrating that methotrexate response is influenced by multiple genetic and non-genetic factors, including folate metabolism, drug transport pathways, baseline inflammation, comorbidities, and environmental exposures [7, 29].
Current international guidelines emphasise treat-to-target strategies aiming at PASI 75/90 or low disease activity according to DAPSA [10, 30]. The significant clinical improvements observed in this study support continued use of methotrexate as first-line systemic therapy, particularly in early disease and in settings where biologics are not readily accessible [10, 12, 31]. Although biologics may achieve higher rates of complete skin clearance, conventional systemic therapies remain effective for a substantial proportion of patients [32].
In conclusion, while TRAF3IP2 (rs13190932) is strongly associated with susceptibility to psoriasis and PsA, it does not predict disease severity or treatment response. Nonetheless, genetic markers remain valuable for understanding disease pathophysiology and identifying individuals at increased risk. Future studies integrating genetic susceptibility, immunologic biomarkers, and longitudinal clinical data are warranted to better define disease heterogeneity and advance personalised treatment strategies [33].
This observational, single-centre study cannot determine causality. The sample size may be inadequate for subgroup and pharmacogenetic analysis, and just one TRAF3IP2 polymorphism was assessed in this polygenic disorder. The 12-week follow-up only shows how well the treatment worked in the short run, and because there was no multivariable correction, we cannot rule out the possibility of residual confounding. No genotype-stratified treatment response analysis was performed, which limits conclusions regarding pharmacogenetic associations.
Conclusions
The TRAF3IP2 (rs13190932) polymorphism is strongly linked to the risk of developing psoriasis and psoriatic arthritis, but not to the severity of the disease or the short-term response to methotrexate. Methotrexate continues to be an effective short-term systemic treatment for psoriasis and psoriatic arthritis.