

Introduction
Various cells, microvessels, and biological molecules, including immune and inflammatory cells, form a complex tumor microenvironment (TME) and participate in tumor immunity, tumor-associated inflammation and tumor metastasis [1]. Tumor-associated macrophages (TAMs) not only participate in the tumor adaptive immune response [2], but also promote angiogenesis and provide nutrition and pathways for tumor growth and metastasis [3]. Cancer progression is related not only to the growth and spread of tumor cells, but also to the interaction between tumor cells and the TME [4].
Immune cell infiltration in the TME has been found to have a better survival prediction effect, which is independent of the TNM staging system. Also the infiltration of CD8+ T lymphocytes in the tumor was positively correlated with the prognosis of colorectal cancer (CRC) [5], liver cancer [6], and esophageal cancer [7], while FoxP3+ regulatory T cells (Tregs) were negatively correlated with the prognosis of CRC [8] and liver cancer [9]. Tregs are a group of cells characterized by significant immunosuppressive function and involved in maintaining immune homeostasis, but under the condition of malignant tumors, they can suppress the anti-tumor immunity and promote tumor progression [10, 11]. FoxP3 protein can regulate the development and function of B cells, T cells and CD25+ CD4+ Tregs [12]. FoxP3 is not only a transcription factor [13] for maintaining the immunosuppressive function of Tregs cells, but also has an important role in proliferation and migration of tumor cells [14]. CRC patients with a lower ratio of CD4/CD8 had a significantly higher 5-year survival rate [15], while the ratio of CD8/FoxP3 was a better prognostic factor for patients with gastric cancer [16].
The immune cells in the TME have different degrees of infiltration and different polarization states. These are not only affected by the tumor cells, but also by the state of other cells in the TME [17-20]. In this study, we detected the infiltration of FoxP3+ Tregs, CD66b+ tumor-associated neutrophils (TANs) and CD163+ TAMs in CRC tissues using tissue microarray and immunohistochemistry, and analyzed the infiltration relationship between these three cells in order to obtain a further understanding of the infiltration of immune cells in CRC tissues.
Material and methods
Patients
For this study, 249 CRC samples (training cohort) and 243 CRC samples (validation cohort) were collected from the Second Affiliated Hospital, Wenzhou Medical University (2001-2009) and Changhai Hospital, Shanghai Naval Medical University (2010-2011), respectively. All samples were confirmed as CRC by two pathologists. The clinicopathological features of patients and chemotherapy (FOLFOX) were also collected. TNM stages were classified according to the American Joint Committee on Cancer guideline (7th Edition). Medical-ethical approval was obtained from the ethics committee of the corresponding hospital and informed consent was also obtained from all patients.
Tissue microarray and immunohistochemistry
All the samples were processed into formalin-fixed, paraffin-embedded tissues to produce the tissue array and used for immunohistochemistry study as described previously [21]. Tissue arrays were incubated with primary antibody for FoxP3 (MAB8214, BD Biosciences, USA), CD66b (ab197678, Abcam, Cambridge, UK) and CD163 (ab182422, Abcam) at a dilution of 1 : 200, 1 : 100, and 1 : 500 at 4°C overnight, respectively, after dewaxing, rehydrating and eliminating endogenous peroxidase. Then the tissues were incubated with goat anti-rabbit secondary antibody (ab97080, Abcam; at a dilution of 1 : 2000) or goat anti-mouse secondary antibody (ab97040, Abcam; at a dilution of 1 : 500) at room temperature for 10 min and stained with diaminobenzidine for 1.5 min and counterstained with hematoxylin for 30 s. Positive staining was calculated in three different fields of view in per slice. The positive cell number was recorded as the mean number of these three values. Two independent pathologists who were blinded to the clinical data evaluated the immunostaining and the results were averaged.
Clinical parameters of outcomes and statistical basis
The age distribution was transformed by categorical variable with 60 years as the cut-off value. The carcinoembryonic antigen (CEA) and CA19-9 values were also divided into two group with the normal values of 5.0 ng/ml and 37 U/ml as the cut-off values [22]. These data were shown as n (%), and comparation of clinical characteristics between the training cohort and validation cohort were performed by χ2 test. The Shapiro-Wilk test was used to test the positive numbers of FoxP3+ Tregs, CD66b+ TANs and CD163+ TAMs, respectively. Non-normally distributed variable data were expressed as mean ± standard deviation (SD). The relationship between two cells was evaluated by Spearman’s rank correlation coefficient and comparison between two groups was analyzed by Mann-Whitney U test. All statistical analyses were performed using statistical package SPSS (version 22.0 for Windows, IBM SPSS Statistics) and p < 0.05 was considered statistically significant.
Results
Basic characteristics of the patients are shown in Table 1, and there was no difference between the training cohort and validation cohort. There were more males than females, and the incidence of colon cancer was higher than that of rectum cancer. The tumor stage is mainly TNM stage II and the tumor cells were mostly moderately differentiated. There were rare patients with serum CEA and CA19-9 levels higher than normal.
Table 1
Demographic and baseline characteristics in colorectal cancer (CRC) patients
We found that the average positive cell numbers of FoxP3+ Tregs, CD66b+ TANs and CD163+ TAMs in patients in the training cohort were 14.54, 38.41 and 114.69, respectively. These cell numbers in patients in the training cohort were non-normally distributed as determined by the Shapiro-Wilk test (p < 0.05). The correlation among these three immune cell infiltrations was determined using Spearman correlation analysis and there was a negative correlation between FoxP3+ Tregs and CD66b+ TANs (correlation coefficient: –0.495, p < 0.05), CD66b+ TANs and CD163+ TAMs (correlation coefficient: –0.266, p < 0.05), while there was a positive correlation between FoxP3+ Tregs and CD163+ TAMs (correlation coefficient: 0.467, p < 0.05) (Table 2). The correlation between these three immune cell infiltrations in the validation cohort was the same as those in the training cohort (p < 0.05) (Table 3).
Table 2
Tests of normality and Spearman correlation analysis for FoxP3+ Tregs, CD66b+ TANs and CD163+ TAMs in training cohort
Table 3
Tests of normality and Spearman correlation analysis for FoxP3+ Tregs, CD66b+ TANs and CD163+ TAMs in validation cohort
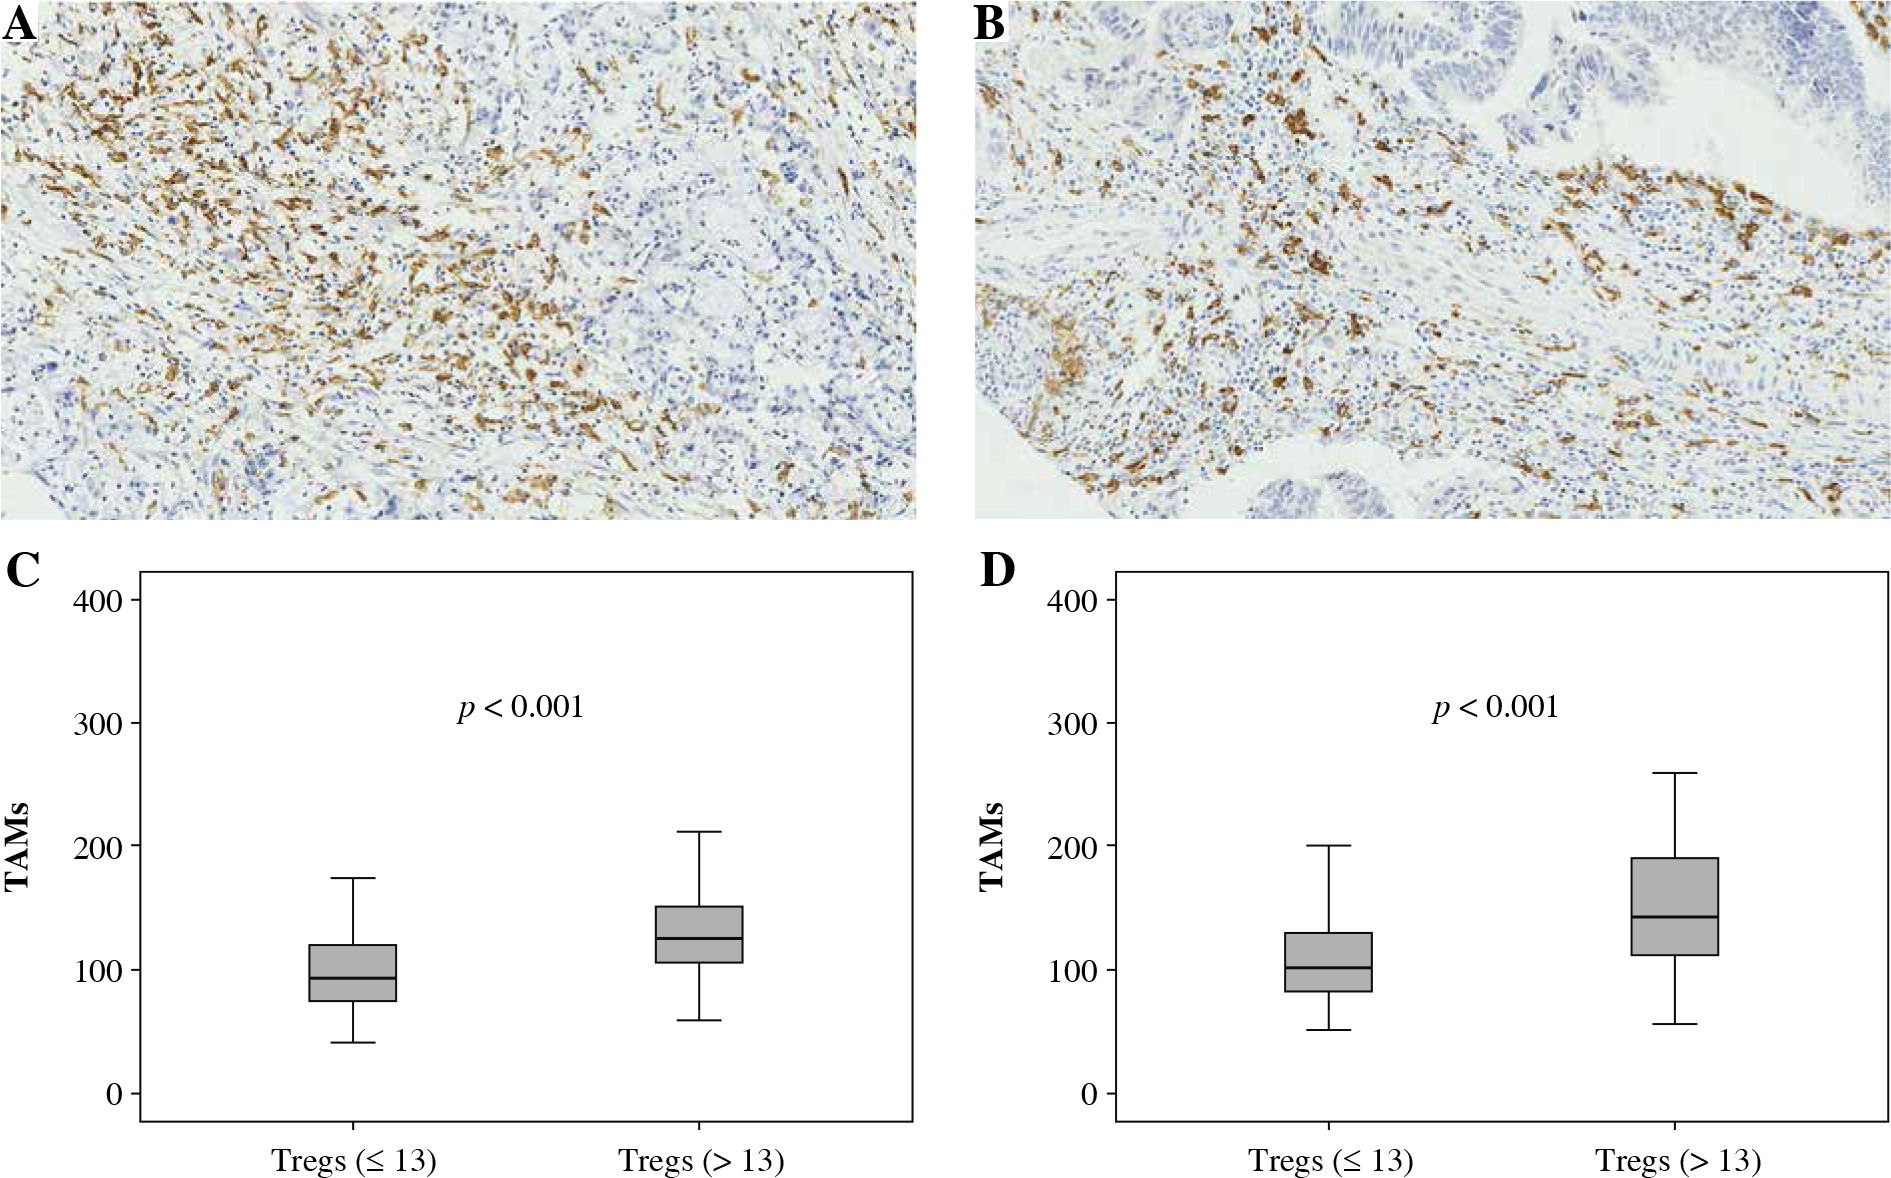
We divided patients in the training cohort into the low-infiltration group and high-infiltration group according to the median of the three positive cell numbers (i.e., 13 for FoxP3+ Tregs, 34 for CD66b+ TANs, and 113 for CD163+ TAMs). The Mann-Whitney U test was used to compare the cell infiltration between two groups; there was a significant difference in FoxP3+ Treg infiltration between low and high CD66b+ TAN infiltration groups (p < 0.001) (Fig. 1A, B), as well as CD66b+ TANs between low and high CD163+ TAM infiltration groups (Fig. 2A, B), and CD163+ TAMs between low and high FoxP3+ Treg infiltration groups (Fig. 3A, B). The patients in the validation cohort were also divided into the low-infiltration group and high-infiltration group using the same median value in the training cohort and the immune infiltration between the two groups was similar to that in the training cohort (Fig. 1C, Fig. 2C, and Fig. 3C).
Fig. 1
Association between FoxP3+ Treg infiltration and CD66b+ TAN infiltration. A, B) Immunohistochemically stained sample for high-level and low-level FoxP3+ Tregs (400×). Plots of FoxP3+ Tregs for two CD66b+ TAN groups in training cohort (C) and validation cohort (D). Samples were divided into two groups according to the median value of CD66b+ TAN number in the training cohort, and the comparison between two groups was analyzed using the Mann-Whitney u test
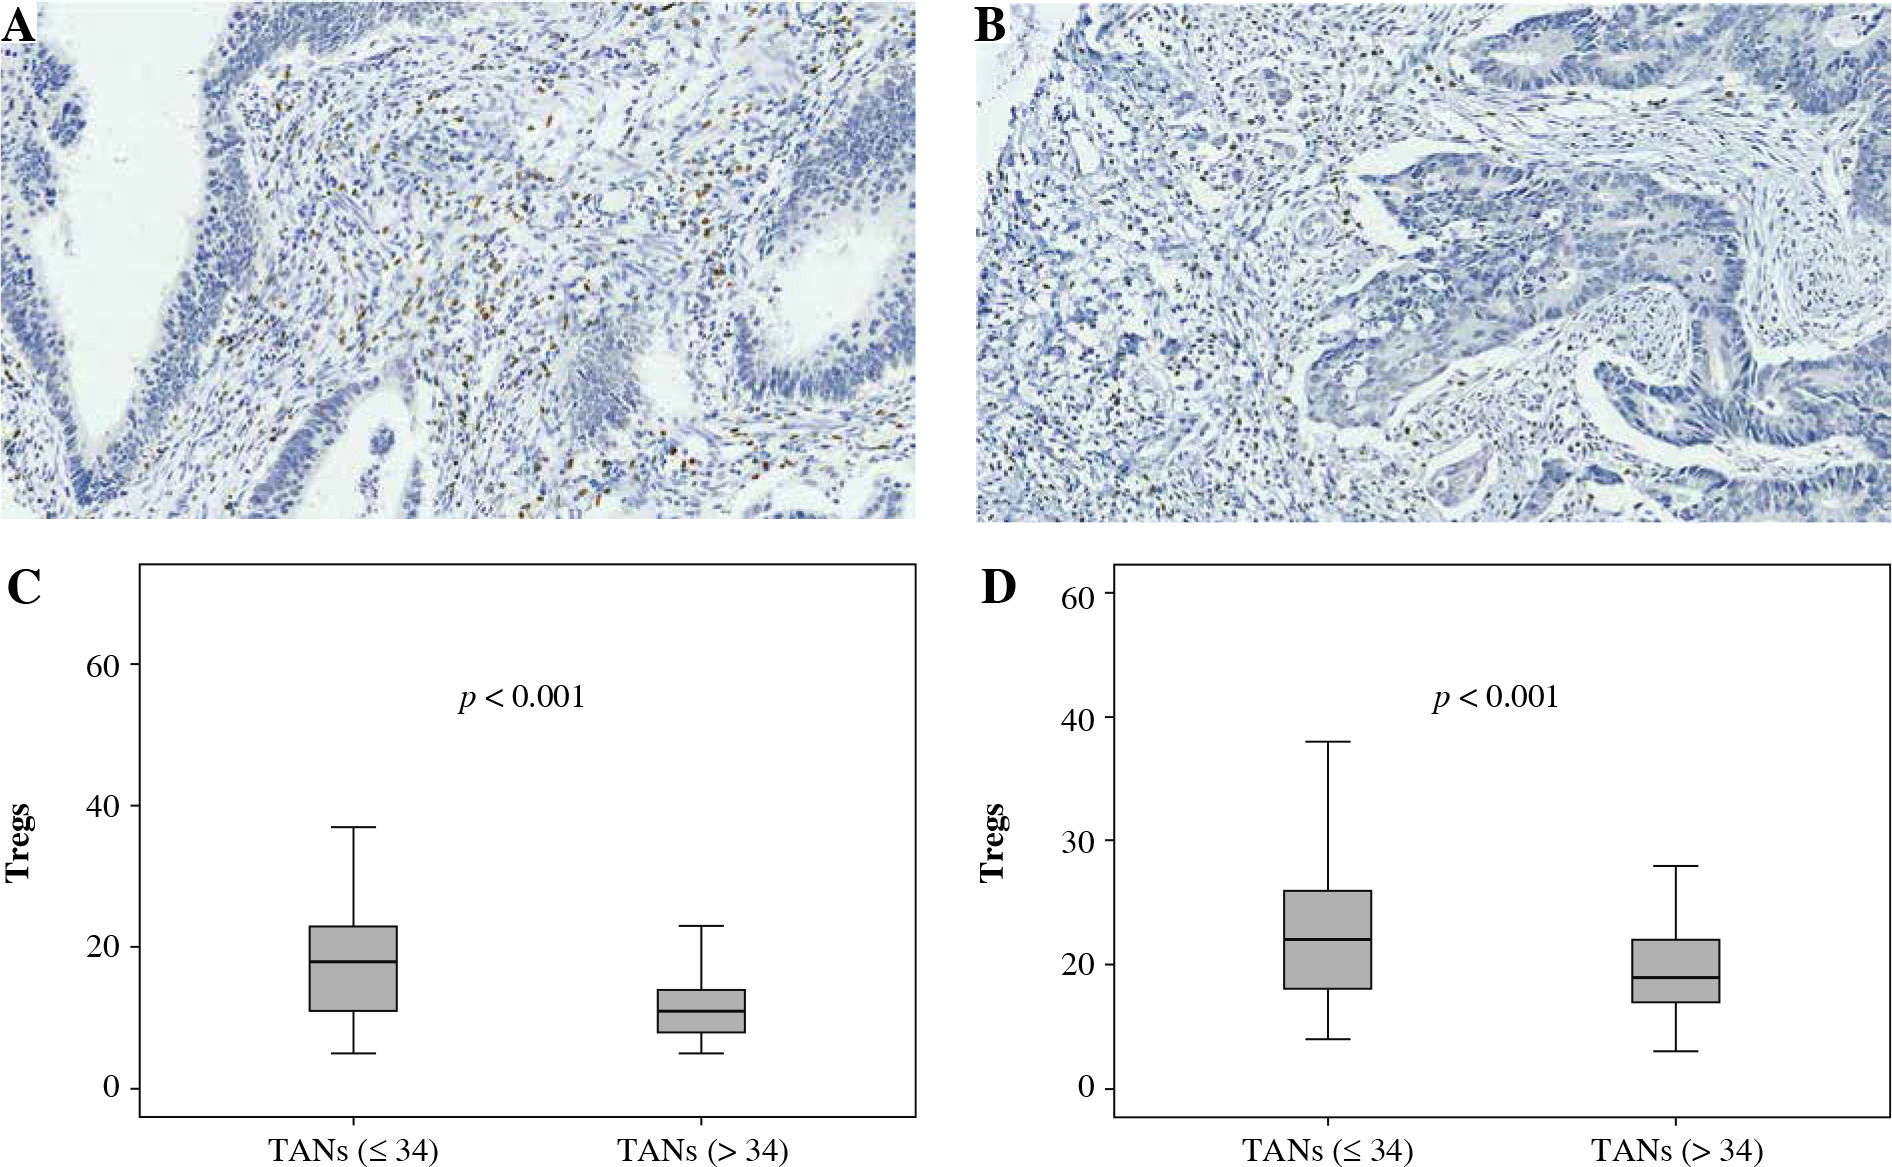
Fig. 2
Association between CD66b+ TAN infiltration and CD163+ TAM infiltration. A, B) Immunohistochemically stained sample for high-level and low-level CD66b+ TANs (400×). Plots of CD66b+ TANs for two CD163+ TAMs groups in training cohort (C) and validation cohort (D). Samples were divided into two group according to the median value of CD163+ TAM number in the training cohort, and the comparison between two groups was analyzed using the Mann-Whitney u test
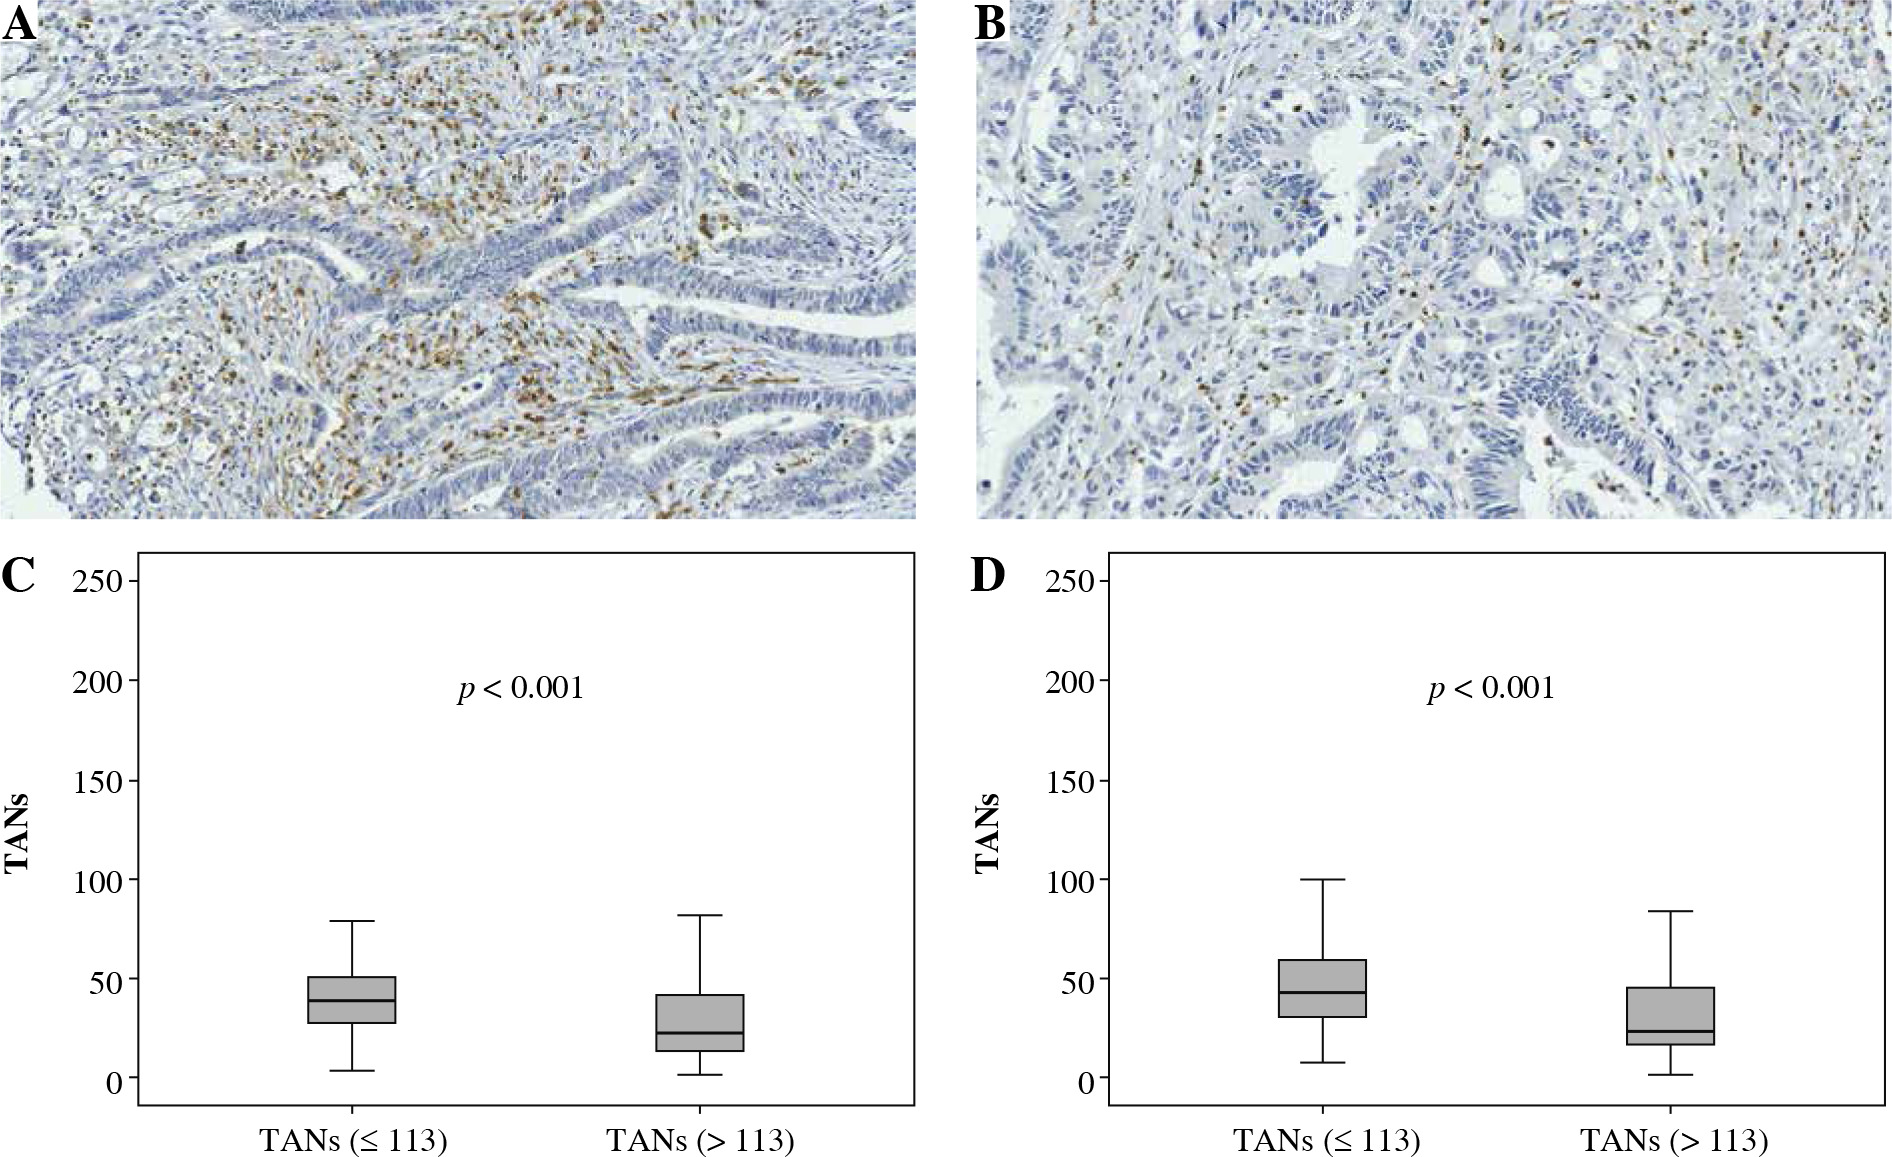
Fig. 3
Association between FoxP3+ Treg infiltration and CD163+ TAM infiltration. A, B) Immunohistochemically stained sample for high-level and low-level CD163+ TAMs (400×). Plots of CD163+ TAMs for two FoxP3+ Treg groups in training cohort (C) and validation cohort (D). Samples were divided into two groups according to the median value of FoxP3+ Treg number in the training cohort, and the comparison between two groups was analyzed using the Mann-Whitney u test
Discussion
A negative correlation between the numbers of FoxP3+ Tregs and CD66b+ TANs, CD66b+ TANs and CD163+ TAMs, and a positive correlation between the number of FoxP3+ Tregs and CD163+ TAMs in CRC tissues was observed in this study. To our knowledge, this is the first time that the infiltration relationship among FoxP3+ Tregs, CD66b+ TANs and CD163+ TAMs has been studied in CRC.
In different experimental data, the correlation of tumor-infiltrating immune cells with prognosis in CRC is controversial. Previous studies reported that the infiltrations of Tregs, TAMs and TANs were independent prognostic factors in CRC, and the infiltrations of Tregs and TAMs play a protective role, while TAN infiltration was an independent prognostic risk factors [23, 24]. However, Galdiero et al. confirmed that TANs were positively correlated with good prognosis in CRC patients, and the higher TAN density was related to better response to 5-fluorouracil (5-FU)-based chemotherapy [25]. The role and function of Tregs may be highly dependent on their site of action within CRC tissues, and Tregs suppress the antitumor immune response at the invasion site in CRC, while in the tumor stroma, Tregs inhibit tumor promoting inflammation [26]. In addition, CRC cells secrete cell chemokine ligand 20 to recruit Tregs, which promote FOLFOX chemoresistance of CRC treatment [27].
The number of CD66b+ TANs both in the invasion margin and the center of gastric cancer tissues shows a statistically significant relation with disease-free survival and disease-specific survival [28]. The increment of Tregs and the reduction of M1 TAMs in CRC TME suppress the immune responses to tumors [29]. Compared with traditional indicators of evaluating prognosis in CRC, the prognostic predictive models that were build based on the numbers of Tregs, TAMs and TANs were more trustworthy [23]. Therefore, the number of TANs, TAMs and Tregs may play an important role in CRC TME. The number of FoxP3+ Tregs in CRC tissues was lower than that of CD66b+ TANs and CD163+ TAMs in this study, and the number of FoxP3+ Tregs was positively related with that of CD163+ TAMs while being negatively related with CD66b+ TANs. This suggests that FoxP3+ Treg infiltration is affected by CD66b+ TANs and CD163+ TAMs in CRC tissues and plays a less important role in promoting cancer. However, the TME of CRC is complicated, and many factors and compositions promote the infiltration of Tregs, TAMs and TANs in the TME. The released chemokines of tumor cells induced tumor necrosis factor α (TNF-α)/ interleukin 1α, such as C-C motif chemokine (CC) ligand 12 (CCL12) and CCL5, trigger the infiltration of TAMs, TANs and Tregs carrying the CCR2/CCR5 receptor [30]. Transforming growth factor β induces CXCL1 and CXCL8 expression and release in TANs, which promotes the infiltration of TANs bearing the CXCR2 receptor in CRC [31]. CCL18, expressed on TAMs, recruits naive CD4+ T cells to breast tumors, and naive CD4+ T cells develop into Tregs in the TME [32].
CD163 expressed in tissue macrophages is a specific marker of M2 TAMs [33], while CD66b is a molecular marker of neutrophils in tumors [34]. In this study, the negative correlation between CD66b+ TANs and CD163+ TAMs indicates that TAN-induced M2-like polarization events may not occur in these samples [35]. TAM participates in tissue homeostasis and repair, enhances tumor cell migration and invasion, and regulates angiogenesis to promote tumor progression [36]. Cell signals from cancer cells or stromal cells can change the neutrophil phenotype and migration pathway as well as released factors [37-39]; that is, TANs can transfer the phenotype polarization to protumor or antitumor phenotype based on specific environmental signals [35]. In addition, the combination of infiltration of CD66b+ and CD163+ cells provided more accurate survival prediction in gastric cancer, and CD66bhigh CD163low was related to longer disease-free survival and disease-specific survival [34]. This information suggests that CD66b+ TANs may exert an antitumor effect, and the tumor-promoting effect of FoxP3+ Tregs and CD163+ TAMs may be dominated by CD163+ TAMs in CRC tissue.
Conclusions
In summary, this study showed the infiltration of CD66b+ TANs, FoxP3+ Tregs and CD163+ TAMs in CRC tissues. There was a significant negative correlation between infiltration of CD66b+ TANs and FoxP3+ Tregs or CD163+ TAMs in CRC tissues. However, the infiltration of FoxP3+ Tregs was positively related to that of CD163+ TAMs. This study provides a basis for further research on the interaction and regulation among CD66b+ TANs, FoxP3+ Tregs and CD163+ TAMs, and taking the correlation among them into consideration may be more suitable for CRC treatment.