Introduction
Childhood obesity is a worldwide chronic disease and one of the most serious challenges of the 21st century. Recent post-coronavirus disease 2019 (COVID-19) reports have estimated that over 380 million children are currently overweight or obese worldwide [1]. According to the World Health Organization (WHO), the prevalence of overweight and obesity among children and adolescents aged 5–19 has risen dramatically from 4% in 1975 to over 18% in 2016 [2]. It is estimated that in 2030 it will reach 34.2% for boys and 27.4% for girls [3]. Childhood obesity rates are also increasing in Poland. According to 2018 data from the National Institute of Public Health – National Institute of Hygiene, excessive body weight has risen by 130% since 1990 [4]. Studies have reported the occurrence of obesity in increasingly younger age groups [5]. As the prevalence of obesity in children and adolescents continues to increase, weight-related complications are expected to rise [6, 7]. Furthermore, childhood-onset obesity is associated with more serious health consequences and a greater risk of complications compared with adult-onset obesity [8]. The COVID-19 pandemic and the restrictions introduced drastically affected the physical activity (PA) of children and adolescents in 2020 and 2021, changing their lifestyle and the amount of time spent in front of screens, which are significant factors correlated with weight gain [9–13].The use of lockdown measures was associated with a reduced amount of physical exercise and changes in eating habits and behaviours, which had a significant impact on the health and well-being of children and led to widespread rapid weight gain amongst certain populations worldwide [14]. During the COVID-19 pandemic, the number of children visiting the outpatient’s clinic due to overweight/obesity increased significantly. This trend became so prominent it was termed “covibesity” [15]. The circumstances leading to the rapid onset of obesity during the COVID-19 pandemic may represent a novel risk factor for metabolic complications, including insulin resistance, hypertension, dyslipidaemia, diabetes, metabolic syndrome, and metabolic dysfunction-associated fatty liver disease.
The concentration of fetuin-A may be a less well known but potentially interesting risk factor in the context of the development of early metabolic complications of obesity [16–19]. The aim of this study was to evaluate whether children who developed obesity rapidly during the COVID-19 pandemic differed metabolically from those with pre-existing obesity in terms of classical metabolic risk factors and fetuin-A levels, and to assess the effects of a one-year lifestyle intervention following the end of pandemic restrictions.
Study design
The study group consisted of 55 children (24 girls – 44%, 31 boys – 56%) aged 10 to 18 years (mean age 13.75; median 13.37 years) who were referred to the outpatient’s diabetes and obesity clinic of one paediatric hospital during the pandemic (January 2021–June 2022) due to obesity. During the first visit, clinical data were collected (detailed medical history, family history particularly regarding the occurrence of obesity, the time of onset of obesity, comorbid conditions), a physical examination with anthropometric measurements was performed, and a questionnaire about eating habits and PA was completed by the parent/guardian together with the child. The questionnaire consisted of two simple questions answering whether the patient follows dietary recommendations and PA according to the WHO (balanced diet, regular meals, sugar restrictions and 60 min PA per day). The evaluation of height and weight was performed using evaluated up-to-date percentile grids in line with the standards for the paediatric population [20]. Body mass index (BMI) and BMI z-score [BMI standard deviation score (SDS)] were calculated [21–23]. Overweight was defined as a BMI between the 85th and 95th percentile for sex and age, and obesity was defined as a BMI above the 95th percentile for sex and age. Body composition assessment was conducted using the Bioelectrical Impedance Analyser TANITA device BC – 420MA. A blood sample was collected from each child. Blood tests including glycated haemoglobin (HbA1c), fasting blood glucose (FBG), fasting insulin, total cholesterol, low-density lipoprotein, high-density lipoprotein, triglycerides, alanine aminotransferase and aspartate aminotransferase were performed in a certified hospital laboratory using standard methods. The concentration of fetuin-A was assayed in the same laboratory using a BioVender Group Human Fetuin A ELISA kit. The oral glucose tolerance test (OGTT) also was performed (1.75 g/kg, maximum 75 g of glucose). Interpretation of OGTT and diagnosis of prediabetes were established according to the Diabetes Poland 2022 and WHO criteria, that is normal fasting glucose: 70–99 mg/dl (3.9–5.5 mmol/l); impaired fasting glucose (IFG): 100–125 mg/dl (5.6–6.9 mmol/l); impaired glucose tolerance (IGT): plasma glucose level at minute 120 of an OGTT between 140 and 199 mg/dl (7.8–11 mmol/l); prediabetes – IFG and/or IGT; diabetes, defined by one of the following criteria:
symptoms of hyperglycaemia and random plasma glucose ≥ 200 mg/dl (≥ 11.1 mmol/l);
fasting plasma glucose ≥ 126 mg/dl (≥ 7.0 mmol/l) on two occasions;
2-hour plasma glucose sugar level during OGTT ≥ 200 mg/dl (≥ 11.1 mmol/l);
HbA1c level ≥ 6.5% (≥ 48 mmol/mol) [24].
Insulin resistance was estimated by the Homeostasis Model Assessment of Insulin Resistance (HOMA-IR) index using the following formula: fasting insulin × FBG (mg/dl)/405. The inclusion criteria for metformin were as follows: fasting glucose 100–126 mg/dl or 2-hour plasma glucose during OGTT > 140 mg/dl; HOMA OGTT index > 75th percentile; fasting insulin concentration > 25 mU/ml or 2-hour insulin concentration during OGTT > 150 mU/ml. Participants underwent abdominal ultrasonography to assess the presence and degree of hepatic steatosis based on liver size and echogenicity. The blood pressure measurements were carried out in each child based on the oscillometric method (Omron HBP-1120) with the appropriate cuff size in accordance with standard procedures for correct measurement. Normative values were estimated individually for each person based on the sex, age, and height percentile according to centile charts for blood pressure assessment in children and adolescents (hypertension defined as values above the 95th percentile) [25, 26].
Based on the collected data and obtained results, two groups of children were identified: those with rapid onset of obesity or worsening during the pandemic and with normal weight before pandemic (pandemic obesity – Group P), and a group of patients whose obesity had lasted longer (non-pandemic obesity – Group NP).
The participants were offered a one-year treatment programme based on dietary recommendations (balanced diet with reduced calories), recommended increasing PA according to the WHO (60 minutes per day of moderate-to-vigorous intensity, mostly aerobic, PA, across the week, incorporating vigorous-intensity aerobic activities at least 3 days a week) [26] and individual psychological support. In accordance with the study protocol, participants underwent follow-up visits after 3, 6 and 12 months to assess treatment progress, as detailed in Table I. Statistical analysis of the obtained test results was performed using the STATISTICA 13.3 PL computer program (StatSoft, Tulsa, OK, USA). The normality of distribution was verified using the Shapiro-Wilk test. When comparing differences in the assessed parameters between the studied groups, in the case of obtaining a normal distribution of numerical data, Student’s t-test was used, and in the case of a non-normal distribution, the analysis was performed using the non-parametric Mann-Whitney test.
Table I
Study design – medical data assessed during successive visits
Depending on the size of the groups, the χ2 test (with or without Yates’ correction) or Fisher’s exact test was used to statistically assess differences in the frequency of the analysed features. To analyse the correlation, the Spearman correlation test was used. The threshold for statistical significance was p < 0.05.
Ethics declaration
The study was conducted according to the Declaration of Helsinki (“Ethical Principles for Medical Research in Humans”, 9 July 2018). The whole study protocol and the consent procedure were approved by the Institutional Bioethics Committees at the Medical University of Silesia. Written informed consent was obtained from each participant after a full explanation of the study.
Results
General data
In 31 children (56%), obesity appeared during the pandemic period (pandemic obesity, Group P), whereas in 24 children (44%), the excessive weight gain started before the COVID-19 pandemic (non-pandemic obesity, Group NP).
Based on the collected family histories, 21 children (38%) were found to have a positive family history of obesity. Comorbidities according to information obtained at the first visit were reported by 40% of children: arterial hypertension in 10 children (18%), hepatic steatosis on ultrasound in 13 children (24%), hypercholesterolaemia in 12 children (22%). None of the patients were diagnosed with diabetes. The average HbA1c was 5.4%. Metformin was introduced in 32 children (58%) due to insulin resistance/prediabetic condition.
Pandemic and non-pandemic obesity
First of all, children in the groups did not differ in terms of age, sex, BMI z-score and bioimpedance results. In the analysis of initial data, Group P did not differ metabolically from children from Group NP (Table II). Also, fetuin-A concentration was similar in both groups (Group P: 526 μg/ml vs. Group NP 522 μg/ml, p = 0.47). Children with pandemic and non-pandemic obesity did not differ in terms of biochemical parameters and response to the proposed behavioural treatment. We observed a significant drop-off in participants at follow-up visits (especially after six months).
Table II
Comparison of pandemic obesity (Group P) and non-pandemic obesity (Group NP) at Visit 1 Variable
[i] ALT – alanine aminotransferase; AST – aspartate aminotransferase; BMI z-score – body mass index standard deviation score; F – female; HbA1c – glycated haemoglobin; HDL – high-density lipoprotein cholesterol; LDL – low-density lipoprotein cholesterol; M – male; OGTT – oral glucose tolerance test; TC – total cholesterol; TG – triglycerides
One-year follow-up (whole group)
During the one-year follow-up of the entire group, a significant decrease in BMI z-score was observed (between baseline and Visits 3 and 4), while no significant changes were found in bioimpedance parameters (Table III).
Table III
Anthropometric measurements [data presented as median (25th–75th percentile)]
After 6 months, we observed non-significant changes in carbohydrate metabolism parameters, lipid parameters and fetuin-A levels (Table IV).
Table IV
Biochemical measurements at Visit 1 and Visit 3 (p > 0.05)
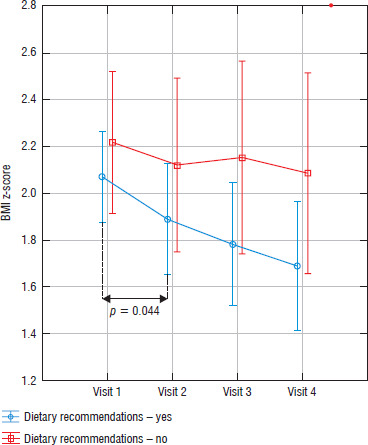
Based on the personal questionnaire completed at the following visits, we noted that 34 participants (62.0%) followed dietary recommendations and changed their eating habits, and 26 participants (47.3%) reported increasing daily PA. Twenty-three participants (41.2%) followed both nutritional and exercise recommendations. Children who followed the dietary recommendations had a significantly lower BMI z-score at Visit 2 (median 2.08 vs. 1.89, p = 0.044) and significantly lower fat % in bioimpedance at Visits 2 and 3 (median 36.3 vs. 36.9, p = 0.013 and 33.6 vs. 40.85, p = 0.027 respectively) (Figure 1).
Figure 1
Changes in body mass index standard deviation score (BMI z-score) at successive visits in children compliant (blue) and non-compliant (red) with dietary recommendations
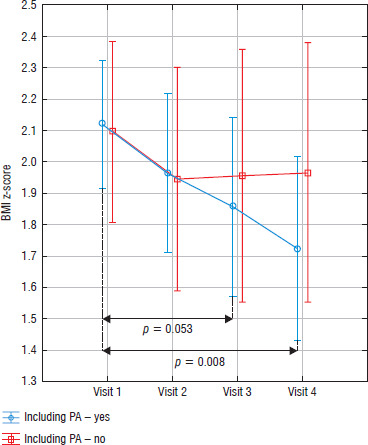
Children who reported increasing/returning to PA most often mentioned daily walks, cycling, swimming, taking part in organized training, going to the gym and participating in gymnastics classes. Although a borderline reduction in BMI z-score and % fat mass was observed at Visit 3 (at 6 months) (p = 0.053), a significant difference was found after a year (at Visit 4) (p = 0.008) (Figure 2).
Fetuin-A as marker of metabolic risk factor
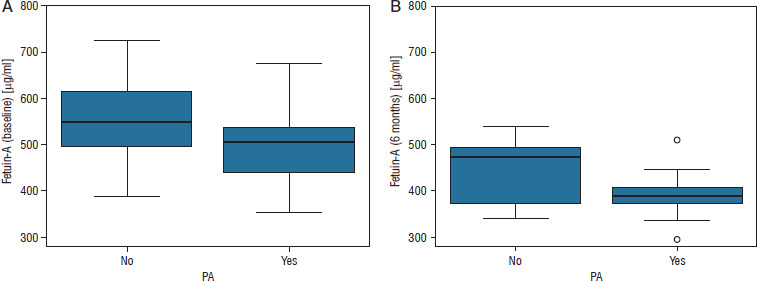
We did not observe a significant difference, although a non-significantly lower fetuin-A concentration after 6 months of treatment was observed in Group P vs. NP (381 μg/ml vs. 413 μg/ml, p = 0.105). Moreover, a beneficial effect of PA was demonstrated in terms of the values of fetuin-A: children who reported increasing/returning to PA have lower levels of fetuin-A both at the beginning of observation (Visit 1; median 560 vs. 510 μg/ml, p = 0.007) and after 6 months (Visit 3; median 480 vs. 395 μg/ml, p = 0.07); see Figure 3. We observed a significant drop-off in participants at follow-up visits (especially after 6 months).
Discussion
In the study conducted by Cunningham et al. [27], based on a comparison of two cohorts of children, it was found that in the past, obesity was “milder” and “less dangerous” than obesity occurring today.
In the present work, firstly, we evaluated whether there are metabolic differences between participants whose obesity disease occurred or significantly worsened during a relatively short period of time, such as during the pandemic, and those who were obese previously. We aimed to test the hypothesis that the rate of obesity development might have clinical implications. The analyses showed that children with pandemic-onset obesity (Group P) did not differ metabolically from children with pre-existing obesity (Group NP) at baseline. This prompted us to explore possible reasons for the lack of observed differences. Our findings suggest that multiple factors may have contributed: the duration of obesity likely influenced metabolic parameters in children with chronic obesity, while the rate of weight gain may have played a role in children with acute, pandemic-onset obesity. Together, these factors may have offset potential intergroup differences.
The second clinical objective of our study was to assess the response to the proposed behavioural treatment. We observed significant weight loss, measured as BMI z-score, during one-year observation [2.25 (2.03–2.41) vs. 1.95 (1.75–2.26), p = 0.04]. During a detailed analysis aimed at determining what influenced the observed effect, we found that both the return to greater activity and changes in diet were important. However, different rates of change were observed at various follow-up points. Classically, most participants showed improvement at the first follow-up visit, regardless of whether the children reported permanent lifestyle changes. Participants who reported dietary modifications differed slightly already at the starting point: those who responded positively had a non-significantly lower BMI z-score at the beginning. The effect of exercise was visible especially later, with improvements observed steadily over time. Participants who did not comply with any of the recommendations had a higher final BMI z-score. The importance of diet and physical exercise in the context of the pandemic has also been discussed in the literature by other authors. In the study by Zachurzok et al. [13] examining the impact of the COVID-19 pandemic restrictions on the lifestyle, diet and body mass index of children, significant increases in the BMI z-score were found in all children, with the most pronounced increase in obese children. The authors reported that this effect was largely driven by decreased PA rather than dietary modifications [13].
A meta-analysis of 22 studies of 14,216 children aged 3–18 years indicated that during the COVID-19 pandemic, the total engagement in PA in children was reduced by 20% compared with the pre-pandemic period [28].
In our study, children in both subgroups did not differ significantly in response to the proposed treatment during the one-year follow-up in terms of BMI z-score and classic metabolic parameters. However, we observed certain trends in the assessment of fetuin-A level. After following dietary recommendations and resuming PA, children with pandemic-onset obesity of relatively short duration showed a tendency toward improvement in this parameter. Fetuin-A is an acute phase protein, reduced concentrations of which are associated with the ongoing inflammatory process, and some authors are trying to establish its relationship with obesity [17]. Fetuin-A levels were elevated in obese children, irrespective of the presence of diabetes, and were more elevated in obese controls than in normal weight controls [18]. Data on the effect of fetuin-A on insulin resistance are inconclusive. However, most research reveals that fetuin-A promotes lipid-induced insulin resistance [29, 30]. There are a large number of studies reporting also that serum fetuin-A levels are affected by dietary factors [31]. Fetuin-A is one of the parameters which can be used for metabolic assessment and can be a non-invasive alternative for assessing the early pathogenetic mechanisms of complications of metabolic obesity in children, a parameter for monitoring glycaemic control [32] and the effectiveness of the used treatment. However, research on the relationship between fetuin-A and regular PA remains limited.
One of the most notable novel findings of our study is that serum fetuin-A concentrations were higher in children who were less willing to engage in PA and lower in those who were more active. These results suggest that fetuin-A could serve as a potential marker for evaluating adherence to exercise as a component of obesity treatment. This hypothesis requires extended evaluation and validation in larger patient cohorts. Further research is necessary to establish reference ranges and define precise cut-off values.
Our findings should be regarded as preliminary and warrant further investigation. A one-year long-term observation showed that in motivated children with obesity, results can be achieved using established behavioural methods. Lifestyle intervention programmes are considered crucial in the treatment of childhood obesity [33], although often treatment programmes result in a brief period of weight loss followed by regaining the lost kilograms after the end of therapy [34].
Limitations
We acknowledge several limitations inherent to our study. First of all, the sample size was small, which may limit the representativeness of our findings for the general paediatric population. Moreover, we observed a significant drop-off in participants at follow-up visits (especially after 6 months), which is a typical phenomenon such a difficult-to-intervene population. Furthermore, the questionnaire applied in this study was based on self-reported information, which inherently involves a degree of subjectivity and may affect the accuracy of the reported data.
Real-world evidence indicates that the majority of adolescents fail to achieve sustained weight loss and often demonstrate low adherence to lifestyle modification interventions [35].
Conclusions
The obesity that manifested itself in children during the pandemic period (pandemic obesity) is likely not metabolically different from obesity that arose earlier and lasted longer.
Increase in PA/return to normal PA after the lockdown and compliance with dietary recommendations appear to be important elements of ongoing therapy and in the context of potential complications.
Fetuin-A may be a potential marker of compliance with PA recommendations and the rate of obesity progression.