Introduction
In the human circulatory system the haemodynamic structure of blood vessels is generally related to the pathophysiology of cardiovascular diseases. It is well known that the flow pattern interacts directly with the vessel walls and therefore can have both beneficial and detrimental effects on the endothelial walls. So, a thorough understanding of blood dynamics in human vessels is of great interest. Having an in-depth knowledge about the blood flow patterns is important in terms of defining the relationships between vessels and vascular branches [1,2]. Stroke due to carotid artery disease accounts for 10-20% of other paralyses [3,4]. The most common carotid diseases known to cause cerebral stroke and paralysis are: stenosis, aneurysm, and dissections. The first of them is carotid stenosis. Stenosis due to atherosclerotic plaques is usually found in arterial bifurcations with complex flow patterns as well as in carotid arteries [5-9]. Carotid artery geometry is also a risk factor for atherosclerosis [10,11]. A series of fluid dynamics simulations have been performed to detect these atherogenic haemodynamic complex flow patterns in carotid artery bifurcation sites [2,12-16]. Atherosclerotic carotid stenosis is usually associated with systemic risk factors such as hypertension, smoking, hyperlipidaemia, and diabetes mellitus [17].
Second is the extra cerebral and intracerebral aneurysm. Also, branching morphology in carotid bifurcation regions can affect flow dynamics and cause development of aneurysms in the carotid artery bifurcation region, subsequently and especially in the brain. Extracranial carotid artery aneurysms are very rare and account for less than 1% of all peripheral artery aneurysms [18]. However, un-ruptured cerebral aneurysms are common in the general population and have an estimated prevalence of between 2% and 6% [19]. The pathophysiology of cerebral aneurysm formation and rupture has not been fully defined, but risk factors including increased age, gender, hypertension, excessive alcohol intake, and smoking have been identified [19-21]. Research has shown haemodynamic stress as a critical factor in the pathogenesis of cerebral aneurysm, leading to endothelial dysfunction, inflammatory cell infiltration, and remodelling of the arterial wall [22,23].
The third is carotid dissections. Carotid artery dissection accounts for 2% of all ischaemic strokes, while this rate increases up to 20% in young adults under 50 years of age [24-26]. The main mechanism of development of carotid artery dissection is the rupture of the carotid artery in the intima layer, and the blood in this region proceeds through the artery to form an embolic or false aneurysmal lumen in the subintimal or subadventorial layers. This situation leads to deterioration of blood flow dynamics. Carotid artery dissections can develop spontaneously or traumatically [27-29].
The cause of all these carotid artery diseases is directly related to the morphological structure and haemodynamic characteristics of the carotid artery and its branches. These morphological and haemodynamic features are: flow velocities of carotid arteries, flow rates, flow patterns, artery diameters, branching angles, and viscosity and morphological properties of flowing blood. These listed morphological and haemodynamic properties can be determined by laws and formulas such as Murray’s laws, Haok’s laws, and minimum cost function. Therefore, volumetric computed tomography angiography (CTA) and magnetic resonance imaging (MRI) methods are used for this purpose.
Thanks to these methods, the true three-dimensional geometry of the arteries can be determined with significant accuracy [30-32]. In this study, haemodynamic characteristics have been determined considering the data of cranio-cervical CT angiography taken from patients with carotid stenosis, extra and intracerebral aneurysm, and carotid dissection for any reason. These characteristics were compared with the data of the patients who were evaluated as normal. It is thought that the results obtained can be used in the prediction of carotid diseases and in artificial neural network studies. Our hypothesis is to seek answers to the following questions: What haemodynamic changes can occur in patients with stenotic, aneurysmal, and dissection of the carotid artery and its branches? How do these changes differ in patients with normal and carotid disease?
MATERIAL AND METHODS
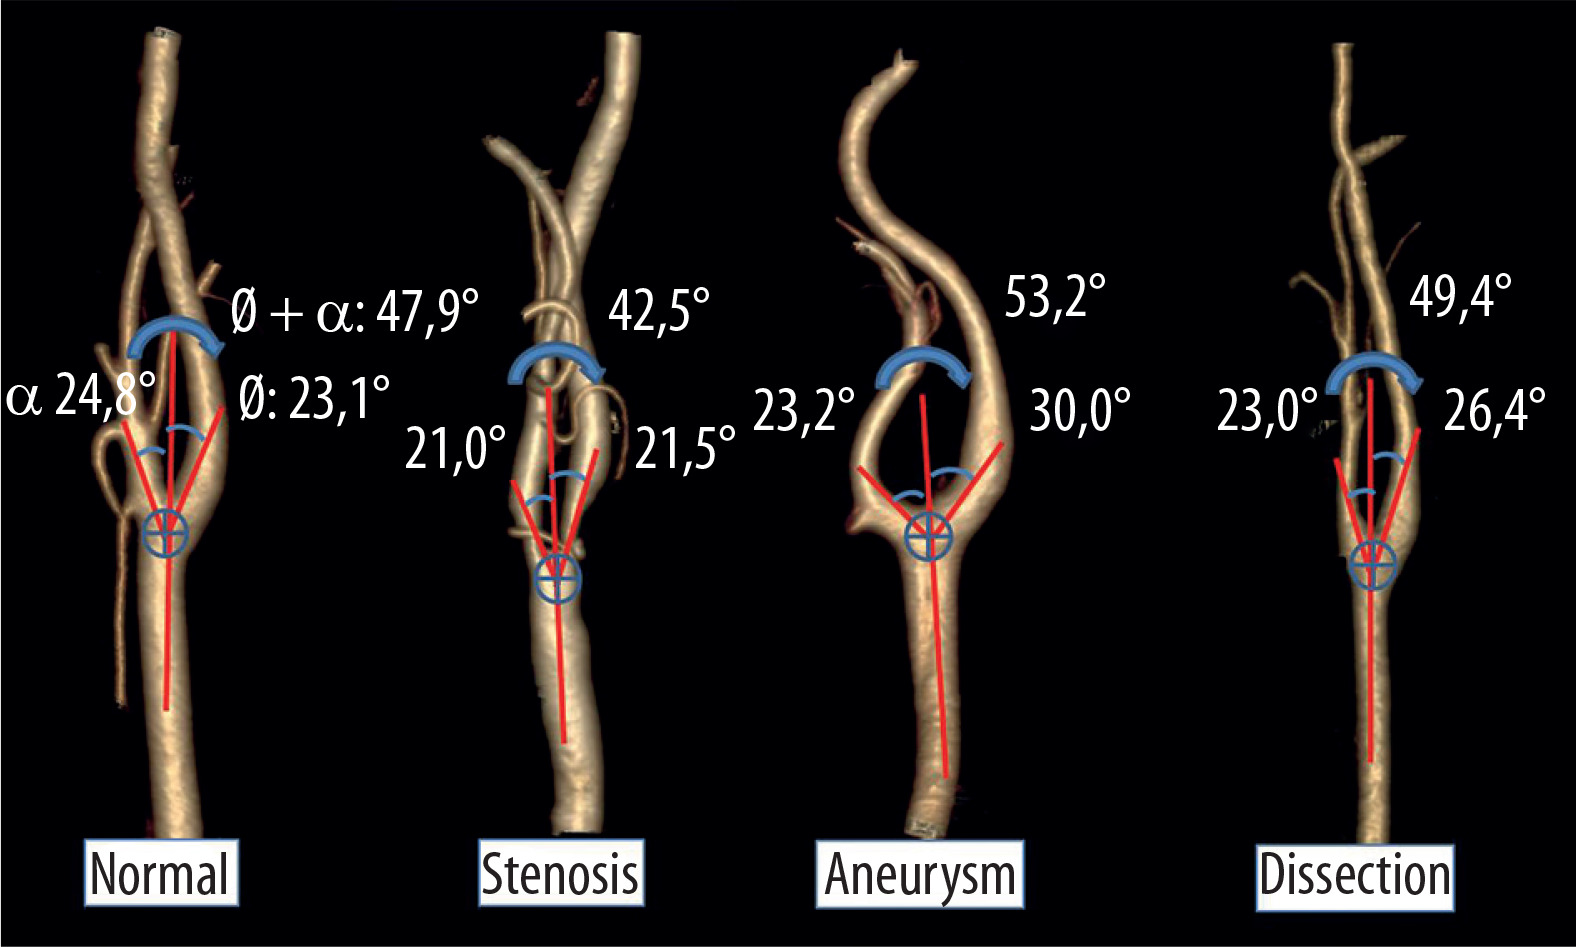
Local Ethics Committee approval was obtained from our institution in order to use hospital archive data for this study. In order to prove the hypothesis, the cranio-cervical CT angiography images of patients who were referred to our clinic for any reason and received the diagnosis of carotid stenosis, carotid dissection, and extra or intracranial aneurysm were reviewed retrospectively. As a result of the archive screening, computed tomography angiography (CTA) image data of 122 patients (31 normal, 30 stenotic, 30 aneurysmal, and 31 dissected) were selected. The images of patients with only one disease (stenosis, aneurysm, dissection) were accepted as patients. Normal data were obtained from the patients who had CTA for any reason which was evaluated as normal. Data of patients with acquired disease were compared with those of normal patients who had CTA shootings with the same characteristics. Cranio-cervical CT angiography was performed on a Siemens device (Somatom Definition, care dose CT with 128 slices, Siemens Healthcare, Erlangen, Germany). The shooting parameters used for cranio-cervical CTA are; kVp: 120 mA: dose modulated, rotation time: 0.3 sec, section thickness: 0.6 mm, pitch value: 0.8, coverage: 76.8 mm, kernel filter: 326 f medium smooth, matrix: 512 × 512, and FOV: 230 mm. Each patient was given 1cc/kg non-ionic iodinated contrast agent intravenously through an automatic syringe. Images were analysed using Sectra (Sectra Workstation IDS7 for Windows Version, Sectra AB, Sweden) and AW Server 2 (GE Healthcare, USA) 3D volume rendering programs. In the analysis, the diameters of the common carotid artery (CCA), internal carotid artery (ICA), and external carotid artery (ECA) (Figure 1) were measured, and bifurcation angles between the ICA and ECA, and the ICA and ECA internal angles created by the bifurcation angle with CCA normality were measured on the right and left sides separately on the 3D volume rendering images (Figure 2).
Figure 1
3D images in mediolateral position of the carotid arteries created by the AW-server2 program from the data of patients with normal and carotid diseases. In addition, the diameter measurement technique and mean diameter measurement values of carotid arteries have been given in the images
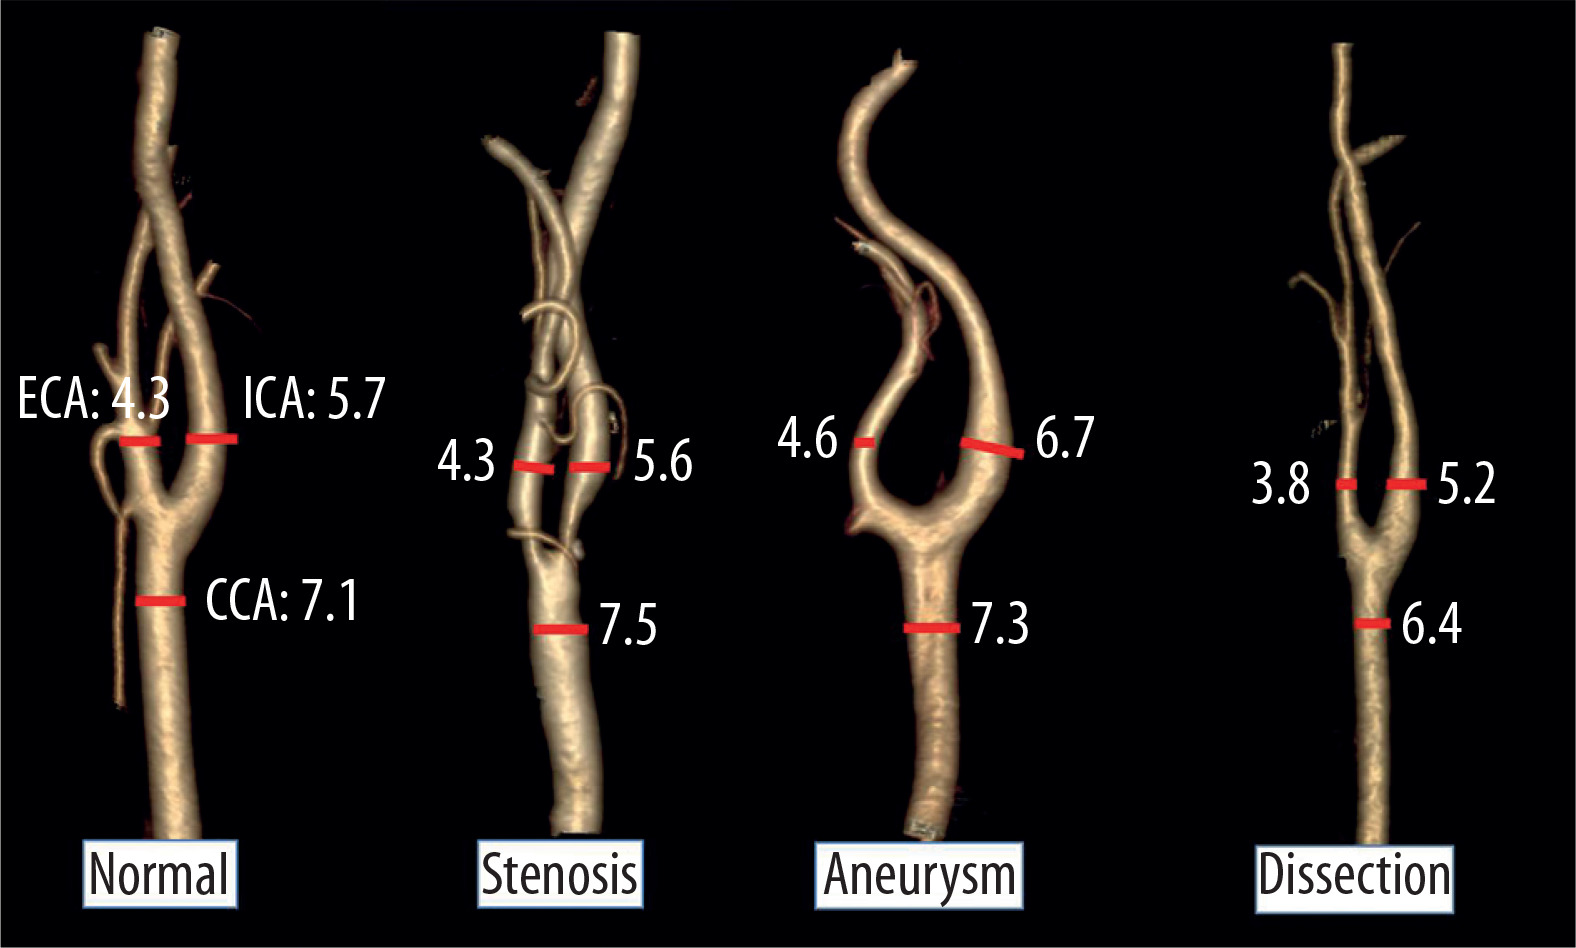
Figure 2
3D images in mediolateral position of the carotid arteries created by the AW-server2 program from the data of patients with normal and carotid diseases. In addition, the angle measurement technique and mean angles measurement values of carotid arteries have been given in the images
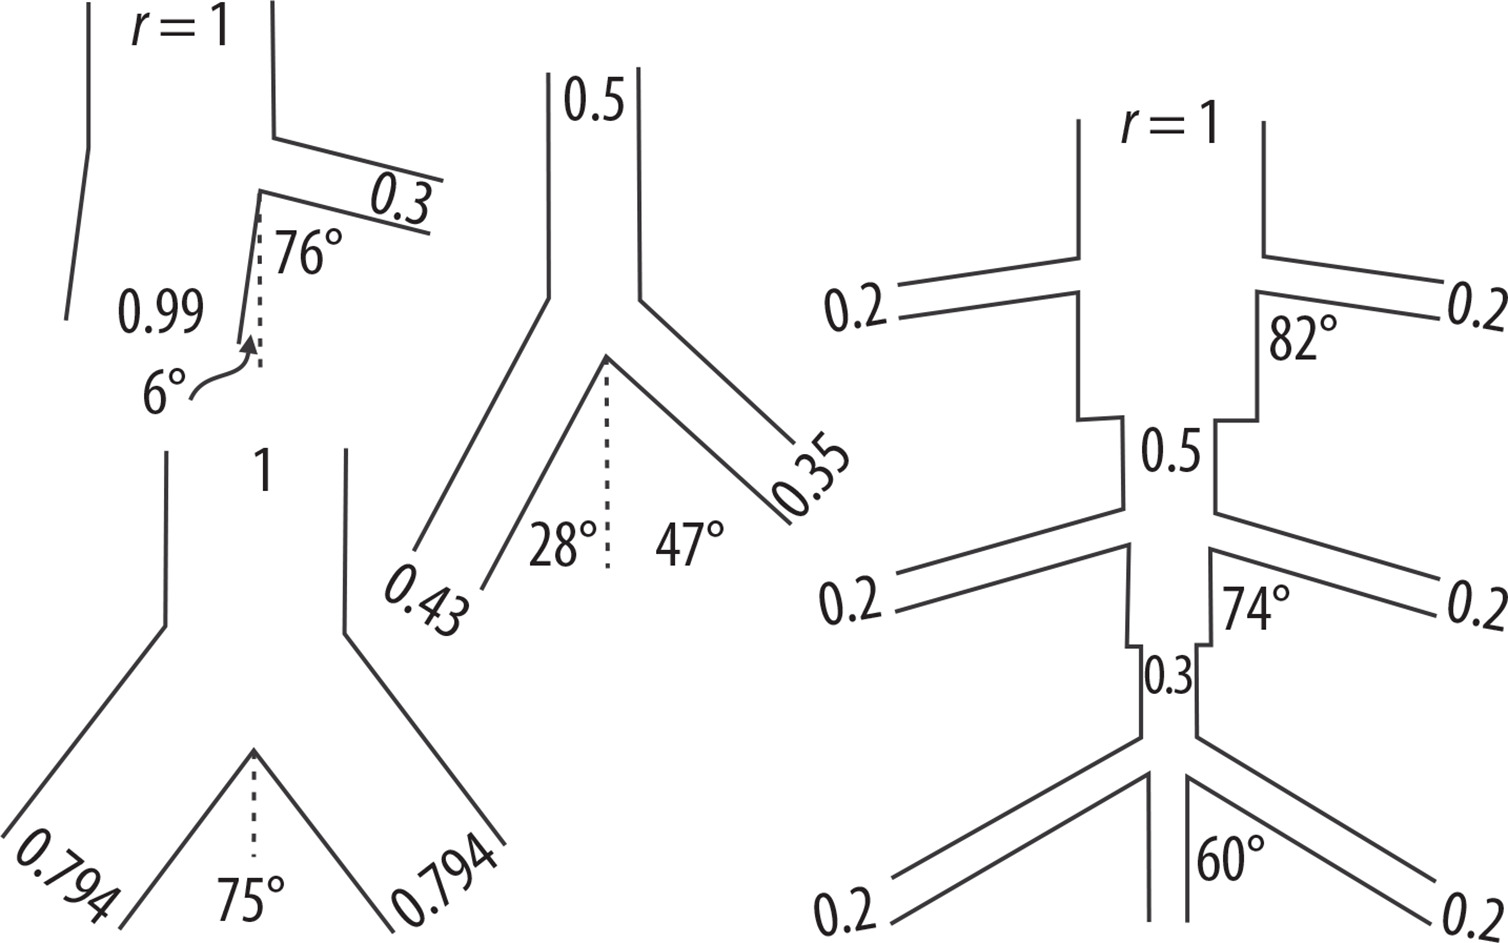
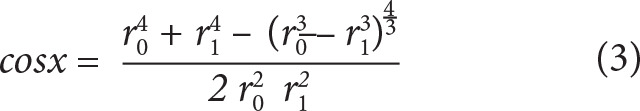
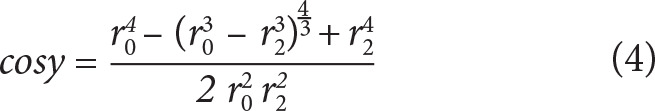
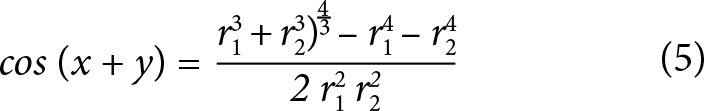
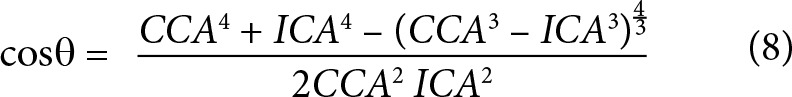
From these data, minimum flow cost functions, branching geometries, and branching ratios were calculated according to minimum flow cost functions using biophysical methods. In the calculations the following formula suggested by Murray (1926) was used; the minimum cost function, the main branch diameter cube is equivalent to sum of the lateral branches’ diameter cubes (Figures 3 and 4) (Equations 1, 2, 3, 4, 5). Murray’s cubes equation was adapted to the carotid arteries of normal patients, and the upper value of our minimum cost function was found. Murray’s minimum cost function was formalised by applying to the carotid artery and its branches (Equations 6, 7, 8, 9, 10). In these formulas, vessel lengths were considered equal and were excluded from the calculation. Furthermore, on 3D CTA images, the angles between the branches were measured, and the cosines of the found angle values were taken. Specific values and ratios were obtained by using carotid diameter and angle values and Murray’s formulas. The calculated normal values were compared with those of the patients with carotid disease. At the same time, the differences between the values calculated according to Murray’s laws and the values we formulated were evaluated. Main branch and lateral branch diameter ratios and possible Murray’s angles between lateral branches were compared (Table 1).
Table 1
Taken from Murray’s (1926). Main branch’s and lateral branches’ diameter ratios and the possible angles between lateral branches are seen
Figure 3
Taken from Murray (1926). The main branch (r0), lateral branches (r1, r2), and x and y angles between the lateral branches can be seen
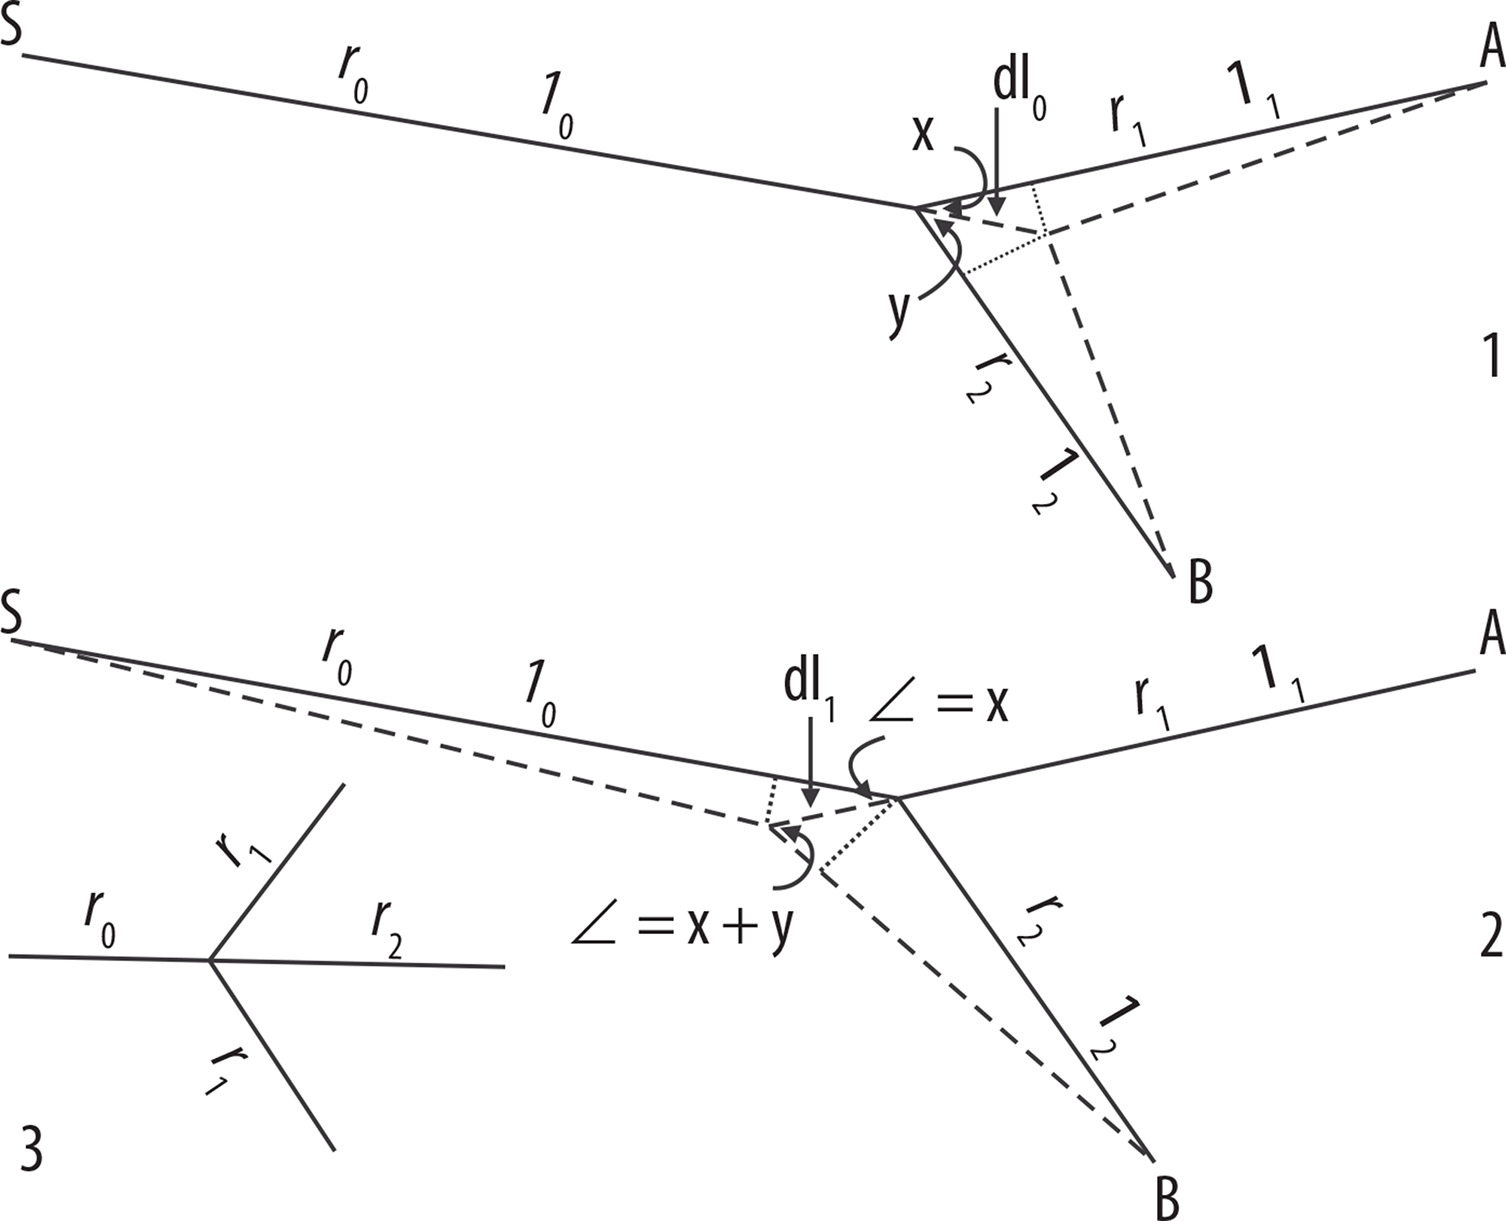
Figure 4
Taken from Murray (1926). The diameter of the main branch, diameters of lateral branches, their ratios, and the possible angles between lateral branches can be seen


These data obtained from the images of normal and pathologic patients were compared and evaluated on SPSS using descriptive statistics, independent samples t-test, Pearson’s correlation analysis, and graphical programs.
RESULTS
As a result of the analyses, carotid artery diameters and angles between the branches measured in the images of normal and pathological patients are given in Table 2. Furthermore, the ratios obtained from these diameters and angles and the calculated angle values are shown in Table 3. There was no statistically significant difference between normal and carotid stenosis patients. However, stenosis was found to occur in older patients (p = 0.001). From these results, it is also understood that the changes in the haemodynamics of the patients with stenosis are localised only in the stenosis area, and these local changes do not affect the shape and haemodynamics of the whole carotid.
Table 2
In our study demographic data showing the diameter and angle values measured on normal and diseased carotid images are seen
Table 3
In our study, the values calculated from the diameter values measured on the normal and diseased carotid images and the cosine values of the angles required for the minimum cost function calculated from the diameter and angle values are seen
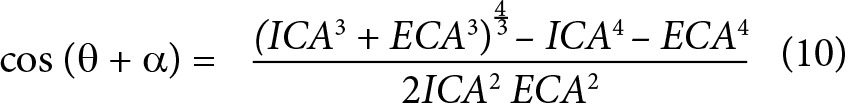
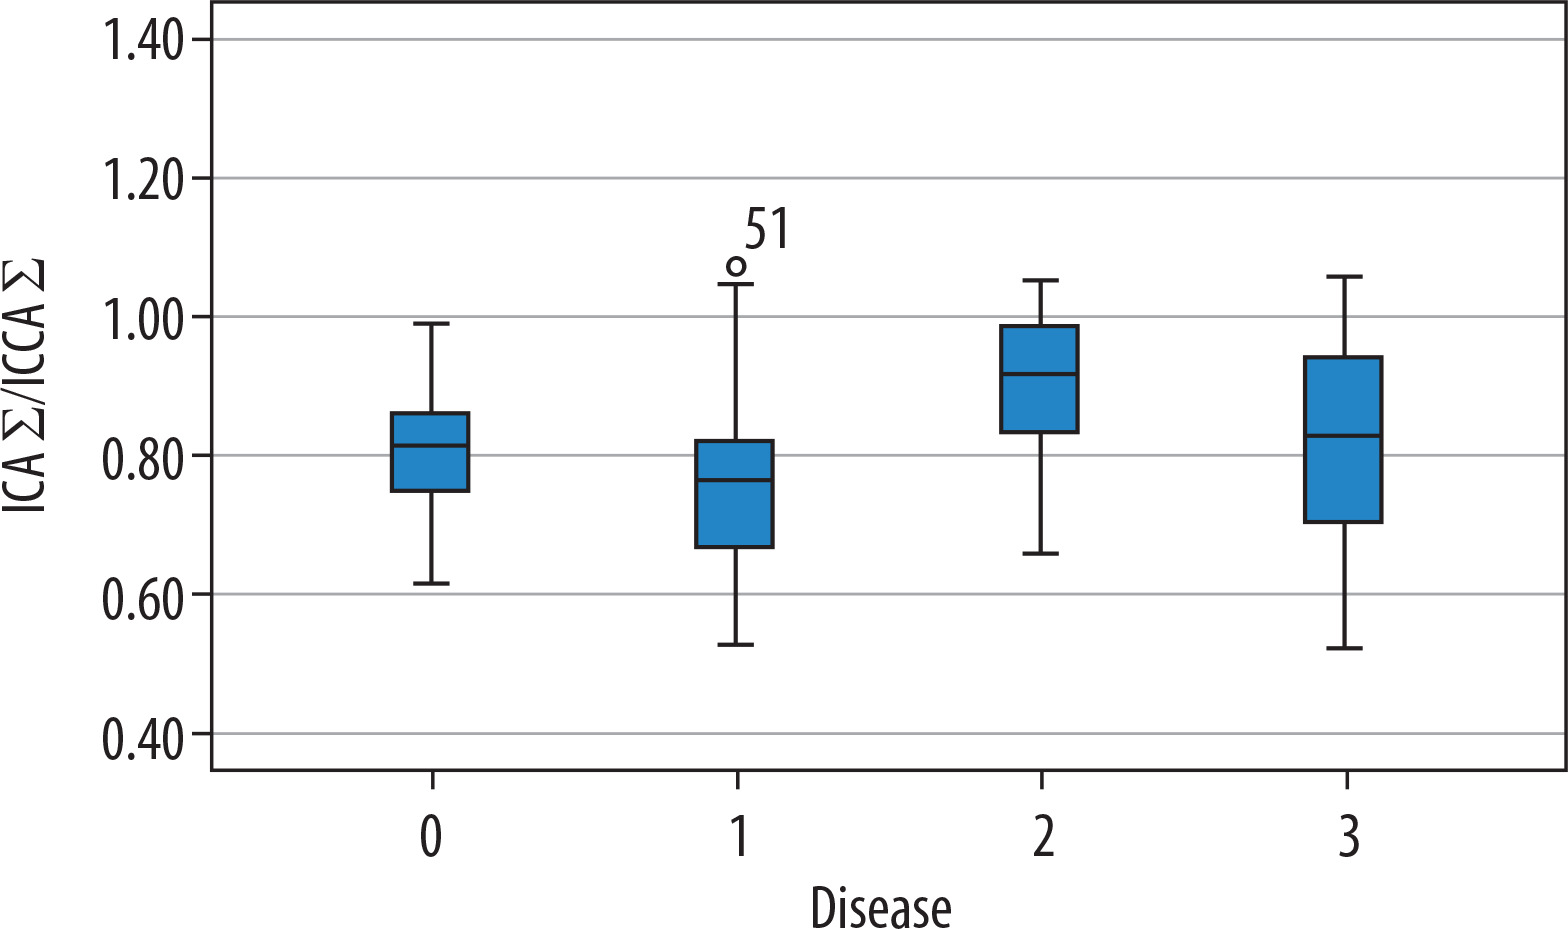
Significant differences were found in the carotid arteries of the patients with aneurysms and dissections. According to this, the following were also found to be different in the statistical comparison performed between the normal patients and those with aneurysms: right (p = 0.000) and left (p = 0.002) ICA diameters (Figure 5), total ICA diameters (p = 0.000) (Figure 6), carotid left Ø angles (p = 0.026), right and left total Ø angles (p = 0.024) (Figure 7), Murray’s and our Ø angles’ cosine values (p = 0.001 and p = 0.022) (Figure 8), and Murray’s cosine of total angles (Ø + α) (p = 0.011). In other words, the right, left, and total ICA diameters of the aneurysm patients were larger, the left and the total Ø angles were found to have higher minimum cost functions. It shows that this structural change in the carotid arteries of patients with aneurysm makes the flow difficult or increases the amount of energy required for blood flow. Besides, the ICAS/CCAS ratio (p = 0.001) (Figure 9), the ICAS/ECAS ratio (p = 0.021), (ICAS ECAS)/CCA ratios (p = 0.002), and Murray’s (p = 0.004) and our β values (p = 0.007), which are the top ratios between the main and lateral branches, were found to be different. Also, the ratios of areas and volumes between main and lateral branches were found to be significant, at p = 0.000. In other words, it is understood that the structural haemodynamics in the carotid of patients with aneurysm have been impaired. Again, when comparing carotid arteries of patients with normal and dissected; right CCA (p = 0.000), ICA (p = 0.001), ECA (p = 0.004) diameters, total CCA (p = 0.001), ICA (p = 0.009), and ECA (p = 0.003) diameters were found to be different, and narrower than for normal patients. No significant difference could be found between main and lateral branches in terms of area and volume. However, it was observed that dissection shows up at earlier ages (p = 0.016). It was seen that the diameter and angle ratios of the arteries do not change in the patients with dissection, but in general the structural haemodynamics of the arteries are narrowed compared to normal patients. These important changes can easily be seen in Figure 1 and 2.
Figure 5
The distribution of right and left internal carotid artery (ICA) diameters in patients with normal and carotid artery disease. ICA diameters of patients with aneurysms are larger, and ICA diameters of dissected patients are smaller (0 = normal, 1 = stenosis, 2 = aneurysm, 3 = dissection)
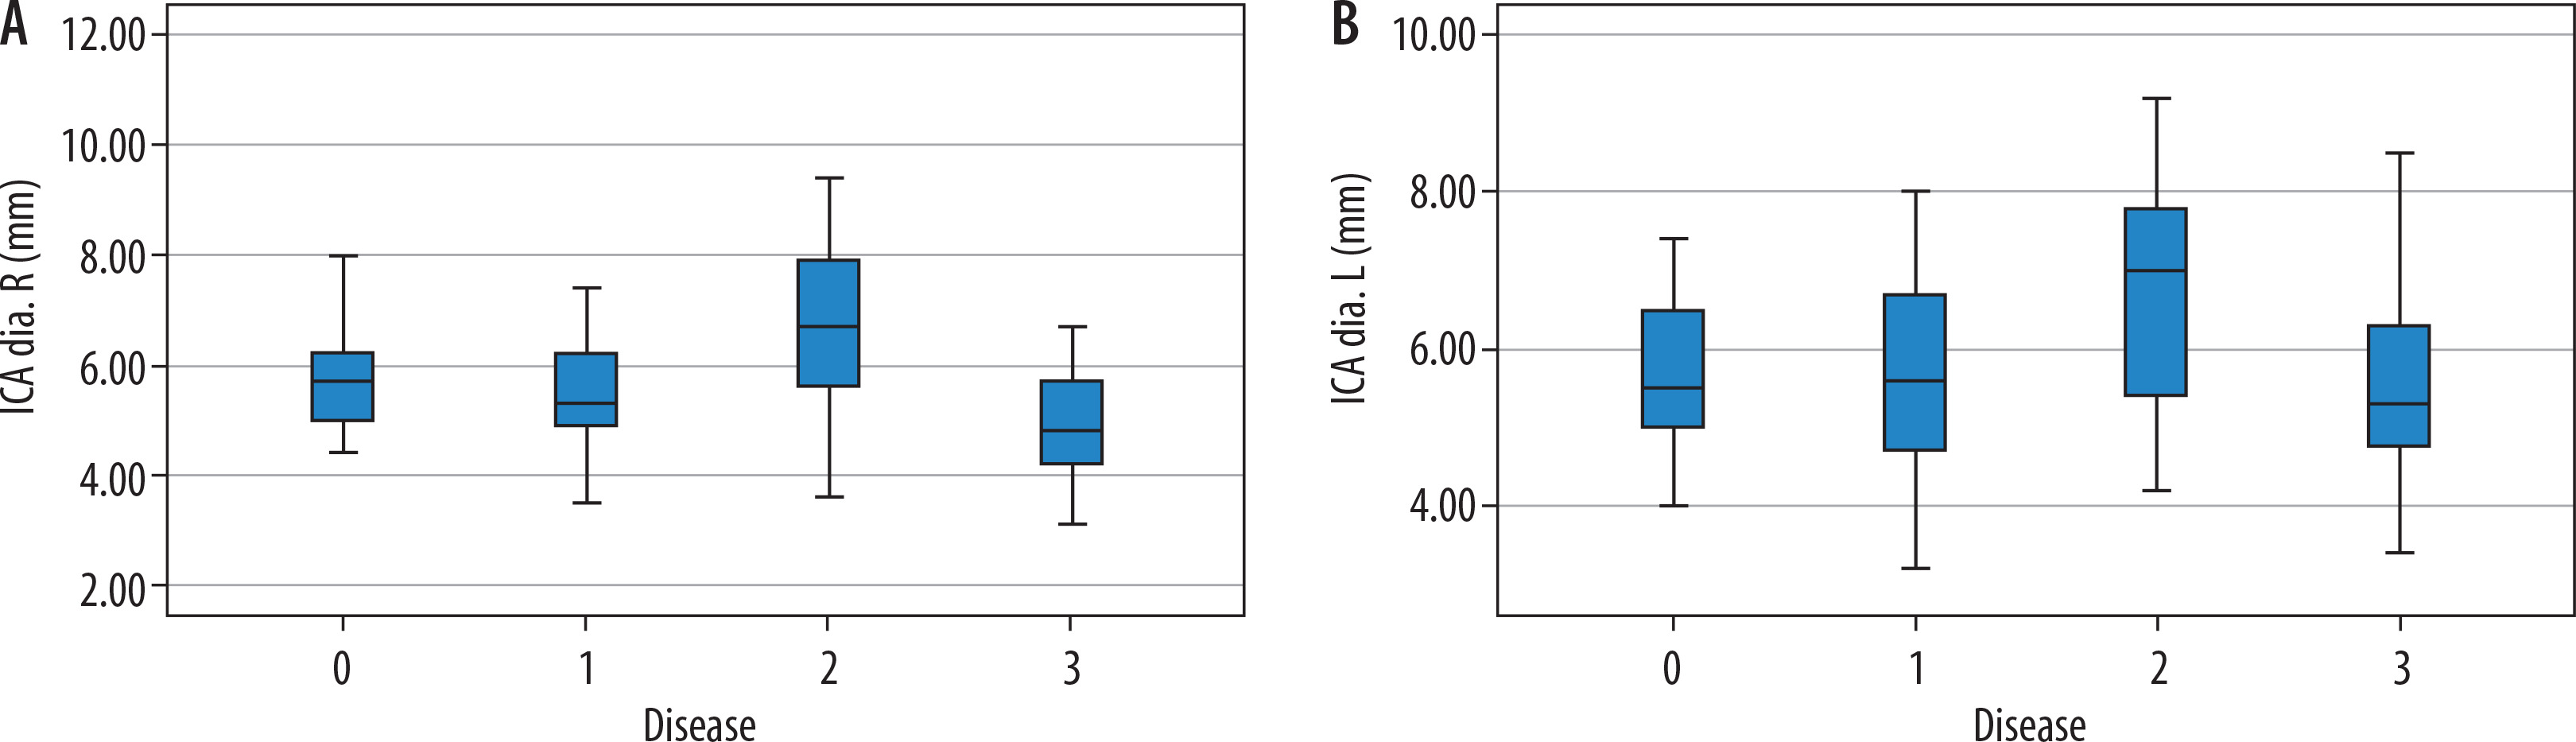
Figure 6
Distribution of total internal carotid artery (ICA) diameters according to normal and carotid diseases. ICA diameters of patients with aneurysms are large, and ICA diameters of dissected patients are smaller (0 = normal, 1 = stenosis, 2 = aneurysm, 3 = dissection)
Figure 7
Distribution of total Ø angles according to normal and carotid diseases. Ø angles of patients with aneurysms are larger (0 = normal, 1 = stenosis, 2 = aneurysm, 3 = dissection)
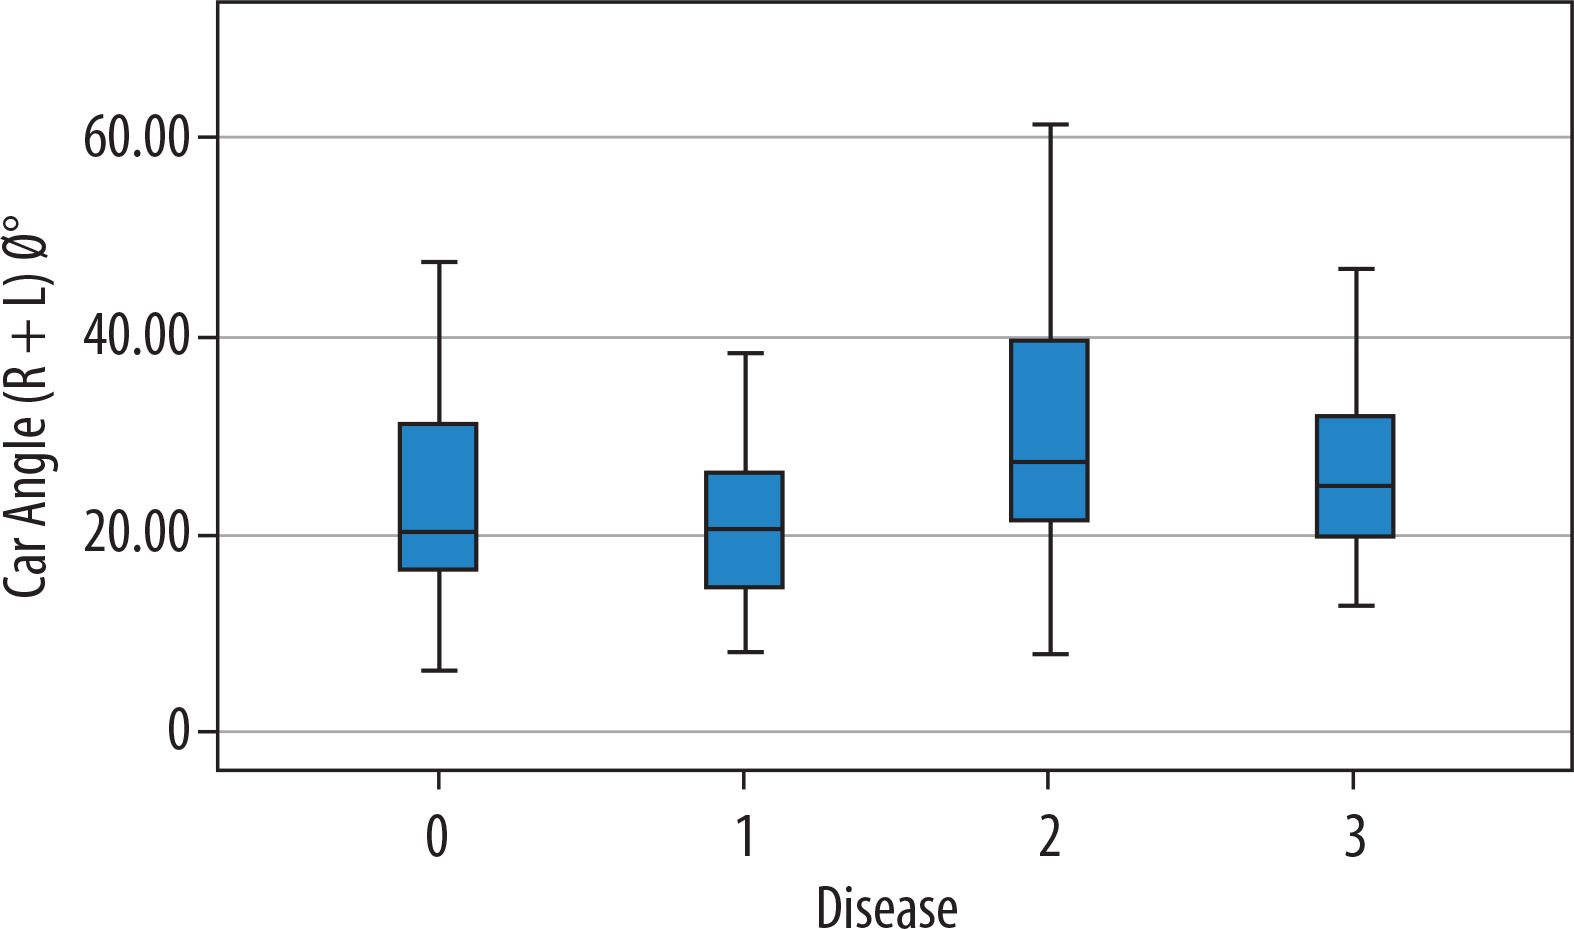
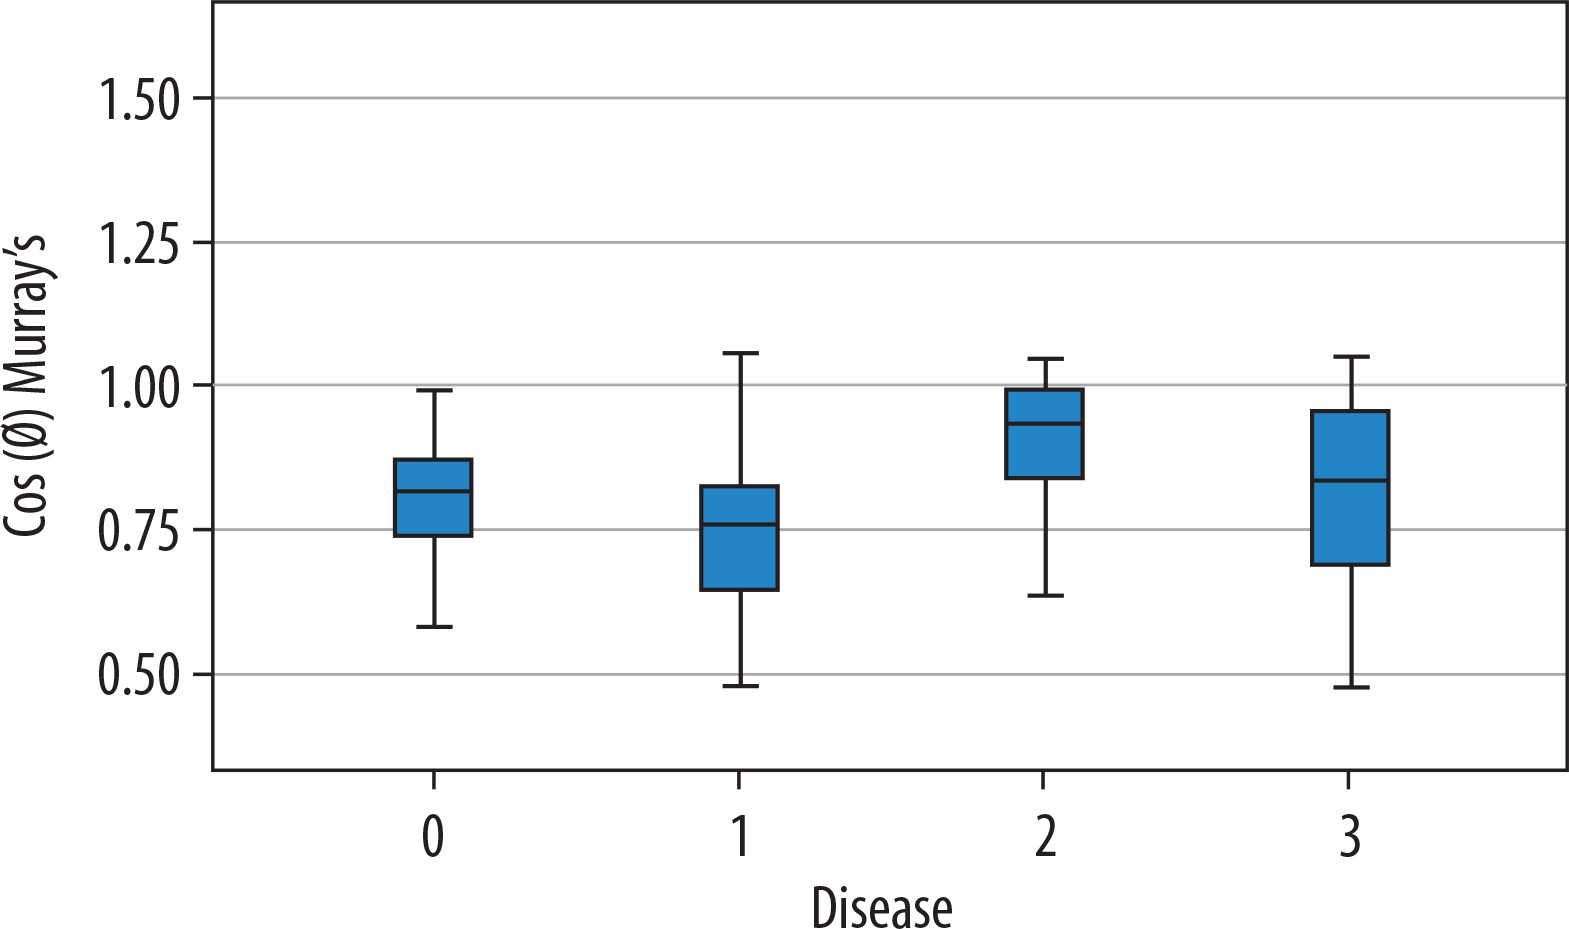
Figure 8
The distribution of minimum cost functions of the total O angles according to normal and carotid diseases. It can be seen that the minimum cost functions of the patients with aneurysm are higher; i.e., a lot of energy is required for blood flow (0 = normal, 1 = stenosis, 2 = aneurysm, 3 = dissection)
Discussion
People have long tried to learn and recognise the rules governing the vascular structure. They also believed that there are rules that optimise the branching geometry that forms the vascular structure, the construction of that geometry, and the flow of blood at the lowest energy cost within this structure. They believed that these laws continue to operate globally despite the constraints of growth and different living environments. There have also been researchers who proposed the structure-function principle for branching geometry of vascular structures. For example, Schreiner and Buxbaum [33] made suggestions on the optimal arterial design principle. And Kamiya and Togawa [34] made recommendations on the principle of minimum blood volume. Several researchers have also tested the validity of Murray’s laws using the embryo circulatory system of human, swine, monkey, rat, rabbit, and chicken: Hutchins et al. [35]; Kassab and Fung [36]; LaBarbera [37]; Sherman [38]; Taber et al. [39]; Zamir and Brown [40]; Zamir and Medeiros [41]; Zamir et al. [42].
Murray [43-45] was the first person to define the minimum cost function in vascular bifurcation. This definition is based on the Hagen-Poiseuille law that states that the most important factor regulating blood flow in the tube is the radius of the vessel. In addition, it is based on the logic of the circulatory system: “the total cost function is equal to the sum of the individual cost functions of all the units that make it up”.
Details of Murray’s laws were clearly presented by Kassab and Fung [36]. Generally, although some researchers have found that the exponential values can be between 2.7 and 3.2, they have proven that Murray’s Do³ = D13 D2³ equation is also correct. In our study, we found that the exponential value of this equation in normal patients was 2.035. However, when we compare normal values with patients with stenosis, aneurysm, and dissection, we find that Murray’s equation will give more accurate results.
Therefore, to test Murray’s law, we measured not only the diameters of blood vessels but also the bifurcation angles of the carotid arteries. In addition, from these diameter values we calculated the ratios between the main and lateral branches. The diameters, diameter ratios, and angles between the branches found in Murray’s laws are shown in Tables 2 and 3. The ratios and angle values that we found in real persons have shown correlation with Murray’s values. Angle values were smaller than Murray’s table. According to the ICA/CCA ratio (0.8), the Ø angle we measured was approximately 36°. The true bifurcation Ø angle is 23.1°. According to the ECA/CCA ratio (0.6) we measured, Murray’s table shows the α angle as approximately 55.6°. The real bifurcation α angle we measured is 24.8°. Again, for the ICA/ECA ratio [1,3], while Murray’s total angle was 75°, the total bifurcation angle (Ø˚ + α˚) we found was 47.9°. Murray also emphasised that the angle values calculated by referring to this situation would take smaller values in living arteries and arteries with large diameters [43].
Jung Yeop Lee and Sang Joon Lee obtained equivalent results with Murray in the diameter and angle study of extra-embryonic arterial bifurcation of the chicken embryo. According to this study, D1/ Do, D2/Do, and D2/Do ratios were calculated as 0.8, 0.8, and 1.0, respectively [46]. Our ICA/CCA, ECA/CCA, and ICA/ECA ratio values were found to be 0.8, 0.6, and 1.3, respectively.
In addition, a difference was found between the carotid diameter ratio of patients with stenosis and dissection. However, carotid diameter ratios of patients with aneurysms were different. As has been known for a long time, while the width of the vessel triggers the formation of aneurysm, the aneurysm plays an important role in the formation or disruption of the vessel structure. It has been seen that stenosis and dissection are not effective in vessel formation. However, it is well known that small vessel diameters trigger dissection. It is understood that local structural changes may be seen in the stenosis region in arteries with stenosis, but they cannot cause general structural remodelling. Yoshida et al. emphasised that non-occlusive stenosis was not effective in remodelling of carotid artery [47].
Zarins et al. in a carotid artery study of cadavers performed by creating a radiographic model, found the carotid diameters in the cadaver to be CCA: 6.1, ICA: 5.2, and ECA: 4 mm [48]. In the radiographic model, the diameters were CCA: 6.1, ICA: 5.7, and ECA: 4.2 mm. Bifurcation angle values were 46° in cadaver and 50° in the radiographic model. These findings were consistent with our findings (CCA: 7.1 mm, ICA: 5.7 mm, ECA: 4.3 mm, and bifurcation angle: 47.9°).
In Table 3, cos Ø (Murray›s) and cos Ø + α (Murray›s) values were found to be different in aneurysm patients. According to Murray, the ratio of areas was found to be large and the volume ratio was smaller in patients with aneurysm. The volume ratio according to the formula we calculated was smaller in patients with aneurysms. In addition, the β value was found to be highest in patients with aneurysms according to the calculated exponential value of 2.035. According to Murray’s three exponential values, the lowest β value was seen in patients with aneurysm, followed by dissection. Patients with stenosis had the highest β values.
The cosine, volume ratio, and β values of the carotid bifurcation angles we measured were found to be statistically significant. However, according to Murray’s law, they are not suitable for use in practical applications because they show the opposite direction, and we think that the meanings may cause misunderstandings.
Conclusion
This study showed that the presence of aneurysm plays an important role in remodelling of the carotid arteries. Also, it is understood that Murray’s laws are still valid for the detection of structural deterioration in carotid artery diseases. Hence, it is thought that these data can be used in artificial intelligence studies.