Introduction
Epidemiology, aetiology, and management
The SARS-CoV-2 virus is a positive-sense single-stranded RNA virus of the coronavirus (CoV) family. CoV viruses can cause respiratory, enteric, hepatic, and neurologic diseases in humans, and their ability to cross species barriers is thought to be the main mechanism of transmission that occurred in Wuhan. Whereas CoVs have been known to cause illness including common colds and self-limiting upper respiratory infections in immunocompetent individuals, lower respiratory tract infections may also occur in the elderly and the immunocompromised [1]. Human-to-human transmission most likely occurs via respiratory droplets but may also occur through aerosolization. The incubation time has been shown to range from 3 to 14 days [1]. Great efforts have been made in managing COVID-19-induced pneumonia, aberrant coagulation, and the ‘cytokine storm’ that leads to lung, nervous, gastrointestinal, cardiovascular, and renal tissue damage [2]. Current management consists of supportive care, such as oxygen support, fluid therapy, and symptom relief.
Diagnostic tools
RT-PCR testing, serologic testing to detect antibodies against SARS-CoV-2, and non-contrast chest CT scans are some of the tools used to aid and make accurate and rapid diagnoses of COVID-19 [3]. In a previous review, we suggested that the true sensitivity of CT was overestimated, and in the clinical setting CT is better utilized as a supplementary diagnostic tool. Here we revisit our previous analysis with more current data to determine whether this same conclusion holds [4]. The previous analysis was of great interest and is listed among the top 10 most cited articles published by Investigative Radiology in 2020 [5].
This review aims to stratify studies investigating the sensitivities of RT-PCR and CT for COVID-19 based on bias, to see how biases affect the sensitivities reported. This is not a review comparing the diagnostic accuracy of RT-PCR with CT, because one cannot compare the sensitivity of 2 diagnostic tests when 1 of them (RT-PCR) serves as the reference standard for the other (CT). Thus, we refrain from making definitive statements comparing the sensitivities of CT with RT-PCR; we describe the sensitivity of CT as “limited” relative to RT-PCR, for example, as opposed to “less than”, because that kind of statement cannot be made until there are sufficient studies on the sensitivity of CT that use a different, more accurate reference standard such as repeat RT-PCR testing (see Methods for more information).
Material and methods
Data sources and searches
The PubMed database was queried between 1 January 2020, and 25 April 2021 using the Medical Subject Headings search terms (sensitivity and specificity, AND RT-PCR, AND coronavirus, AND SARS-CoV-2) OR the presence of keywords (CT AND COVID-19 OR severe acute respiratory syndrome coronavirus 2) in the title, abstract, or full-text publications (n = 670). Google Scholar dataset was also searched, using the keywords “COVID-19” AND “SARS-CoV-2” AND “sensitivity” AND “coronavirus” AND “RT-PCR” AND “chest CT” AND “imaging” anywhere in the text articles published between 1 January 2020, and 26 May 2021 (n = 1050). In total 980 results were identified, of which 62 met the inclusion criteria for this study. The studies were evaluated by the authors J.W. and B.C., and discrepancies were resolved by the senior author M.H.
Study selection and quality assessment
The study protocol was registered with PROSPERO, and QUADAS-2, a quality assessment tool for studies of diagnostic accuracy, was used to stratify papers from high to low risk of bias. QUADAS-2 assesses the risk of bias based on 4 key factors:
Patient selection. Patient cohorts that included both symptomatic and asymptomatic patients were considered as low risk of bias. Inappropriate exclusion of symptomatic or asymptomatic patients would not reflect the general SARS-CoV-2-infected population and would introduce bias. Studies conducted on paediatric patients raise applicability concerns, and the authors chose to thus classify them as high risk of bias because adult patients were excluded.
Index test. Studies in which positive chest CT findings were interpreted as indicative of COVID-19 infection without RT-PCR confirmation were categorized as high risk for bias. To be considered low risk, studies were required to include patient cohorts whose diagnoses were confirmed with RT-PCR (in accordance with the American College of Radiology’s [ACR] recommendation that RT-PCR should serve as the primary diagnostic tool for COVID-19). Studies in which patients with positive CT and negative RT-PCR tests were considered COVID-19-positive were considered as high risk of bias. These studies were not excluded in this review because they still included a clinically relevant cohort of patients whose COVID-19 status was unclear. Finally, the timing of when CT was done is relevant and is study dependent.
Reference standard. Per QUADAS-2, the method by which the reference standard is conducted may introduce bias. For RT-PCR, the reference standard of this study, a proper nasal swab must have been taken from the upper or lower respiratory tract (in compliance with ACR guidelines). Because RT-PCR cannot serve as both the reference standard and comparator test against CT, this study aims instead to determine the sensitivity of CT alone as a potential diagnostic tool, rather than direct comparison to RT-PCR. Finally, RT-PCR and CT accuracy depend on their temporal usage within the disease course, and may therefore have differing clinical utility in various clinical settings.
Flow and timing. Studies that did not include all patients in the analysis were considered high risk for bias. Studies in which all patients did not undergo RT-PCR testing in the same manner (e.g. swabs not taken from the same location) were considered as high risk for bias.
Studies that did not provide information necessary for bias stratification were excluded as well as studies not published or available in English. Additional exclusion criteria included not specifying whether patients were symptomatic or asymptomatic, not indicating whether patients were adults or children, not indicating the presence of RT-PCR-confirmed SARS-CoV-2 cases within the cohort, and not including information regarding the source of the specimen used in RT-PCR. Preprints were not included in this analysis because they were not peer reviewed.
Reference standard
We refer to RT-PCR as the reference standard, as opposed to a “gold standard”, because the “gold standard” is a flawed concept given that it may be perceived as implying the test is perfect, which it is not. In fact, some may debate whether RT-PCR is even accurate enough at discriminating between COVID-19 and non-COVID-19 to call it the reference standard, given the technical challenges of sample acquisition affecting its sensitivity. Thus, without a very accurate reference test, approaches are needed like a composite reference standard (combination of several tests) or repeat RT-PCR testing.
Repeat RT-PCR testing was used as the reference standard when evaluating the sensitivity of RT-PCR (to compare the sensitivity of RT-PCR according to high-risk-of-bias studies with that of low-risk-of-bias studies), but given a lack of studies using this reference standard with CT, we employed single-use RT-PCR as the reference standard when evaluating the sensitivity of CT (and thus we refrain from making definitive statements comparing the sensitivity values reported for CT with that of RT-PCR, because one cannot compare the reference standard with the comparator test).
For CT studies, TP is defined as those in which the patient received a positive CT scan as well as a positive RT-PCR result, and FN is when the patient received a negative CT scan but a positive RT-PCR result. For RT-PCR studies, a TP is when the first RT-PCR result was positive as well as subsequent serial RT-PCR results, while a FN is one in which the first result was negative but subsequent serial RT-PCR results were positive.
Data synthesis and analysis
Compared to the inexpensive and high-throughput of RT-PCR, CT has demonstrated a specificity close to 80% for COVID-19, as well as comparatively higher cost and disparate accessibility around the world [6]. Nevertheless, CT has been proposed as a primary diagnostic test primarily due to its perceived superior sensitivity. Thus, specific focus was given to extracting sensitivity data rather than data concerning specificity, true positives, false negatives, etc. In addition, the specificity of CT for COVID-19 is well accepted, while the sensitivity is less clear because many studies report greatly varying sensitivity values, as this review will demonstrate.
Data regarding positive findings from CT and/or RT-PCR were extracted from all eligible studies. Duplicate extraction of data was performed by 2 authors. Random effects meta-analyses were performed, and the same random effects models were used to control for inter- and intra-study variability. Calculations were made in Microsoft Excel. Individual papers were sorted as biased (i.e. high risk of bias) and unbiased (i.e. low risk of bias). Heterogeneity between studies was evaluated by calculating I2, and forest plots based on the random effect models were created to demonstrate the sensitivity findings of each study for both CT and RT-PCR.
Results
Search results
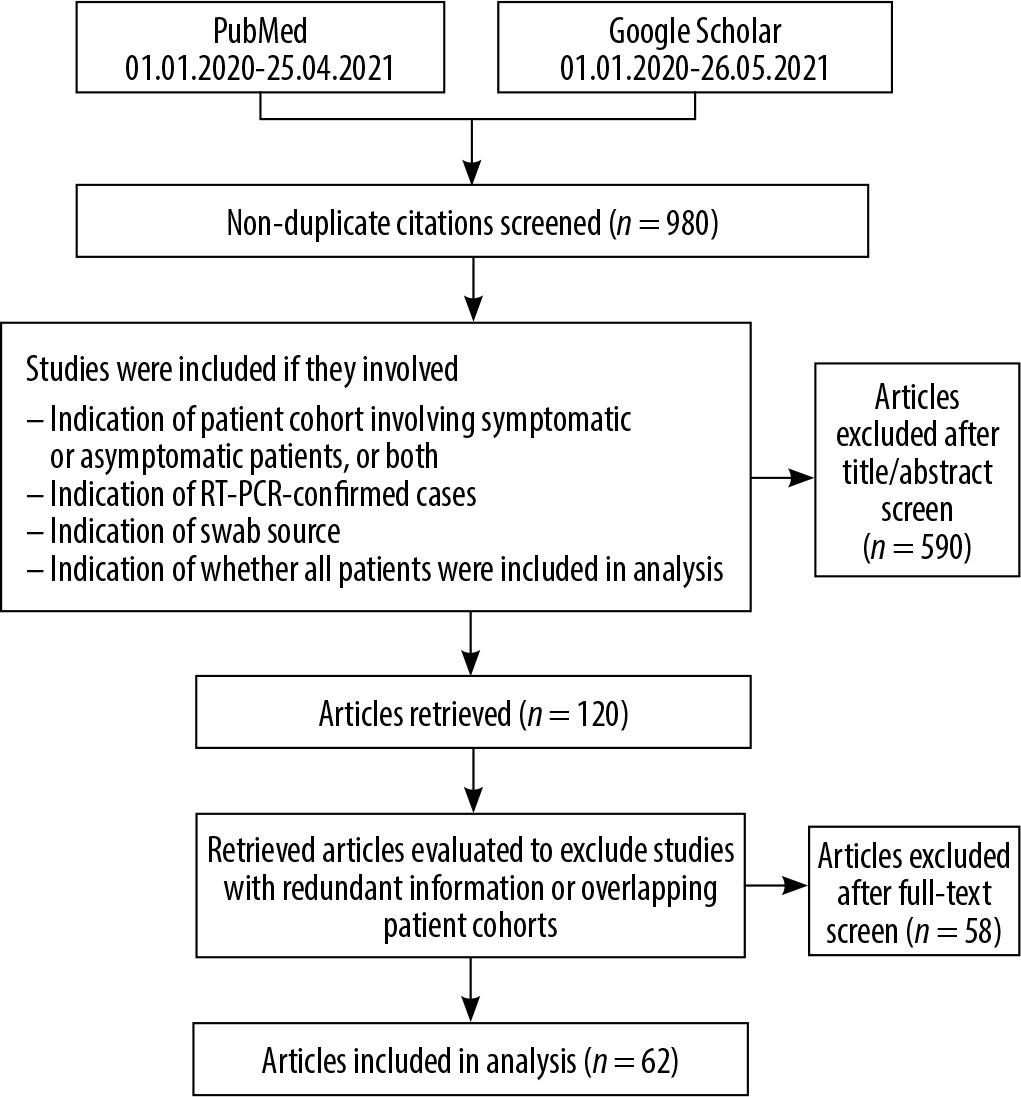
A total of 1720 search results were identified, 740 of which were duplicates. Of nonduplicate results, 590 did not meet inclusion criteria, and 58 were excluded after further eligibility review. Hence, 62 papers were ultimately included for analysis. The number of articles excluded for not meeting a specific exclusion criterion are as follows: 310 for not having sufficient patient information to satisfy the QUADAS-2 patient selection criteria, 71 for index test, 144 for reference standard, and 65 for flow and timing (for a total of 590 papers excluded). The exclusion criteria used for this study are found in Figure 1. Review studies that summarized information already extracted from papers that met the inclusion criteria were also excluded.
RT-PCR as a reference standard to detect SARS-CoV-2 infection
Methodological biases
Despite RT-PCR’s current status as the putative diagnostic test for COVID-19, many studies investigating its sensitivity and specificity are undermined by methodological biases. For example, while Li et al. reported RT-PCR sensitivity for SARS-CoV-2 detection as 27.5% (n = 610), patients were assumed to be COVID-19 positive based on chest CT indications of viral pneumonia [7]. Because not all patients presenting with CT findings of viral pneumonia have COVID-19, this assumption compromises the accuracy of RT-PCR sensitivity. Similar limitations were identified in studies whose cohorts were not conclusively confirmed as COVID-19 positive, yielding inconsistent results regarding RT-PCR diagnostic performance. Wu et al. reported RT-PCR sensitivity among suspected but unconfirmed COVID-19 patients as 51% (n = 80), while Liu et al. found RT-PCR sensitivity for SARS-CoV-2 infection to be 38.25% (n = 4880) [8,9].
In a study of exclusively symptomatic patients, Fang et al. calculated RT-PCR sensitivity for COVID-19 detection as 71% (n = 51, p < 0.001) [10]. Exclusively symptoma-tic patient cohorts were similarly utilized in numerous studies (Table 1), and a major limitation of this design is the inability to generalize results to asymptomatic COVID-19-positive individuals [10-17]. Alternatively, the study cohorts recruited by Sun et al. and Clerici et al. were limited to cancer patients and clinically recovered patients, respectively [18,19]. Ultimately, the study of suspected but unconfirmed COVID-19 patients may underestimate true RT-PCR sensitivity for SARS-CoV-2 infection. Finally, in a study of patients having undergone 2 consecutive SARS-CoV-2 RT-PCR tests, Xiao et al. reported that 78.6% (n = 70) yielded at least 1 positive result, but they did not elaborate regarding the diagnostic sensitivity following the first RT-PCR test [20]. Because the sensitivity of the initial RT-PCR alone is likely to be lower than that of 2 consecutive tests, a definitive conclusion concerning overall RT-PCR diagnostic sensitivity cannot be made from the Xiao study.
Table 1
Sensitivities of initial reverse transcriptase polymerase chain reaction (RT-PCR) for diagnosing COVID-19 infection in high-risk-of-bias studies
RT-PCR: What do low-risk-of-bias studies tell us?
This analysis only included studies that collected RT-PCR samples from individual patients, excluding studies involving pooled clinical RT-PCR samples. All studies indicated as low risk for bias (Table 2) evaluated initial RT-PCR sensitivity via repeat testing of the entire patient cohort. Nonetheless, RT-PCR sensitivity findings varied from 70% to 97% for SARS-CoV-2 infection [7,21]. He et al. reported the sensitivity of initial RT-PCR detection of SARS-CoV-2 as 79% (n = 34) [22]. Meanwhile, a national survey of 26 French hospitals by Herpe et al. found the RT-PCR sensitivity to be 87% (n = 2225) [23]. Finally, Ducray et al. reported that 278 of 287 COVID-19- confirmed patients in their cohort tested positive on their initial RT-PCR test, yielding a sensitivity of 97% [21]. We speculate that factors such as variations in disease severity and the time of RT-PCR testing relative to disease course may account for the heterogeneity of these results, as summarized in Figure 2. Finally, this review refrains from commenting on pooled RT-PCR sensitivity because such studies were excluded.
Figure 2
Forest plot of reverse transcriptase polymerase chain reaction (RT-PCR) studies showing the sensitivity of each study using a random effects model to control for heterogeneity and showing subgroups by bias in the studies
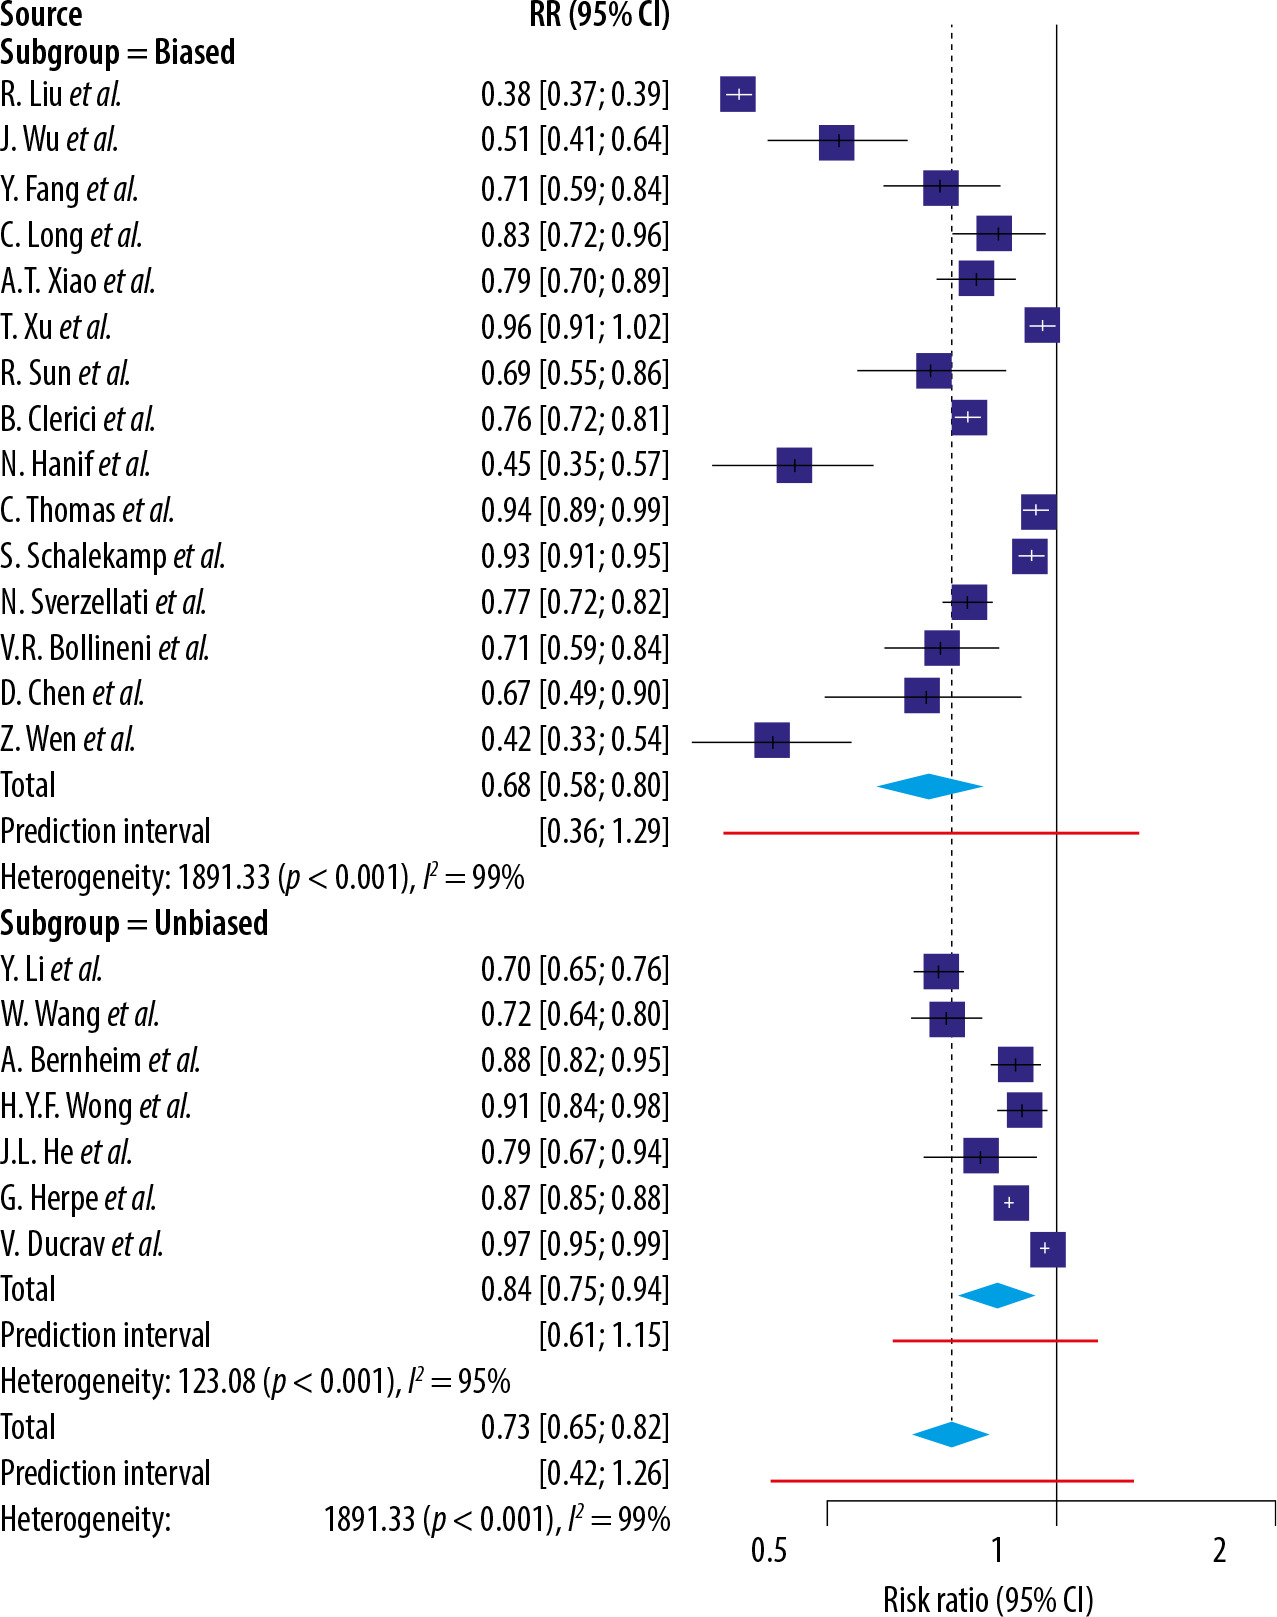
Table 2
Sensitivities of Iinitial reverse transcriptase polymerase chain reaction (RT-PCR) for diagnosing COVID-19 infection in low-risk-of-bias studies
Sensitivity of chest CT for SARS-CoV-2 infection
Methodological biases
Methodologically biased patient cohorts contributed to a lack of generalizability in several studies (Table 3). For instance, although Ai et al. reported a 97% (n = 601; 95% CI: 95-98%) chest CT sensitivity for SARS-CoV-2 detection using RT-PCR as a reference standard, this may be an overestimation because the cohort consisted of symptomatic pneumonia-presenting patients [24]. Guan et al. reported a lower sensitivity of chest CT at 82.1% (n = 877), but because this patient cohort included COVID-19 patients with severe adverse outcomes (i.e. ICU admission, need for mechanical ventilation, death), these conclusions should also be interpreted with caution [25]. As such, it is clear that the reported sensitivity in both studies mentioned above may overestimate the true sensitivity of chest CT.
Table 3
Sensitivities of initial chest CT for diagnosing COVID-19 infection in high-risk-of-bias studies
The most prevalent limitation within CT sensitivity studies was the lack of inclusion of asymptomatic COVID-19 patients [10-13,15,16,26-43]. Because asymptomatic patients account for a large subset of SARS-CoV-2-positiveindividuals, their inadequate representation in COVID-19-related research undermines the applicability of findings to the entire COVID-19 patient population. In a study whose cohort consisted solely of patients displaying respiratory symptoms, chest CT sensitivity was observed as 97% (n = 62) [30]. This finding was replicated in a smaller study of 36 patients, all of whom presented with fever alongside pneumonia [11]. In fact, several studies that reported near-perfect chest CT sensitivities (98-100%) utilized exclusively symptomatic patient cohorts [10,32,37]. Meanwhile, numerous studies citing markedly lower chest CT sensitivities (47-67% and 67-71%) utilized patient cohorts consisting of altogether paediatric and asymptomatic patients, respectively [38,44-47]. Inui et al., comparing the diagnostic sensitivity of CT between symptomatic and asymptomatic COVID-19 patients aboard the Diamond Princess cruise ship, found that CT exhibited significantly higher sensitivity in detecting SARS-CoV-2 infection in symptomatic patients (79%, n = 28) over their asymptomatic counterparts (54%, n = 76, p = 0.023) [48]. These differential results imply that inclusion of COVID-19 patients of varying disease severity may be essential to an accurate overall assessment of chest CT sensitivity and diagnostic utility in SARS-CoV-2 detection.
CT: What do low-risk-of-bias studies tell us?
Studies considered low risk for bias demonstrated slightly lower sensitivity findings for chest CT in SARS-CoV-2 detection. Among low-risk-of-bias studies, CT sensitivity for COVID-19 detection ranged from 44% to 92% (Table 4) [49,50]. Kassem et al. found chest CT to be significantly more sensitive for SARS-CoV-2 detection at more advanced diseases stages, reporting sensitivities of 50% (n = 50) and 100% (n = 53) for early and progressive COVID-19 stages, respectively, with an overall sensitivity of 76% (n = 103) [51]. Interestingly, studies with larger sample sizes reported higher sensitivity findings for chest CT [21,23,50,52-55]. For example, Falaschi et al. reported chest CT sensitivity for COVID-19 infection as 91% (n = 462), with significantly lower sensitivity in patients under 50 years old [53]. Similarly, Herpe et al. found that CT sensitivity for SARS-CoV-2 detection was 90% (n = 2564), with no significant differences across geographic regions of varying disease prevalence [23]. Likewise, Hermans et al. shared similar results in a prospective cohort study of Dutch patients, reporting chest CT sensitivity to be 90% (n = 133) [52]. Overall, our random effects meta-analyses report the mean sensitivity of chest CT as 91% (n = 5377 patients/34 studies; 95% CI: 87-96) in high-risk-of-bias studies and 78% (n = 4568/17 studies; 95% CI: 71-86) in low-risk-of-bias studies (Figure 3).
Figure 3
Forest plot of computed tomography (CT) studies showing the sensitivity of each study using a random effects model to control for heterogeneity and showing subgroups by bias in the studies.
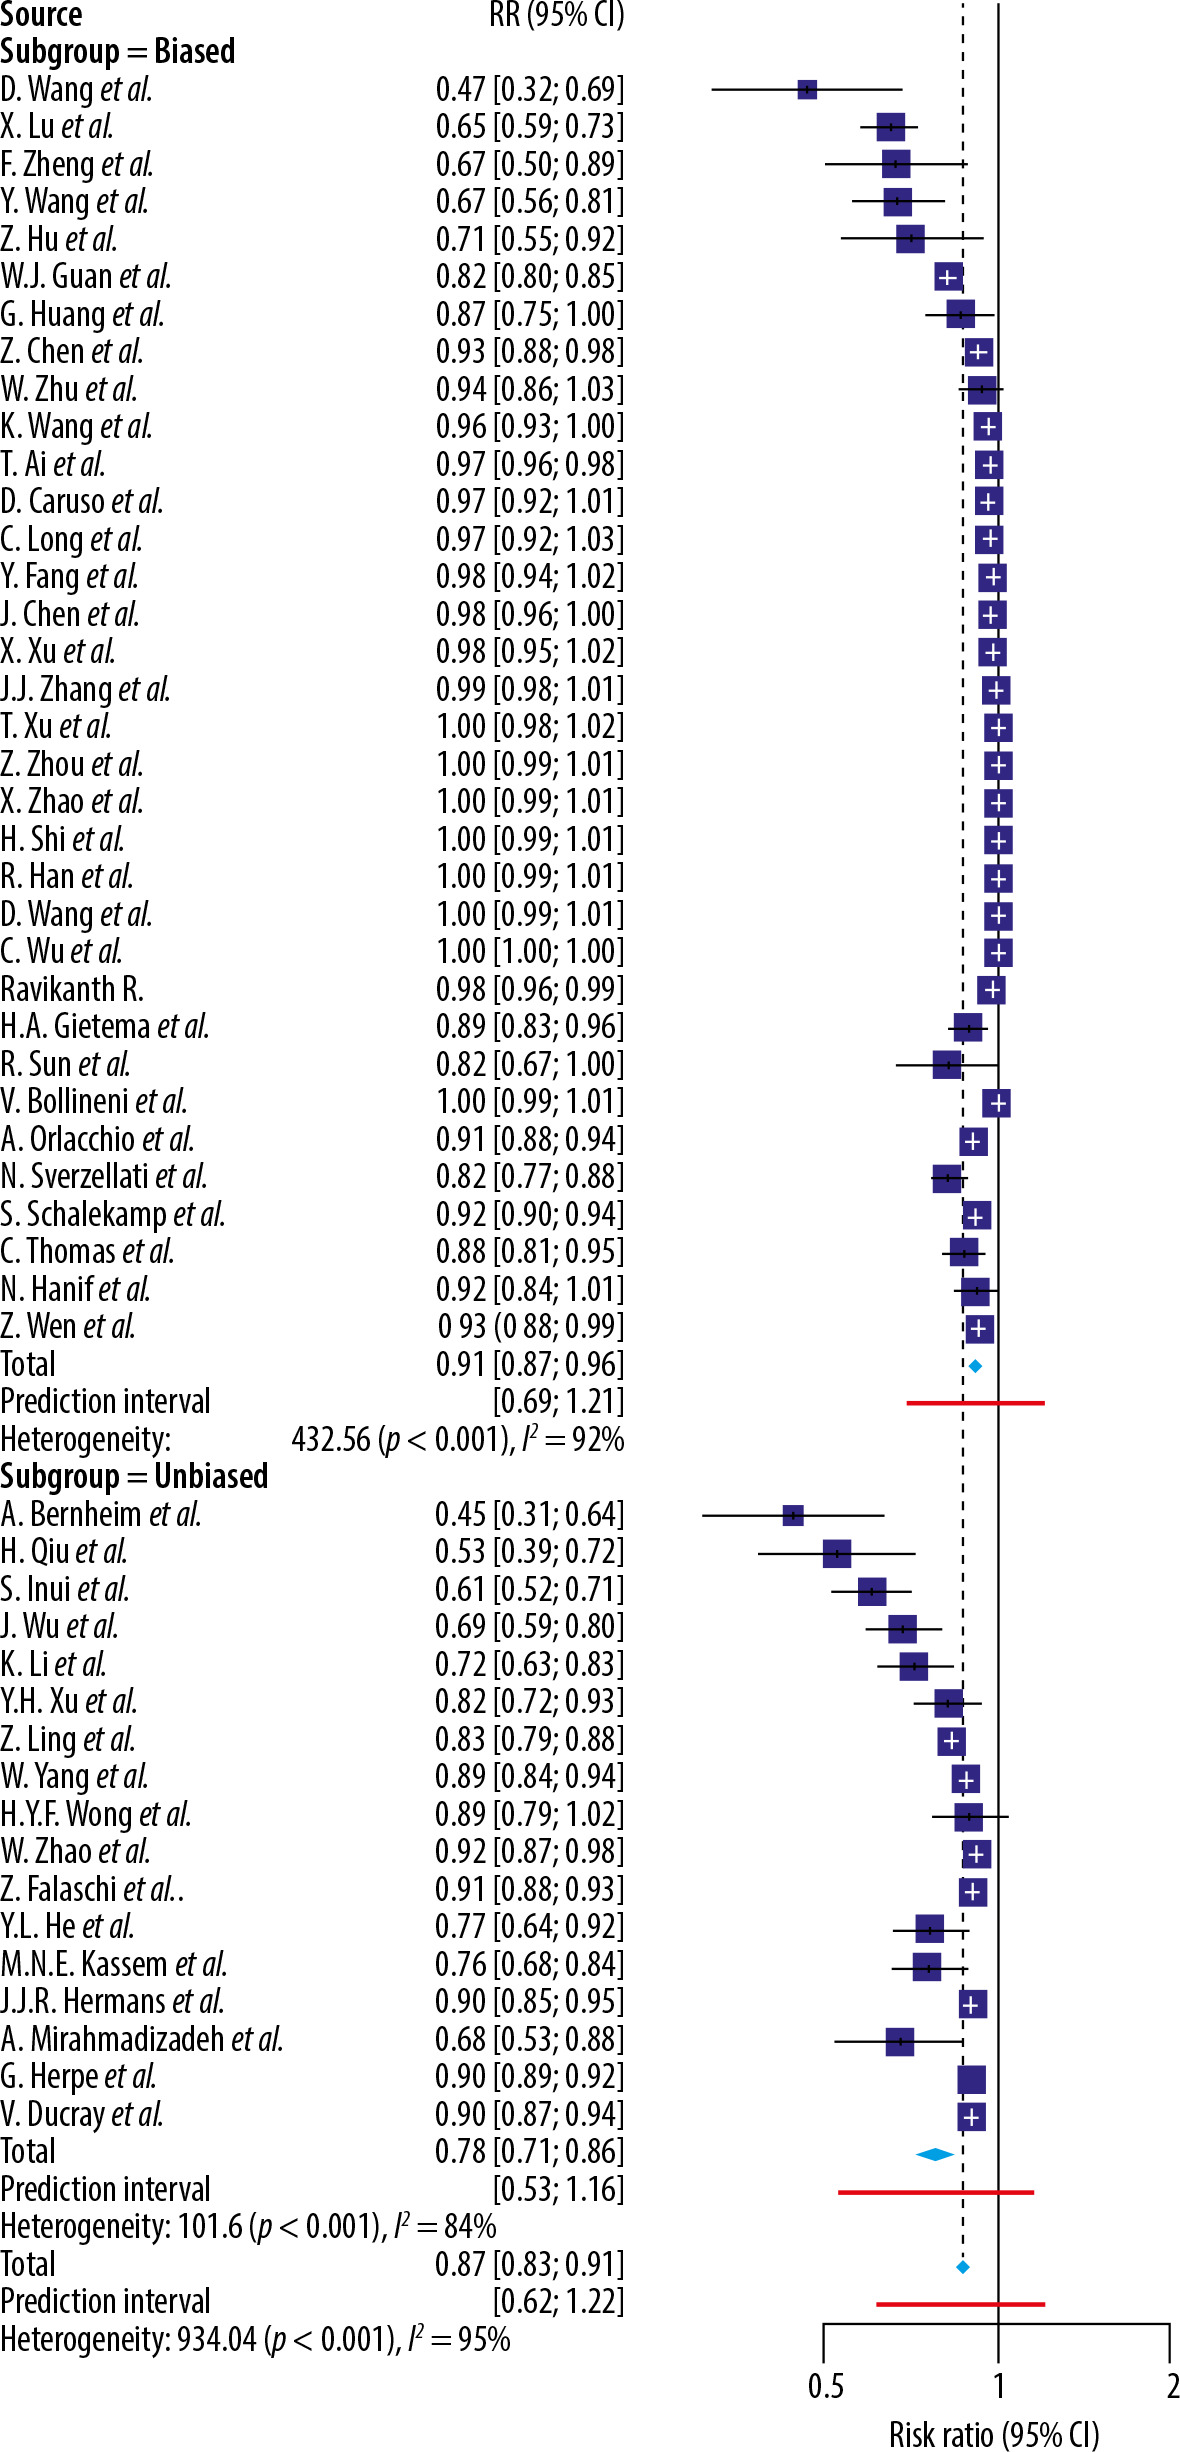
Table 4
Sensitivities of initial chest CT for diagnosing COVID-19 infection in low-risk-of-bias studies
Discussion
Whereas many factors must be considered in the overall evaluation of a test’s clinical utility, such as specificity and cost, the present study focuses on diagnostic sensitivity, a perceived strength of chest CT for the disease process studied. Our analyses identify several sources of bias conducive to overestimation of the true sensitivity of chest CT in SARS-CoV-2 detection. Among studies deemed high risk for methodological bias, many recruited exclusively symptomatic cohorts. Such approaches lend insight into chest CT sensitivity for SARS-CoV-2 infection in symptomatic individuals but fail to account for its diagnostic utility in asymptomatic patients. Consequently, conclusions regarding the sensitivity of CT from such studies cannot be reliably generalized to the entire COVID-19 patient population. Likewise, chest CT sensitivity is overestimated when patients presenting with pneumonia are at once presumed to be positive for COVID-19 [24]. Overall, these assumptions ultimately limit the generalizability of positive findings. RT-PCR sensitivity is also underestimated in studies where patients are assumed to be positive for SARS-CoV-2 infection simply on the basis of symptomatic presentation or knowledge of having been in contact with an individual confirmed for SARS-CoV-2 infection [9]. As discussed, it must be considered that not all COVID-19-positive individuals display symptoms and, conversely, not all patients presenting with COVID-19-like symptoms are true-positives for SARS-CoV-2 infection.
While RT-PCR has been instrumental in facilitating COVID-19 detection and diagnosis, a few challenges remain for its use in large-scale detection. Amidst the urgency of the pandemic, molecular diagnostic tests for SARS-CoV-2 detection were expeditiously formulated and authorized for emergency use, with limitations on the extent of validation and optimization that might otherwise have been afforded in the development process [56]. Moreover, false-negative RT-PCR results may occur due to inappropriate time of testing, inadequate sample collection, and low viral load [57,58]. Finally, RT-PCR often requires a waiting time of several hours for results to become available [59]. Conversely, RT-PCR has been commended for its high specificity for SARS-CoV-2 detection, a notable advantage over chest CT [60].
Limitations
One limitation was our exclusion of articles not published or available in English. In addition, the high I2 statistic (99% for the low-risk- and high-risk-of-bias RT-PCR studies) reflects a significant level of heterogeneity between the studies included, and range from differences clinically (such as the patient cohort) and methodologically (such as study design). Also, while we consider the absence of asymptomatic patients in a study as a bias given that many COVID-19 patients are asymptomatic, we recognize that it is challenging to include asymptomatic patients on a diagnostic test given that the tests are intended to be used on patients suspected of COVID-19 (because the same technique can be used as both a diagnostic test and a screen).
Evaluation of the clinical utility of any diagnostic tool is dependent on a variety of test statistics, including specificity, precision, and accuracy. Because the scope of this study is limited to the evaluation of sensitivity, an overall assessment of the diagnostic value of chest CT in identifying SARS-CoV-2 infection is precluded without discussion of additional test characteristics. Future studies should also address holistic factors like accessibility and cost, to facilitate a more nuanced understanding of the clinical value of CT diagnostics in the context of the COVID-19 pandemic.
CT and RT-PCR sensitivity are also influenced by additional factors, including disease onset and symptom severity. Nonetheless, several studies included in this review refrained from presenting such data, thus limiting the breadth of the sensitivity analyses conducted within this study. As such, the independent effects of COVID-19 patient characteristics such as time of onset and severity of symptoms on the sensitivity of chest CT diagnosis, respectively, remain to be elucidated.
Lastly, concerning sensitivity analyses conducted among low-risk-of-bias studies (Table 4), we acknowledge that the selective inclusion of patients with solely positive RT-PCR results (the refence standard) may slightly bias the results of this study against chest CT. This is due to the inability of CT imaging to distinguish patients with false-negative RT-PCR results. Thus, this review intentionally abstains from offering any definitive comparison statements between the diagnostic sensitivities of RT-PCR with that of CT. Rather, the primary inquiry of this study focuses on the diagnostic utility of chest CT with respect to its sensitivity in the identification of SARS-CoV-2 infection according to low- and high-risk-of-bias studies.
Conclusions
This review is a follow-up to our previous analysis investigating the methodologies of studies on the sensitivity of RT-PCR and CT for SARS-CoV2 infection. CT has been shown to be a highly sensitive diagnostic test in diagnosing SARS-CoV2, but biased methodology inflates sensitivity values and limits generalizability to non-symptomatic populations. While the sensitivity for CT decreased after adjusting for biases, it did not decrease as much as in our original study, which incorporated fewer studies. Conversely, biased methodology may underestimate the sensitivity of RT-PCR by assuming a SARS-CoV2 diagnosis based on symptomology or contact. After adjusting for this bias, when compared to our prior review, the sensitivity values increased for both CT and RT-PCR. Furthermore, incorporating recent data increased the reliability of sensitivity values by expanding the sample size of the low-risk-of-bias studies analysis. It is important to note that CT and RT-PCR were not compared directly to each other because RT-PCR serves as a reference and not a comparator/gold standard. Further large-scale comparator studies using low-risk-of-bias methodologies are still needed to more accurately evaluate these diagnostic tools.