

Introduction
The coronaviruses, which include the causative agent of coronavirus disease 2019 (COVID-19), caused a very deadly pandemic all over the world by inducing severe acute respiratory syndrome (SARS), and this coronavirus was named SARS-CoV-2. The course of COVID-19 has a spectrum ranging from asymptomatic to mild, moderate to severe and fatal. COVID-19 has a severe course in the elderly and those with comorbidities (such as hypertension, hyperlipidemia, diabetes, and chronic lung or kidney disease) and/or immunodeficiency [1, 2]. In addition to these risk factors, patient fever, blood pressure, respiratory rate, oxygen saturation, neutrophil-to-lymphocyte ratio (NLR) and bilateral diffuse chest infiltration findings on X-ray or computed tomography are important for the evaluation of disease severity and for triage of patients [3-7]. Since all these parameters are associated with the acute phase of the disease, they have limited value in predicting disease severity. Therefore, new parameters are needed.
Although the exact pathophysiological mechanism is unknown, it was suggested that high levels of proinflammatory cytokines released linked to an inappropriate response of the immune system against SARS-CoV-2 play a role in the exacerbation of the disease [8, 9]. The main pathology here is the loss of immune regulation. Based on this information, it is thought that a biomarker that can evaluate the innate immune system, which manages the immune system response and constitutes the first barrier against various pathogens, will provide useful information about disease progression. For this purpose, polysaccharide antibodies called isohemagglutinins (IHs), a product of the innate immune system and produced against A or B erythrocyte antigens, were considered for use [10, 11]. It was also suggested that IHs can be combined with other members of the innate immune system (such as natural killer cells and lymphocytes) for more accurate prediction.
In this study, conducted in light of the above information, the records of patients treated with clinical care (CLC) or in the intensive care unit (ICU) were examined to investigate whether there was a relationship between the results of IH and derived IH (dIH), hemogram and biochemical tests performed during their first admission with disease progression and mortality.
Material and methods
Study design
The research was planned as a retrospective study. The necessary permission (instead of informed consent from participants) was obtained from the Ministry of Health of the Republic of Turkey (No. 2020-08-22T18-07-40) to use patient data. Real-time PCR test results and other laboratory records of 21,500 patients with suspected COVID-19 in the clinics and intensive care unit of Sultan 2. Abdulhamid Han Training and Research Hospital between June 2020 and March 2021 were examined. A total of 352 COVID-19 patients with isohemagglutinin IgM test results were divided into 3 groups (CLC group, ICU group and mortality group) according to CLC, ICU intake and mortality as indicators of disease severity.
Inclusion and exclusion criteria
Among the patients with COVID-19, whose clinical follow-up was made from the first stages of the disease, those who had positive real-time PCR test results as well as isohemagglutinin and hemogram tests were included in the study.
Patients with COVID-19 who were admitted to the hospital in the advanced stages of the disease, those who came by transfer or who could not be followed up due to being transferred to a different hospital were not included in the study. In addition, patients with negative PCR test results but diagnosed with COVID-19 by thoracic computed tomography (CT) were also excluded from the study.
Demographic characteristics and clinical history
Demographic information of patients (such as age, gender, chronic disease status), symptoms (fever, shortness of breath, cough, fatigue, headache, back or joint pain, muscle pain, sore throat, diarrhea, loss of taste or smell), clinical or ICU admission status and duration, erythrocyte suspension (ES) and/or convalescent immune plasma (CIP) usage status, O2 support, intubation, and respirator status data were collected from patient records.
IH titers and dIH
Blood types and IH IgM titers (anti-A1 and anti-B) of all patients were determined using ABO/Rh D forward and reverse blood grouping technique and the microplate direct hemagglutination method (Neo Iris Fully-automated blood bank instrument, Immucor, Inc., Germany). IH titers were determined as the highest dilution score (endpoint titer) that gave a positive reaction (1/0.5, 1/1, 1/2, 1/4, 1/8, 1/16, 1/32, 1/64, 1/128 and 1/256). If the highest titer giving a positive reaction was 1/256, the titration was expressed as 256, and if it was 1/0.5, the titration was expressed as 0.5.
In this study, in order to compare the IH values of the patients, the anti-B IgM titers found in patients with A and O blood groups were taken as the basis, since they are more common. In the study, the anti-A1 IgM results of individuals with blood type O tended to be higher than the anti-B IgM results. Therefore, in order to eliminate the difference, the following correction equation was used to adapt anti-A1 titers to anti-B titers in patients with blood group B. Thus, the effect of negativity was limited in this study conducted with two different types of IH (anti-A1 and anti-B IgM).
Anti-B IgM = anti-A1 IgM × 0.638 + 2.764
The correction equation was created based on the relationship determined by linear regression analysis between anti-A1 IgM and anti-B IgM results of 102 patients with blood type O because there was a high correlation between anti-A1 IgM and anti-B IgM results of these patients (Spearman r = 0.807, p < 0.001). The patients with blood type AB were excluded from the study because there was no measurable IH formed against A and B erythrocyte antigens in their blood [12].
dIH values were obtained by dividing IH by NLR.
In the post hoc power analysis based on the dIH independent variable of the patient groups, the power of the study was 0.99 (α = 0.05, effect size = 3.414) and the effect size (eta squared: η2) was 0.81.
Biochemical results and hematological indices
The hematological indices [leukocytes, neutrophils, lymphocytes, monocytes, %eosinophils, %basophils, NLR, derived NLR (dNLR), lymphocyte to monocyte ratio (LMR), erythrocytes, hemoglobin, hematocrit, mean corpuscular volume (MCV), red cell distribution width (RDW), platelets, mean platelet volume (MPV), platelet distribution width (PDW), platelet to lymphocyte ratio (PLR)] and biochemical results (glucose, urea, creatinine, eGFR, albumin, aspartate aminotransferase (AST), alanine aminotransferase (ALT), γ-glutamyl transferase (GGT), alkaline phosphatase (ALP), lactate dehydrogenase (LDH), creatine kinase (CK), C reactive protein (CRP), sodium, potassium, calcium, erythrocyte sedimentation rate (ESR), procalcitonin, prothrombin time (PT), fibrinogen, D-dimer) of the patients included in the study were extracted from the patient records within the first 24 hours after admission to the CLC or ICU. All tests were performed using a clinical chemistry analyzer (Architect c16000, Abbott Diagnostics, USA and Cobas c 501, Roche Diagnostics, Germany), hematology auto analyzer (Mindray, BC-6800, China) and automatic coagulation device (STA Compact Max3, Diagnostica Stago, France).
Statistical analysis
All statistical analyses were performed using IBM SPSS statistics version 25 (USA) and MedCalc version 15.8 software. One-way analysis of variance (ANOVA) was used to compare the parametric data of three independent groups in the study, and the Kruskal-Wallis test (nonparametric ANOVA) was used to compare the nonparametric data. The Mann-Whitney test was used to compare nonparametric data in two groups. Multinomial logistic regression analysis was used to determine the effects of dIH, age and CRP (independent risk factors) on ICU admission and mortality (dependent variables) and to estimate the dependent variable. Receiver operating characteristic (ROC) analysis was used to compare the diagnostic power of dIH, IH, NLR, age and CRP parameters for determining ICU admission and mortality. The χ2 test was used to evaluate categorical data.
Results
Characteristics of the patients
The age range of 352 patients (female/male = 130/222) with COVID-19 included in the study was 18-97 years. When the ages of the patients were examined, 11% were ≤ 39 years, 15% were 40-54 years, 19% were 55-64 years, and 55% were ≥ 65 years old. Of the patients, 186 had blood type A, 102 had blood type O, and 64 had blood type B (Table 1). There was no difference between CLC, ICU and mortality groups in terms of blood group type. Of the patients who died, 73% were aged ≥ 65 years and 21% were aged 55-64 years.
Table 1
Comparison of demographic results in patients with COVID-19 according to the clinical care, intensive care unit and mortality status
a Kruskal-Wallis test (nonparametric ANOVA) with post-hoc test (Dunn’s multiple comparisons test). The P value is approximate (from χ2 distribution);
* Comparison p values between groups (A-B, A-C and B-C, respectively) were determined when p value obtained by ANOVA was < 0.05 (significant). Nonparametric data are given as median (min-max) while parametric data are given as mean ± standard deviation. Patients in the ICU group are those who are discharged after recovery. NPCD – number of patients with chronic disease, NCD-P – number of chronic diseases in patients with chronic disease,
Comparison of groups in terms of demographic characteristics, anamnesis, and clinical status
Demographic and anamnesis data according to CLC, ICU and mortality group as indicators of disease progression for patients with COVID-19 are given in Table 1. There was a significant difference between the groups in terms of age, number of patients with chronic disease (NPCD), CT findings, hospital stay, O2 support, intubation, respirator use, ES treatment and CIP treatment, especially in favor of the mortality group. There was no difference in terms of gender and blood group types. Except for one patient, all patients in the mortality group were admitted to the ICU.
Comparison of groups in terms of hematological and biochemical test results
Isohemagglutinin and dIH values of the ICU and mortality groups were statistically significantly lower, while the age and NLR values were higher, compared to the CLC group with a milder disease progression (Fig. 1A-D and Table 2). The CRP levels of the mortality group were higher than the other two groups (Fig. 1E and Table 3).
Fig. 1
Derived isohemagglutinin (dIH), IH, age, NLR and CRP results of CLC, ICU and mortality groups. Age, NLR and CRP results of patients who were admitted to the ICU and died were higher, while the dIH and IH results were significantly lower. Statistical comparisons were made according to whether the data were parametric or not. aKruskal-Wallis test (nonparametric ANOVA) and bone-way analysis of variance (ANOVA) with post-hoc test
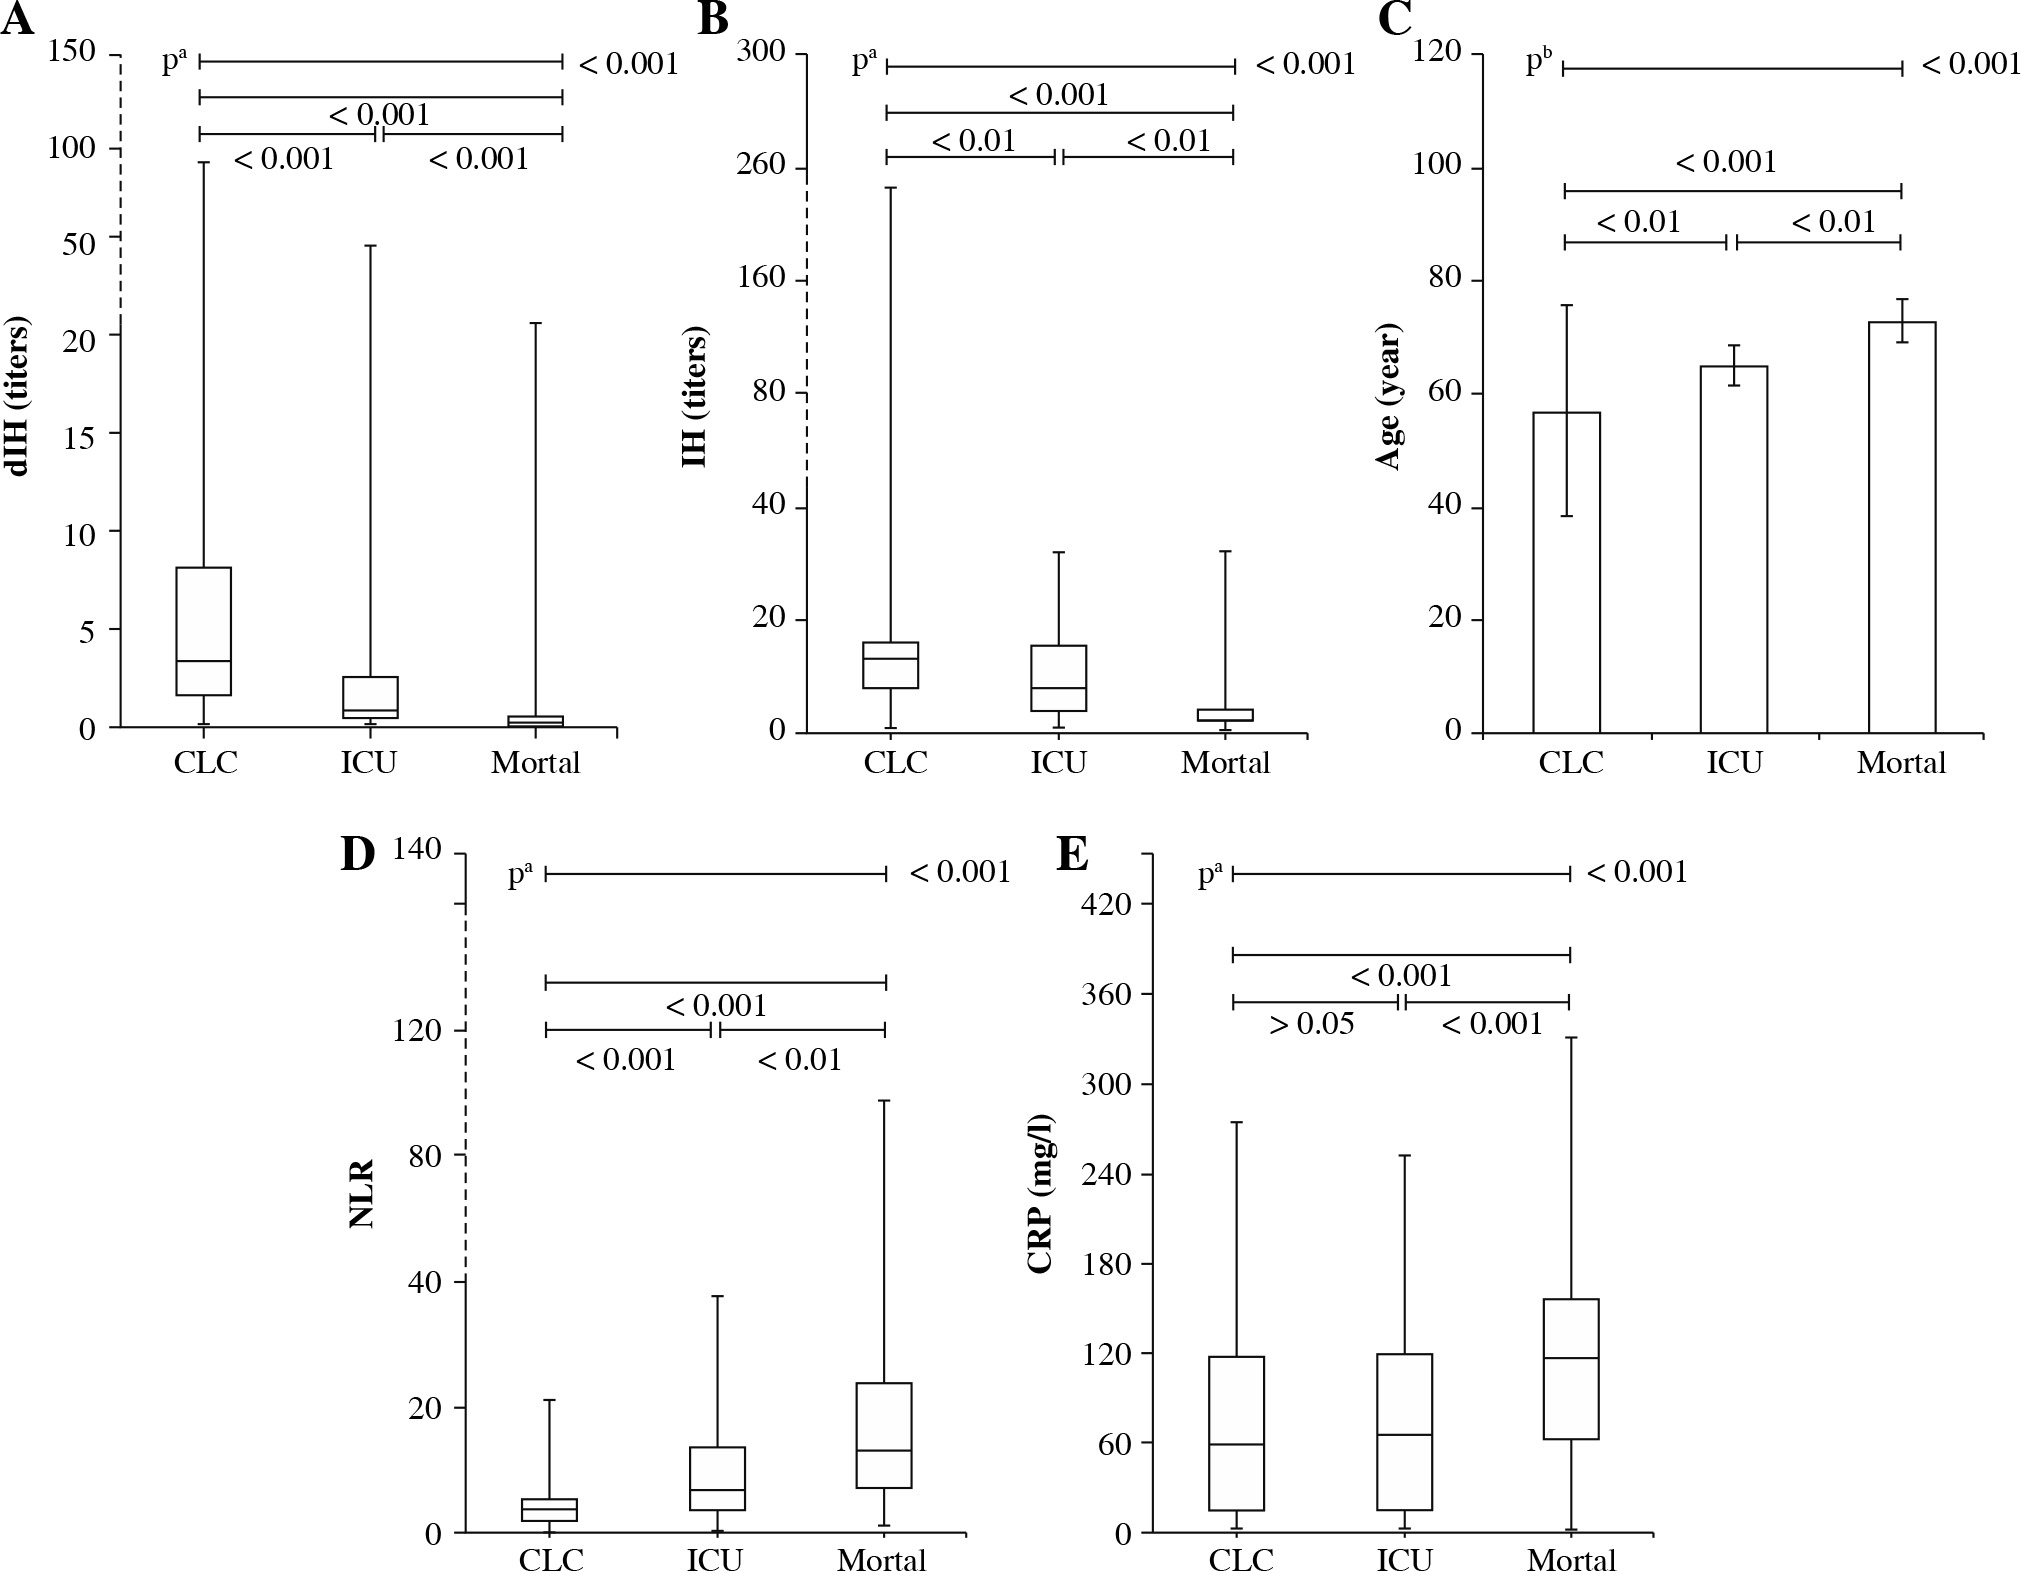
Table 2
Comparison of hematological indices between clinical care, ICU and mortality status
a Kruskal-Wallis test (nonparametric ANOVA) with post-hoc test (Dunn’s multiple comparisons test). The P value is approximate (from χ2 distribution).
* Comparison p values between groups (A-B, A-C and B-C, respectively) were determined when p value obtained by ANOVA was < 0.05 (significant). Nonparametric data are given as median (min-max) while parametric data are given as mean ± standard deviation. Patients in the ICU group are those who were discharged after recovery. Isohemagglutinin results obtained from anti-A1 and/or anti-B IgM. NLR – neutrophil to lymphocyte ratio dNLR (derived NLR) = neutrophils/(leukocytes-neutrophils)
Table 3
Comparison of isohemagglutinins and biochemistry blood test results between clinical care, ICU and mortality status
a Kruskal-Wallis test (nonparametric ANOVA) with post-hoc test (Dunn’s multiple comparisons test). The P value is approximate (from χ2 distribution). bOne-way analysis of variance (ANOVA), cMann-Whitney test.
* Comparison p values between groups (A-B, A-C and B-C, respectively) were determined when p value obtained by ANOVA was <0.05 (significant). Nonparametric data are given as median (min-max) while parametric data are given as mean ± standard deviation. IH was obtained from anti-A1 and/or anti-B IgM results. IH – isohemagglutinin titers, dIH – adjusted IH, AST – aspartate aminotransferase, ALT – alanine aminotransferase, GGT – γ-glutamyl transferase, ALP – alkaline phosphatase, LDH – lactate dehydrogenase, CK – creatine kinase, CRP – C-reactive protein
Hematological indices, ESR and biochemical test results of the patients according to study groups are compared in Tables 2 and 3. There was a statistically significant difference between the groups in favor of ICU and mortality groups in terms of leukocytes, neutrophils, lymphocytes, NLR, dNLR and LMR values. In contrast, erythrocytes, hemoglobin, hematocrit and PLR values of the ICU and mortality groups were found to be lower compared to the CLC group. The platelet values of the patients in the mortality group were lower than in the other groups.
There was a significant difference between the groups in terms of ESR, glucose, urea, and creatinine, especially in favor of the mortality group. eGFR and albumin values of the mortality group were quite low compared to the other groups (Table 3). Differences observed in urea, creatinine, eGFR and albumin levels were associated with age and age-related renal pathology. Again, LDH and D-dimer levels of the ICU and mortality groups were higher than in the CLC group. Calcium levels were lower and prothrombin time was longer in the mortality group compared to the CLC group. In addition, while there was no difference between the other groups, there was a difference between the CLC group and the mortality group in terms of GGT and ALP levels.
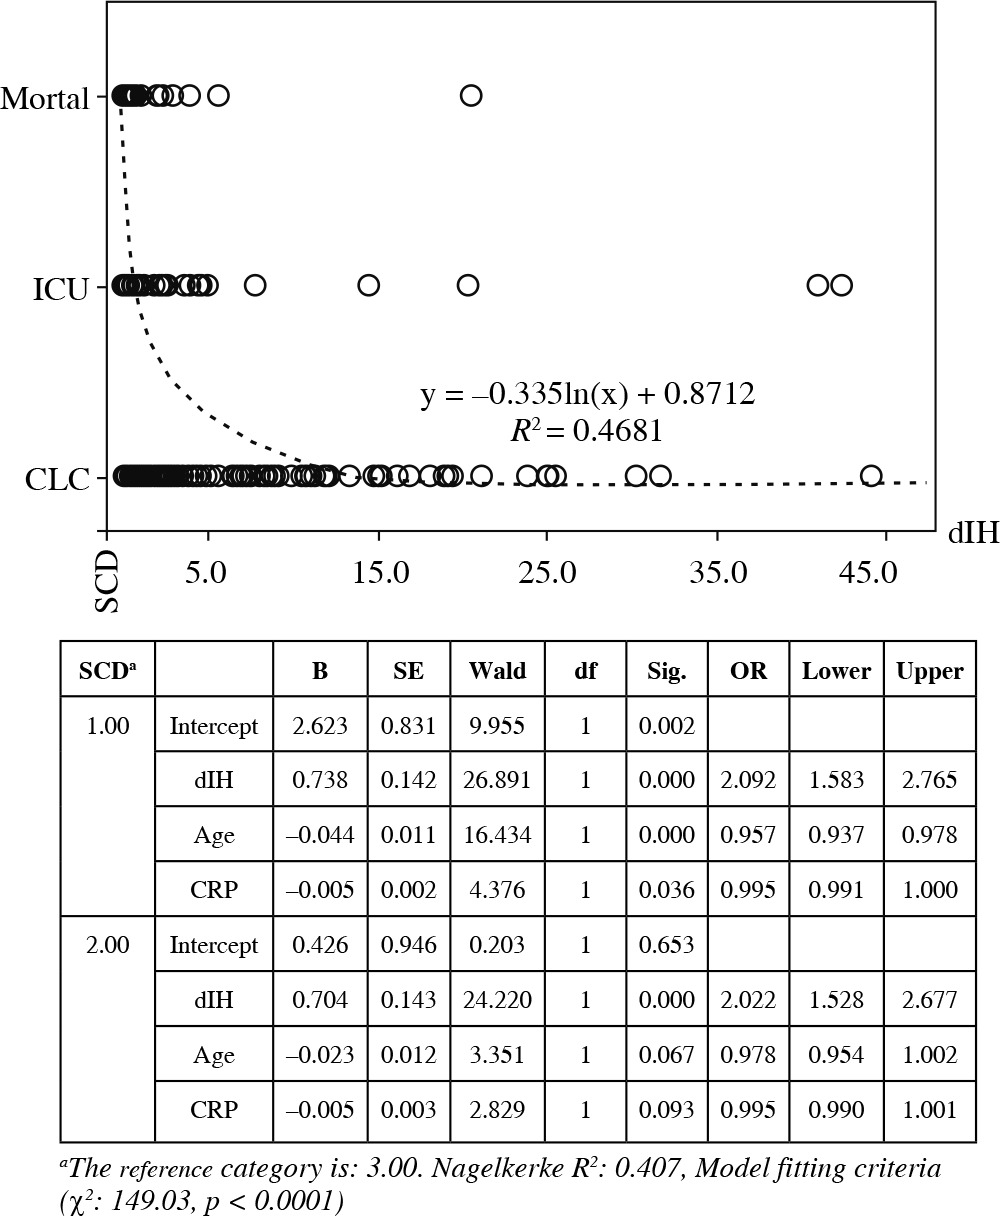
Multinomial logistic regression analysis to test the effect of dIH, age, and CRP
In the multinomial logistic regression analysis performed to determine the effect of independent variables such as dIH, age and CRP on CLC, ICU admission or mortality representing disease severity (Fig. 2), dIH was found to have a stronger effect in progression from CLC or ICU admission to mortality compared to age and CRP. The odds ratio (OD) for dIH was 2.092 for CLC status and 2.022 for ICU admission. In other words, 1 unit increase in dIH value increased the transition to the mortality group from the CLC group by 2.092 times.
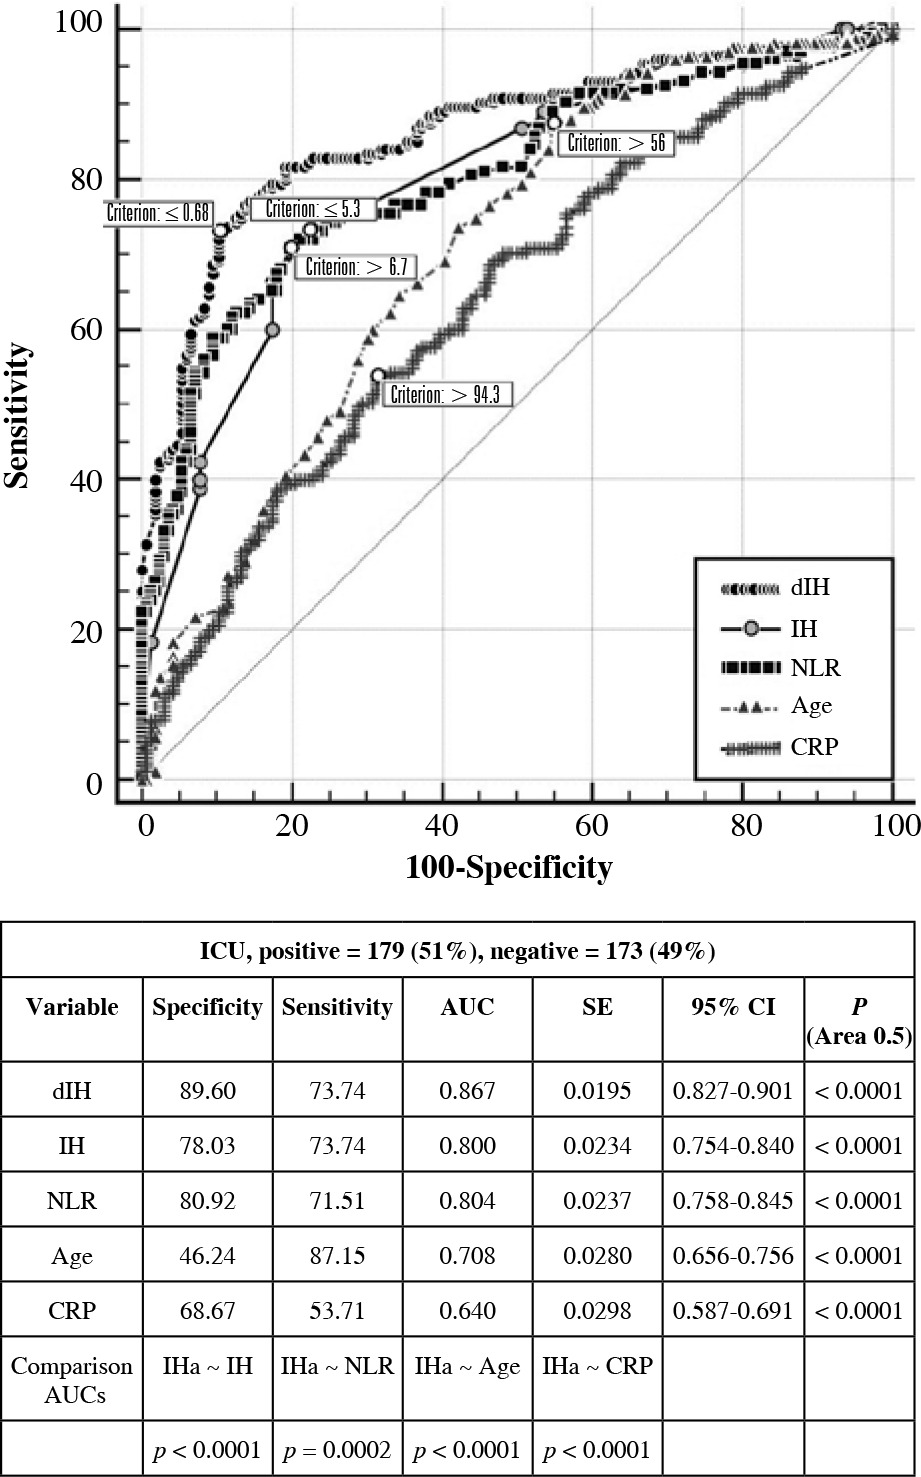
Comparison of ROC curves of important markers for determining ICU admission and mortality
In the comparison of ROC curves comparing the diagnostic power of IH, dIH, NLR, age, and CRP to differentiate between clinical or ICU admission, the cutoff for IH titers was ≤ 5.3, which had sensitivity 73.7%, specificity 78.0%, and area under the curve (AUC) 0.800 (Fig. 3). The cutoff for dIH values was ≤ 0.68 with sensitivity 73.7%, specificity 89.6%, and AUC 0.867. The cutoffs for NLR, age, and CRP were > 6.7, > 56, and > 94.3, with sensitivity 71.5%, 87.1%, and 53.7%, specificity 80.9%, 46.2%, and 68.7%, and AUC 0.804, 708, and 0.640, respectively. dIH was found to have the best diagnostic power for ICU admission.
Fig. 3
Comparison of receiver operating characteristic (ROC) analysis results and graph used to compare the diagnostic power of dIH, IH, NLR, age and CRP parameters to determine ICU admission. The highest diagnostic power belongs to the dIH independent variable
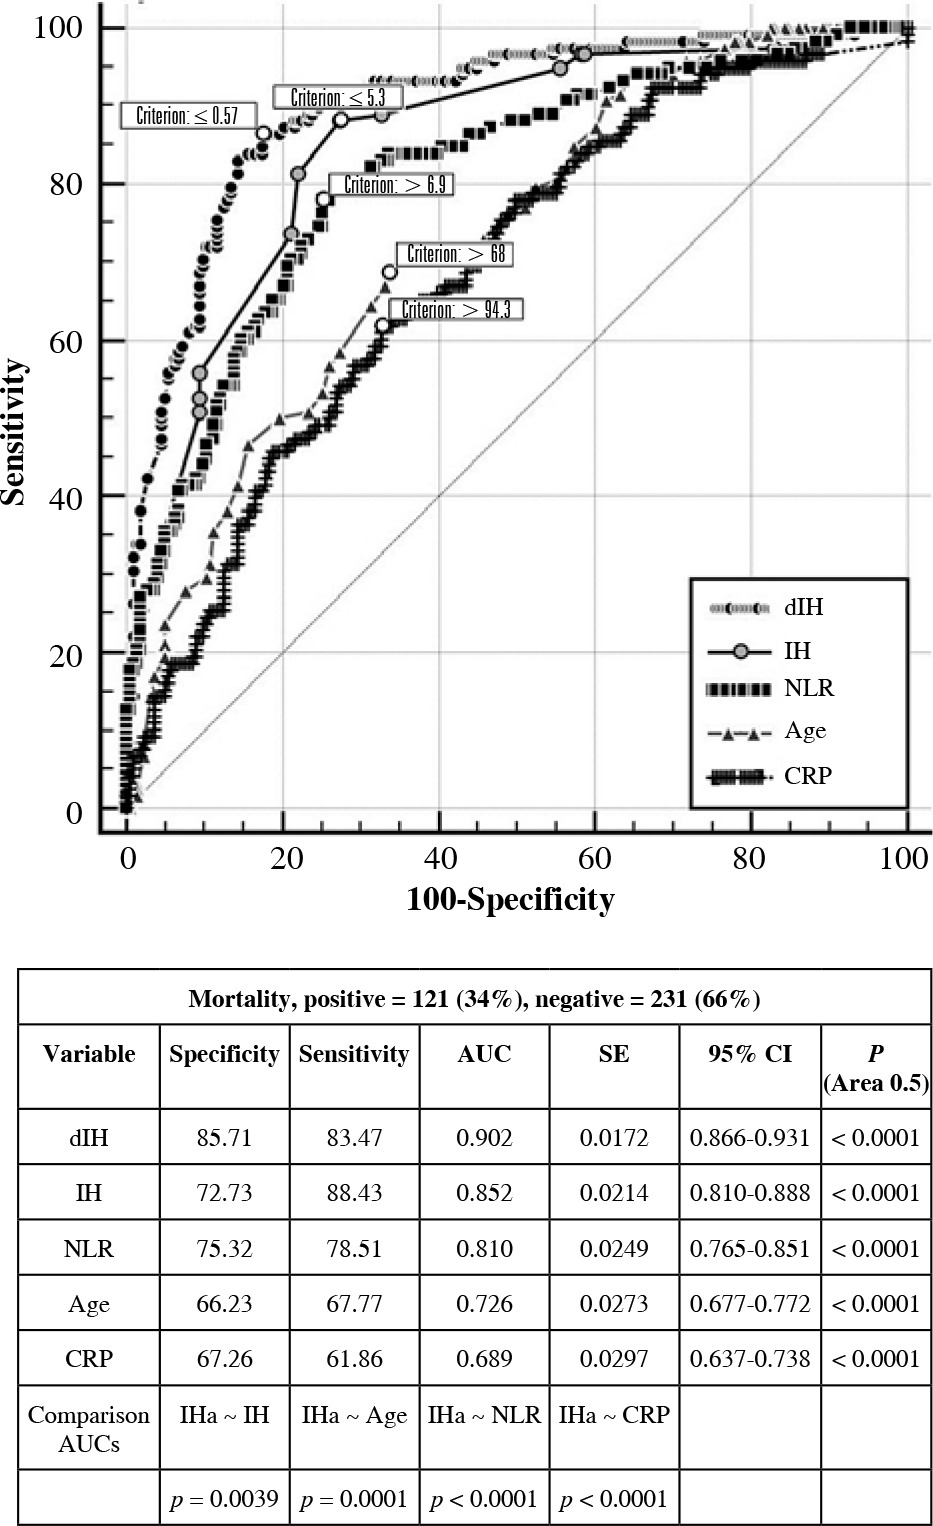
In the analysis comparing the diagnostic power of IH, dIH, NLR, age, and CRP to differentiate the mortality of the disease, the cutoff of ≤ 5.3 for IH had sensitivity 88.4%, specificity 72.7% and AUC 0.852. The cutoff for dIH was ≤ 0.57 with sensitivity 83.5%, specificity 85.7% and AUC 0.902. The cutoff was > 6.9 for NLR with sensitivity 78.5%, specificity 75.3% and AUC 0.810. The cutoff for age was > 68 with sensitivity 67.8%, specificity 66.2% and AUC 0.726, and finally the cutoff for CRP was > 94.3 with sensitivity 61.9%, specificity 66.3%, and AUC 0.689 (Fig. 4). dIH was found to have the best diagnostic power for the prediction of mortality.
Discussion
COVID-19, which has left millions dead due to its rapid contagion, has been a crisis for the whole world. Although the disease is mild at a high rate, it causes serious pulmonary infection in approximately 20% of patients. The need for respiratory support and intensive care in 5-10% of those who show signs of pulmonary infection makes it difficult for the health system to fight against the disease because mortality rates are related to the availability of respiratory support and intensive care services [13].
Among COVID-19 patients with pneumonia, those who developed shortness of breath, with tachypnea (respiratory rate > 28/min), with decreased blood oxygen saturation (< 93%), with decreased PaO2/FiO2 ratio (< 300), and with radiologically extensive lung infiltration (> 50%) are considered severe cases [13]. Similarly, the “Sepsis-related Organ Failure Assessment” (SOFA), which evaluates the respiratory (PaO2/FiO2 ratio), cardiovascular system (hypotension), central nervous system (Glasgow Coma Score), renal system (blood creatinine level and urine output), coagulation status (platelet count) and liver (bilirubin level), is used as an indicator of the severity of the disease for those with COVID-19 pneumonia to determine the possible mortality risk of patients admitted to the ICU [14]. There are also different scoring systems used to predict disease severity and mortality in COVID-19 patients. Examples include CURB-65, consisting of five parameters (confusion, blood urea level, respiratory rate, blood pressure and age) [15], the Pneumonia Severity Index (PSI), APACHE-II [16] and physician’s gestalt [17]. It was reported that most scoring systems have similar predictive power and high scores are bad predictors of prognosis [16, 18]. However, all of them evaluate the current state of the disease and are insufficient in predicting the course of the disease before it becomes severe.
The basic pathology in severe progression of COVID-19 is attributed to the excessive production of proinflammatory cytokines, causing uncontrolled hyper- activation of cytotoxic lymphocytes and macrophages linked to tissue damage caused by viruses. Macrophage activation syndrome (MAS), in which cytokines rise rapidly and tissue damage is accelerated due to this overactivation of the immune system, is called the cytokine storm [19, 20]. Severe cases have the potential to progress to ARDS requiring intensive care. Severe pneumonia, septic shock, and multiple organ failure are the most important findings that determine the need for ICU [13, 21]. However, there is a need for new parameters that can determine the need for ICU in the early period. In the study we conducted for this purpose, COVID-19 patients were divided into groups according to clinical severity. All data of the patients were compared according to these groups. Among these data, age, lymphocyte count, NLR, dNLR, CRP, D-dimer, IH and dIH were remarkable. Among these, IH and dIH derived from IH, a naturally synthesized biomarker that is a product of B-cell function [22] and represents an approximately 1-month period in the immune system [23], were the most appropriate parameters for predicting disease progression. Moreover, the fact that Liu et al. [8] found a relationship between the severity of the disease and the levels of proinflammatory cytokines and immune cell subgroups (lymphocytes) confirms this idea. Again, the finding reported by Guillon et al. [10] that IHs inhibit the interaction between SARS-CoV S protein and ACE2R supports our results.
The immune system plays the main role in the pathogenesis of MAS seen in patients with severe COVID-19. Among the main criteria used in the diagnosis of MAS are parameters related to the immune system. That is, clinical findings include immunosuppression, resistant high fever, and hepatosplenomegaly, while laboratory findings include cytopenia (lymphopenia or thrombocytopenia), elevated triglyceride, ferritin and AST levels, hypofibrinogenemia, and hemophagocytosis in the cytological examination of bone marrow [24]. In addition, high interleukin (IL)-6, CRP and D-dimer levels and prolonged prothrombin time are important laboratory findings [25-27]. Therefore, new candidate markers with the potential to be used in estimating the severity of COVID-19 disease are expected to be directly or indirectly related to the immune system. In the study we conducted in this context, dIH had high sensitivity and specificity in estimating ICU admission or mortality. This is likely because dIH contains a polysaccharide antibody, which is indicative of the humoral activity of the innate immune system, and NLR, which is part of the cellular system. Therefore, dIH showed higher diagnostic accuracy compared to IH, NLR, age, and CRP. The results of the multinomial regression analysis showed that dIH, which was able to distinguish CLC, ICU, and mortality group from each other with a higher effect size, was more reliable in estimating the severity of COVID-19 (compared to CRP and age). In studies about the use of IHs for diagnosis, it was reported that they can be used to check immunological function in patients with various immunodeficiencies (such as X-linked agammaglobulinemia and severe combined immunodeficiency) [28, 29]. This is because natural antibodies, which are produced continuously by B lymphocytes, mainly B1, form the first defense of the organism, unlike adaptive antibodies, and provide non-specific protection. They are polyreactive regardless of the antigenic stimulus. As the amount of B1 cells decreases with age, the level of natural antibodies may also decrease. This situation is associated with an increased risk of diseases related to old age [29]. In addition, these antibodies support the immune system and homeostasis, prevent infections and inflammation, and participate in many physiological processes that limit autoimmune and cardiovascular diseases and carcinogenesis. Due to all these features, we believe that IHs, a type of natural antibody, may play an important role in the prediction of age-related increasing severity of COVID-19.
Special ICU practices such as timely mechanical ventilation, fluid resuscitation, hemodynamic support and early antibiotic therapy reduce the morbidity and mortality among COVID-19 patients. For this reason, there is a need for evidence-based protocols that can triage accurately and quickly in the clinical decision process. However, this is possible with the use of appropriate parameters [30, 31]. For example, it may be possible to suppress cytokine release, which causes severe respiratory failure observed in patients with severe COVID-19, with tocilizumab, which blocks the binding of the IL-6 receptor to IL-6. So, there is a need for reliable triage systems that can make the right ICU decisions. The monitoring of IL-6 and CRP levels, which are a function of immune system cells, especially macrophages, is important to meet this need [32, 33]. Therefore, the level of natural antibodies, which is a function of the innate immune system, should also be investigated for the potential to provide information about the immune structure that is resistant to SARS-CoV-2. Most patients with severe COVID-19 are elderly, chronically ill, and immunocompromised. In general, advanced age and chronic diseases are associated with a weakened or inappropriate immune response. This finding indicates that this population will need more ICU and polytherapy approaches to support the immune system [such as complex vitamins, oxygen supplementation, intravenous immunoglobulin (IVIg) and interferon] during epidemics [34-36]. However, in our study, the mortality rate was high in the elderly population despite being admitted to the ICU and receiving treatment that supports the immune system. The probable cause of this may be related to the timing of treatment. For this reason, it is vital to find new markers that provide an early understanding of the progression of COVID-19 disease and whose primary focus is the immune system.
In this study, the age, chronic disease, leukocyte count, neutrophil count, NLR, urea, creatinine, albumin, CRP, procalcitonin, PT, D-dimer, AST, GGT, LDH and ESR values were higher for patients who were admitted to the ICU due to the severity of the disease and died. Conversely, IH, dIH, lymphocyte count, platelet count, erythrocyte count, hemoglobin and hematocrit values were lower. All this is proof of why the disease was severe. In addition, the differences between the IH, dIH and NLR results of the mortality group and other patient groups were quite significant. The relationship between the clinical status, outcomes, and severity of SARS-CoV pneumonia in a recent meta-analysis by Li et al. [37] is similar to our results. In conclusion, all the above clinical, hematological, and biochemical findings are important in determining the course of the disease. However, NLR, IH and dIH are considered to be the most appropriate parameters for the estimation of disease severity. Among these, dIH, which is an indicator of innate immunity, gave higher accuracy because it includes both IH and NLR. In addition, easy access to IH and NLR tests is another advantage of this test.
Our results show that dIH value can be used with other protocols to provide correct triage according to the severity of the disease for COVID-19. However, there is a need for more extensive studies about its use alone. We also recommend trying different combinations to achieve higher accuracy.
In conclusion, dIH values calculated in the early stages of the disease in patients with COVID-19 can be used to understand the clinical progression associated with ICU admission and mortality.