Introduction
The massive – in terms of financial and human resources – effort to fight against lethal COVID-19 is twofold: introducing to the market a vaccine to prevent new infections and/or effective drugs to cure those already infected. In this paper, we claim that citizens will not follow guidelines and recommendations, making it impossible to achieve both goals, and thus eventually fully eradicate COVID-19. We hypothesized that that citizens would not follow regulations due to the unrealistic optimism, which is a cognitive bias where we are supposed to be less exposed to danger events in comparison to others [1–4].
We are unrealistically optimistic about the future; negative events, such as a car crash, divorce, addiction, and more importantly, health issues, will not happen to us but to our peers, and only positive events will happen to us [1–4]. Unrealistic optimism reduces fear and anxiety [5, 6], retains a sense of personal control [2, 7], and helps to cope with threatening experiences [8, 9].
As mentioned above, unrealistic optimism affects people’s health-related decisions, and from this perspective, unrealistic optimism is not always beneficial. For example, smokers, holding this view, were unrealistically optimistic about lung cancer, and as a result did not quit smoking [10]; women were less likely to undergo mammographic screening [11]; students who were unrealistically optimistic about the risk of experiencing alcohol-related problems did in fact experience them more often [12]. Based on the above findings, unrealistic optimism simply harms one’s health.
One should note, however, that unrealistic optimism is one side of the coin, which can show its second side as we flip it: unrealistic pessimism [13] pertains to the fact that people holding this view present precisely the opposite view: they estimate chances of adverse events happening to them as more probable in comparison to peers. From this point of view, unrealistic pessimism saves lives. Since people expect harmful consequences to happen to them, they are motivated to present all possible behaviors preventing health/life-threatening events. An extreme example of such pro-health behaviors stemming from unrealistic pessimism was reported in a study conducted in 1986 [13] when the nuclear plant in Chernobyl affected the health of Europeans. It was discovered that unrealistic pessimism forced citizens to present behaviors preventing their own ill health: the participants of the study more often drank Lugol’s solution, did not leave home, secured windows, and abstained from milk and vegetables, which were polluted from the radioactive cloud, becoming poisonous.
From this perspective, unrealistic optimism/pessimism may be a key factor in COVID-19 eradication. As mentioned above, we are witnessing the governments and leaders all around the world boosting optimism, opening the economy, which may affect unrealistic optimism. Being unrealistically optimistic would make people less eager to follow governments’ recommendations, of staying home, and possibly vaccination hesitant even if the vaccine were available. On the other hand, unrealistic pessimism would be a great predictor for healthy behaviors: people would follow state regulations, and first and foremost, they would vaccinate once vaccines become available on the market. From this vantage point, it is clear that reaching both goals enumerated above as a critical move toward COVID-19 extermination may be supported (unrealistic pessimism), or stopped (unrealistic optimism).
Based on the above, we decided to determine whether citizens across 3 very different countries hold an unrealistically optimistic view about their chances of being infected with COVID-19 (study 1). Second, we also aimed to determine whether professional medical experience of healthcare professionals reduces unrealistic optimism present among non-medical participants (study 2).
Material and methods
Study 1
The goal of the first study research was to assess people’s views about their chances of being infected. To study the globality of the effect, we planned comparisons between 3 different countries: Poland – which is a Central and Eastern European country; Kazakhstan – a representative of the Eastern European and Asian post-Soviet countries; and Iran – a Middle Eastern country.
Importantly, Iran was hit earlier by the COVID-19 pandemic, and much harder than Kazakhstan and Poland. Also, religion in these countries is different: in Iran Islam, in Poland Christianity, and in Kazakhstan, because of the heterogeneous population, there is a wide diversity of religions (Islam, Christianity, Buddhism, Jewish). Additionally, since the Kazakh nation is very heterogeneous (stemming from many different nationalities and religions), Iran and Poland are very homogeneous. Finally, those countries are different in terms of the style of the government, economy, history, and geographical location. Taken altogether, the search of globality of supposed effects was the main focus while choosing research samples.
Secondly, we planned 2 separate measurements to enhance the internal validity of the study and assess possible changes in time. This is especially important due to the fact that obtained results and differences may be due to some other uncontrollable mechanisms standing behind the effects. For example, if the economy were in a better shape, the participants might feel optimism, joy, and happiness, which could lead to, for example, heightened self-esteem, and consequently, it would lead to unrealistic optimism. Performing the survey twice (in every country) limits this possibility.
Survey
The first online survey was administered in (by Ali Derakhshan, Aidana Rizulla, and Paweł Muniak) 2 waves in every country: Poland (1st wave: 17th April 2020 to 19th April 2020, 2nd wave: 5th May 2020 to 14th May 2020), Kazakhstan (1st wave: 11th April 2020 to 15th April 2020, 2nd wave: 24th April 2020 to 29th April 2020), and Iran (1st wave: 23th April 2020 to 2nd May 2020, 2nd wave: 9th May 2020 to 17th May 2020). The link to the electronic online survey was distributed via emails, social media channels such as WhatsApp, Telegram, etc., which were shared by professors to the students in each country.
Importantly, in each country, the first wave was conducted at the early stage of the pandemic, and the second wave during loosening of the first restrictions, as well when the severity of the pandemic (for the specific country, and globally) was already known to citizens. The full knowledge about the impact of COVID-19 on people might make people very pessimistic, or at least realistic.
The survey was based on 2 questions assessing unrealistic pessimism/optimism: What is the probability for you of being infected with coronavirus (COVID-19)?, and What is the probability for an average student from your university of being infected with coronavirus (COVID-19)? Answers could range from 1 (absolutely impossible) to 11 (quite certain). The survey was anonymous; participants coded their identity with a personal code, making it impossible to reveal their identity. An example of such a survey presented in each country is available in the Appendix. Participants were also asked to provide an anonymous code making comparisons between waves and among the same participants possible. Since not every participant provided such a code, and because of the drop-out of the participants, below are presented results for both “matched” (the same participants between waves) and “unmatched” data (analysis for the whole sample, not for specific codes).
We were able to match the results between waves due to the personal code that participants provided during the first and the second wave. Participants coded their results by providing the initials of the first name and the family name as well as the last 2 numbers from the year of birth (for example, for one of the co-authors, it would be WK78). No single code record was repeated twice by 2 different participants.
The second survey was conducted on 04/30/2020 to 05/04/2020. The survey was based on exactly the same 2 questions assessing unrealistic pessimism/optimism: How likely is it that you will become infected with coronavirus (COVID-19)?, and How likely is it that your average co-worker will become infected with coronavirus (COVID-19)?. Answers could range from 1 (absolutely impossible) to 10 (quite certain). The survey was administered electronically by personal invitation by the head of the hospital.
Participants
Data for the whole sample
In the whole sample (without tracking specific respondents by anonymous code), in the first wave, 1611 respondents (1228 females, 383 males, Mage = 23.18, SDage = 7.08, ranging from 18 to 69) took part in the study.
In the whole sample (again, without tracking specific respondents by anonymous code), in the second wave, 1426 respondents (938 females, 488 males, Mage = 24.47, SDage = 8.24, ranging from 18 to 60) took part in the study.
In the whole sample with tracking specific respondents by anonymous code, 375 participants (295 females, 80 males, Mage = 24.64, SDage = 7.94, ranging from 18 to 71) took part in the study.
Data for each country separately
In Poland, in the first wave, 587 participants (494 female, 93 males, Mage = 25.63, SDage = 7.91, ranging from 18 to 65) took part in the study. In the second wave, 649 participants (555 female, 94 males, Mage = 22.07, SDage = 7.16, ranging from 18 to 45), took part in the study. There were exactly the same 205 participants (175 females, 30 males, Mage = 26.84, SDage = 7.78, ranging from 18 to 55) that took part in both waves.
In Kazakhstan, in the first wave, 595 participants (426 females, 169 males, Mage = 21.74, SDage = 6.13, ranging from 18 to 69) took part in the study. In the second wave 388 participants took part in the study (270 females, 118 males, Mage = 27.03, SDage = 5.73, ranging from 21 to 40), and there were exactly the same 68 participants (49 females, 19 males, Mage = 21.01, SDage = 6.39, ranging from 18 to 60) taking part in both waves.
In Iran, in the first wave 429 participants (308 females, 121 males, Mage = 21.8, SDage = 6.15, ranging from 18 to 71) took part in the study. In the second wave, 389 participants took part in the study (276 females, 113 males, Mage = 26.04, SDage = 10.65, ranging from 18 to 60), and there were exactly the same 102 participants (71 females, 31 males, Mage = 22.62, SDage = 7.84, ranging from 18 to 71) taking part in both waves.
Excluded data
Seventeen participants (10 females, 7 males, Mage = 30.06, SDage = 11.1, ranging from 18 to 52; 4 from Poland, 5 from Kazakhstan, and 8 from Iran) were excluded from the analyses due to lack of answers for at least one question about unrealistic optimism, which we treated as a proxy of lack of attention, internet bot activity, etc.
Study 2
The goal of the second study was to replicate previous findings among healthcare professionals. It was conducted in one of the biggest hospitals in Poland – the Polish Mother’s Memorial Hospital Research Institute (PMMHRI) in Lodz – the highest tertiary referral hospital with almost 1000 beds, up to 50,000 hospitalizations, and about 120,000 ambulatory clinic visits per year.
Participants
Two-hundred and 7 participants (163 females, 44 males, Mage = 44.43, SDage = 10.74, ranging from 23 to 80), took part in the study representing 3 specialties as frontline workers: physicians (n = 87, 66 females, 21 males), nurses (n = 111, 91 females, 18 men), paramedics (n = 9, 6 females, 3 males). Since the paramedic group was too small to perform the analysis, we discarded reporting any differences within this group.
Both studies received ethical approval from the Ethical Committee of SWPS University of Social Sciences and Humanities (03/P/04/2020; date of the decision: 04/09/2020).
Statistical analysis
Inferential statistical methods, including ANOVA, post-hoc, dependent samples t-test, and independent samples t-test, were used.
To determine whether nationality influences the risk assessment for oneself and another university student, univariate repeated measures ANOVA experimental design was used: 3 (nationality: (1) Poland, (2) Iranian, (3) Kazakh) × 2 (unrealistic optimism: (1) What is the probability for you to be infected with coronavirus (COVID-19)? (2) What is the probability for an average student from your university to be infected with coronavirus (COVID-19)?).
Results
Study 1
Analysis without matching participants’ results
First wave
To determine whether nationality influences the risk assessment for oneself and another university student, univariate repeated measures ANOVA experimental design was employed: 3 (nationality: (1) Poland, (2) Iranian, (3) Kazakh) × 2 (unrealistic optimism). The analysis delivered the following effects: the main effect of nationality: F(2, 1608) = 152.12; p < 0.001; ηp² = 0.16; the main effect of unrealistic optimism: F(1, 1608) = 419.2; p < 0.001; ηp² = 0.21; and the interaction effect of nationality and unrealistic optimism: F(2, 1608) = 41.53; p < 0.001; ηp² = 0.05
To compare the differences between the measurements of unrealistic optimism (without division into nationality) a post hoc analysis was performed. The analysis showed statistically significant differences (pbonf < 0.001). Respondents significantly higher assessed the probability of falling ill for a university colleague (M = 5.69; SD = 2.57) than themselves (M = 4.45; SD = 2.59).
Again, post hoc analysis was implemented to determine whether there were any significant differences in the overall risk assessment of infection between nationalities (main effect of nationality). The analysis showed statistically significant differences. It turned out that in Kazakhstan (M = 3.9), the respondents estimated this risk as significantly lower than in Iran (M = 5.86) or Poland (M = 5.68) (pbonf < 0.001). No difference was observed between Poland and Iran (pbonf = 0.493).
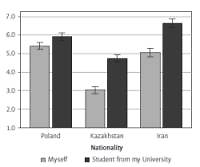
Also, a significant interaction effect was found: depending on the nationality, the respondents assessed the risk of infection differently for themselves and another student from their university. To assess the complexity of the results, an analysis of the simple main effects of 2 measurements of unrealistic optimism by nationality was conducted. It turned out that this effect occurred for all nationalities. Thus, among Poles, the estimation of own risk of falling ill was smaller (M = 5.42; SD = 2.42) than the estimate of the chance of another student from the university getting ill (M = 5.93; SD = 2.23) (pbonf < 0.001). The situation was similar in Iran. The estimation of the risk of own illness was smaller (M = 5.06; SD = 2.59) than the estimate of the chance of another student from the university getting ill (M = 6.66; SD = 2.49) (pbonf < 0.001). There was no exception in Kazakhstan. The estimation of own risk of falling ill was smaller (M = 3.04; SD = 2.27) than the estimate of the chance of another student from the university getting ill (M = 4.76; SD = 2.64) (pbonf < 0.001). Detailed results are shown in Figure 1.
Second wave
For the second wave, the analysis of the same experimental scheme was performed. The ANOVA (3 × 2) was applied: the main effect of nationality: F(2, 1423) = 61.83; p < 0.001; ηp² = 0.08; the main effect of unrealistic optimism: F(1, 1423) = 359.61; p < 0.001; ηp² = 0.2, as well as the interaction effect of nationality and unrealistic optimism: F(2, 1423) = 43.72; p < 0.001; ηp² = 0.06.
To compare the differences between the measurements of unrealistic optimism (without division into nationality), a post hoc analysis was performed. The analysis showed statistically significant differences (pbonf < 0.001). Respondents significantly assessed the probability of falling ill for a university colleague higher (M = 5.5; SD = 2.46) than themselves (M = 4.31; SD = 2.42).
In the next step, post hoc analysis was implemented to determine whether there were any significant differences in the overall risk assessment of infection between nationalities (main effect of nationality). It turned out that in considering the second wave (without matching), all compared countries statistically differed from each other (pbonf < 0.001): Poland (M = 5.45), Iran (M = 4.85), Kazakhstan (M = 4.05).
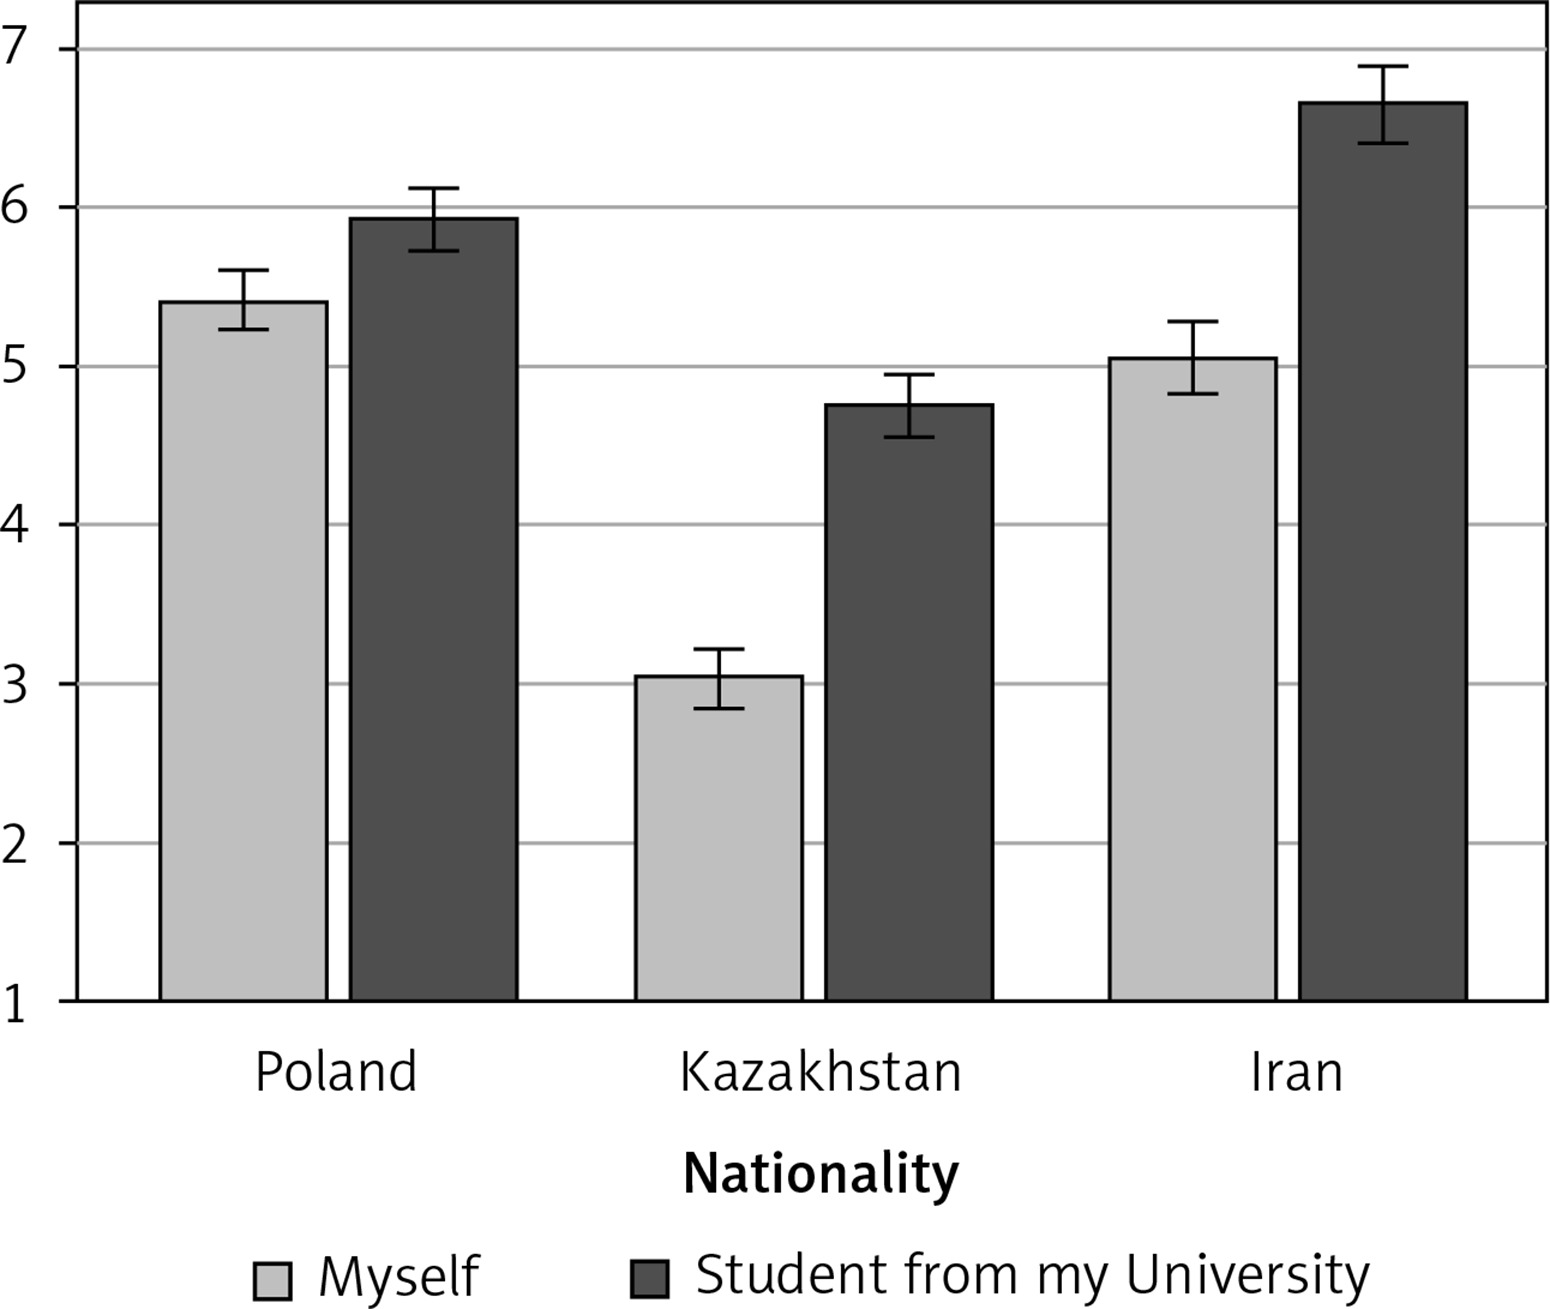
To assess the interaction effect, an analysis of the simple main effects of 2 measurements of unrealistic optimism by nationality was performed. It turned out that this effect again occurred for all nationalities. In the Polish sample, the estimation of own risk of falling ill was smaller (M = 5.19; SD = 2.55) than the estimate of the chance of another student from the university getting ill (M = 5.71; SD = 2.54) (pbonf < 0.001). In the Iranian sample, the estimation of the risk of own illness was smaller (M = 3.84; SD = 2.23) than the estimate of the chance of another student from the university getting ill (M = 5.86; SD = 2.38) (pbonf < 0.001). Again, there was no exception in the Kazakh sample. The estimation of own risk of falling ill was smaller (M = 3.84; SD = 2.23) than the estimate of the chance of another student from the university getting ill (M = 4.79; SD = 2.26) (pbonf < 0.001). Detailed results are shown in Figure 2.
Analysis with tracking of specific students by code
First wave
This time we performed the analysis including only those students who took part in both phases of the study. Again, ANOVA (3 × 2) was applied.
We obtained the following effects: the main effect of nationality: F(2, 372) = 14.17; p < 0.001; ηp² = 0.07; the main effect of unrealistic optimism: F(1, 372) = 167.195; p < 0.001; ηp² = 0.31; and the interaction effect of nationality and unrealistic optimism: F(2, 372) = 22.87; p < 0.001; ηp² = 0.11.
The differences between the measurements of unrealistic optimism (post hoc) were statistically significant (pbonf < 0.001). Students significantly assessed the probability of falling ill for a university colleague higher (M = 5.9; SD = 2.31) than themselves (M = 4.82; SD = 2.35).
The analysis evaluating whether the overall risk assessment of infection between nationalities (main effect of nationality) differs showed statistically significant differences. In Kazakhstan (M = 4.17), the respondents estimated this risk as significantly lower than in Iran (M = 5.61) or Poland (M = 5.63) (pbonf < 0.001). However, no difference was observed between Poland and Iran (pbonf = 0.1). Participants from these countries assessed the overall risk of infection practically the same.
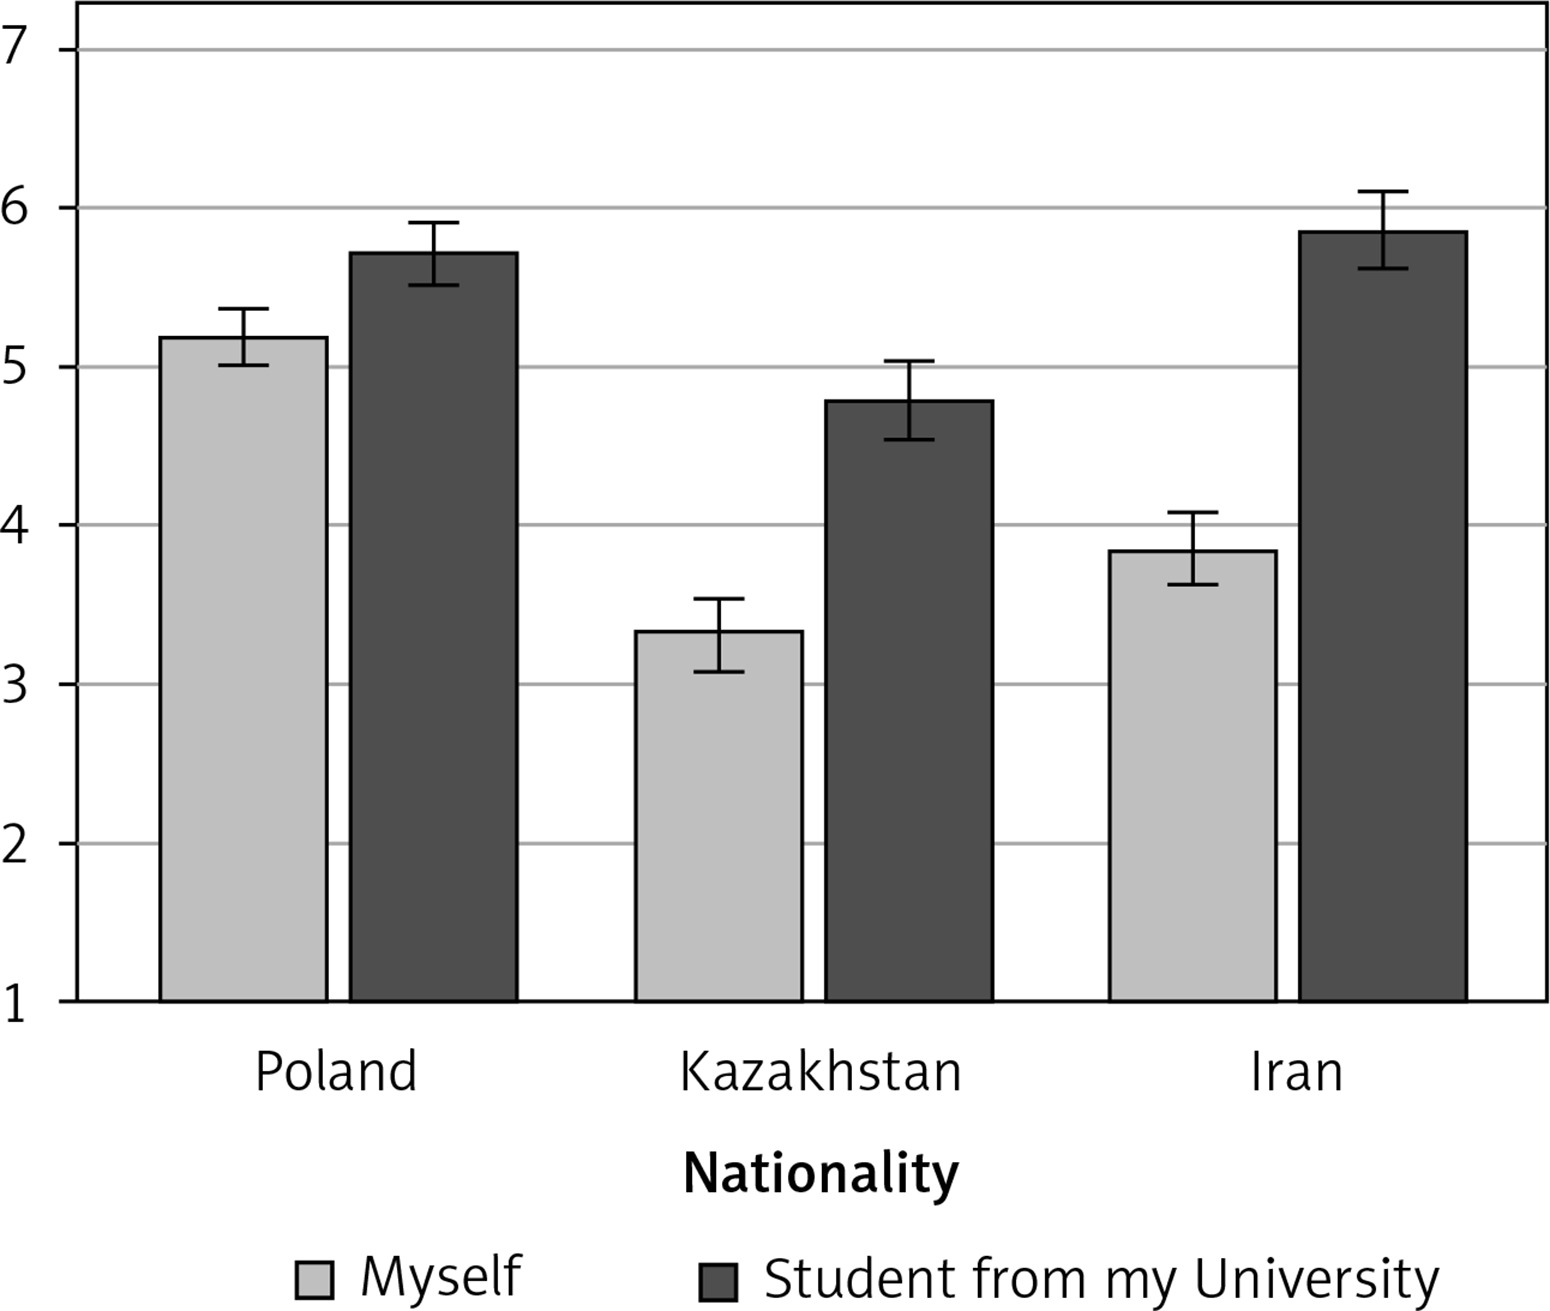
Again, an analysis of the simple main effects of 2 measurements of unrealistic optimism by nationality was carried out. It turned out that this effect again occurred for all nationalities. In the Polish sample, the estimation of own risk of falling ill was smaller (M = 5.37; SD = 2.04) than the estimate of the chance of another student from the university getting ill (M = 5.89; SD = 2.02) (pbonf < 0.001). In the Iranian sample, the estimation of the risk of own illness was smaller (M = 4.86; SD = 2.29) than the estimate of the chance of another student from the university getting ill (M = 6.35; SD = 1.96) (pbonf < 0.001). Again, there was no exception in the Kazakh sample. The estimation of own risk of falling ill was smaller (M = 3.09; SD = 2.51) than the estimate of the chance of another student from the university getting ill (M = 5.25; SD = 3.28) (pbonf < 0.001). Detailed results are shown in Figure 3.
Second wave
Like the first wave, ANOVA (3 × 2) was employed. The following effects were obtained: the main effect of nationality: F(2, 372) = 25.65; p < 0.001; ηp² = 0.12; the main effect of unrealistic optimism: F(1, 372) = 166.84; p < 0.001; ηp² = 0.31; and the interaction effect of nationality and unrealistic optimism: F(2, 372) = 30.36; p < 0.001; ηp² = 0.14.
The differences between the measurements of unrealistic optimism (post hoc) were statistically significant (pbonf < 0.001). Students assessed the probability of falling ill significantly higher for a university colleague (M = 5.63; SD = 2.08) than themselves (M = 4.68; SD = 2.27).
In Kazakhstan (M = 3.73), the respondents estimated this risk as significantly lower than that in Iran (M = 5.68) or Poland (M = 5.36) (pbonf < 0.001). No difference was observed between Poland and Iran (pbonf = 0.471).
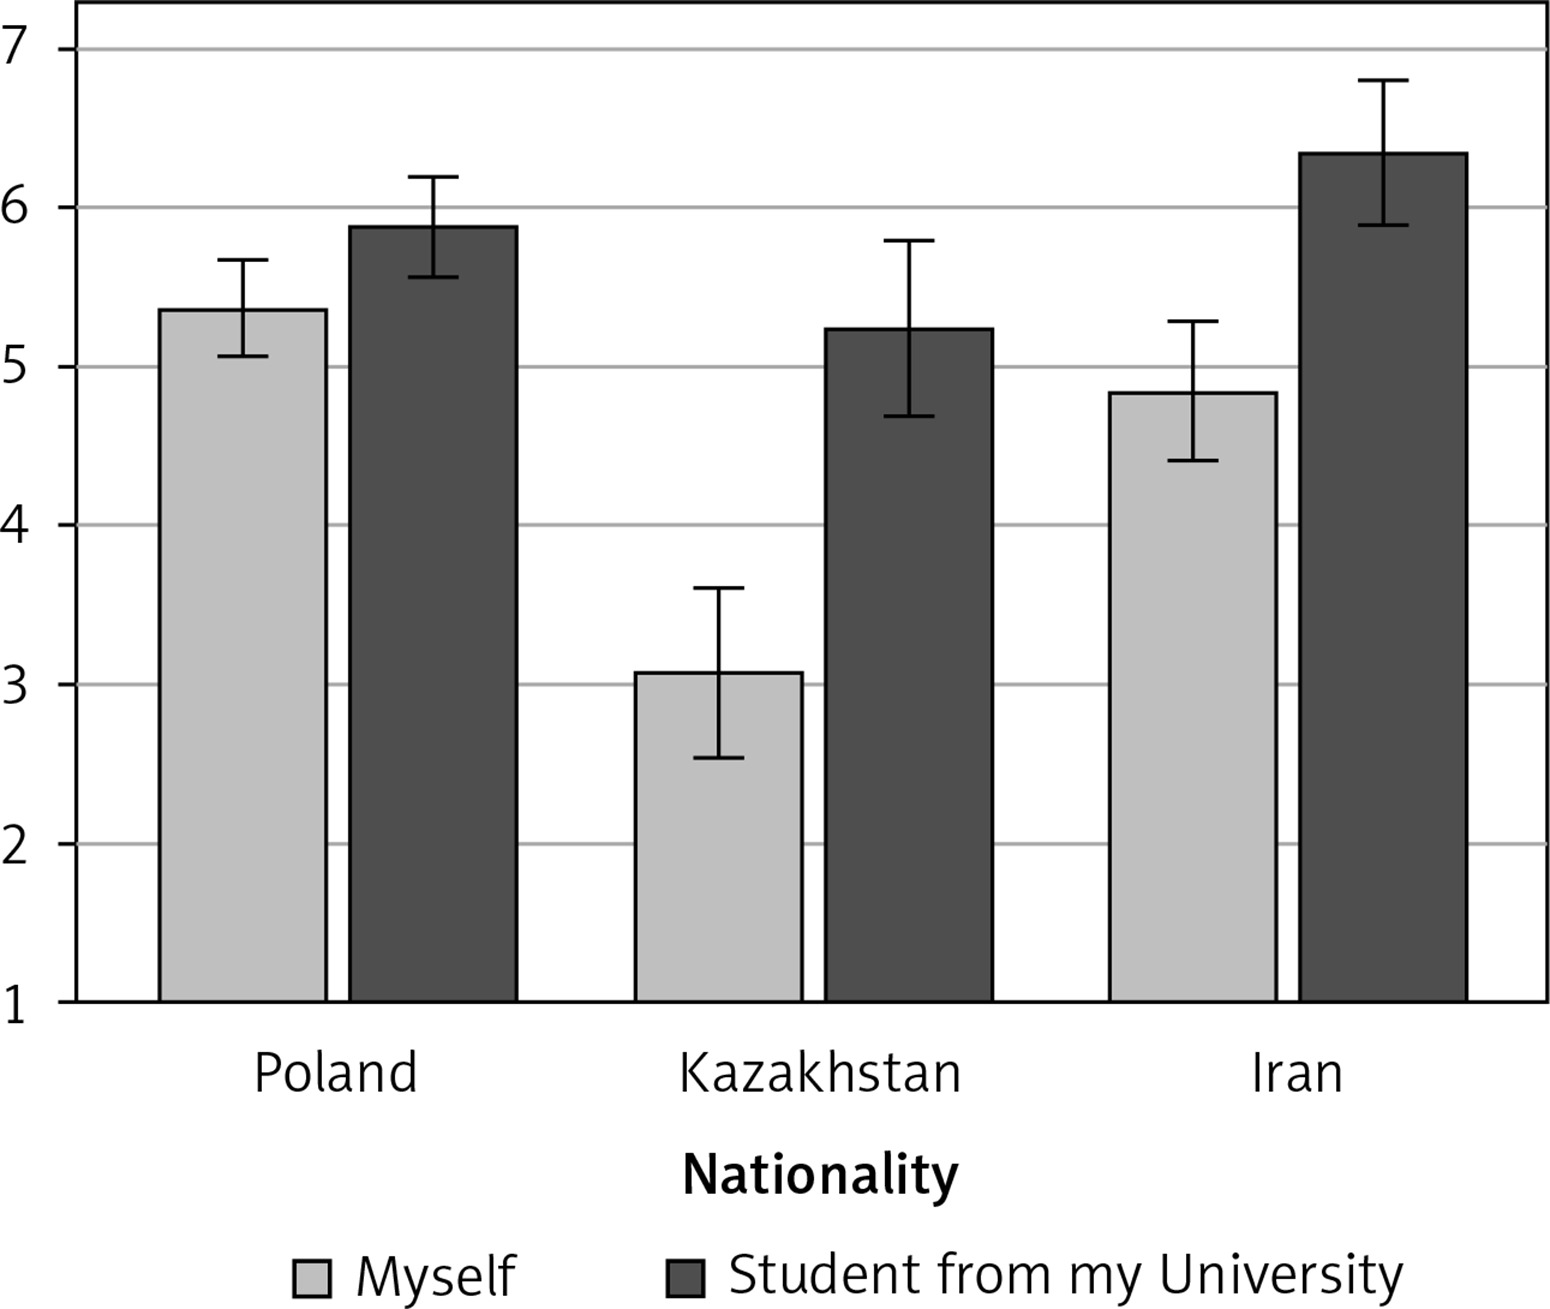
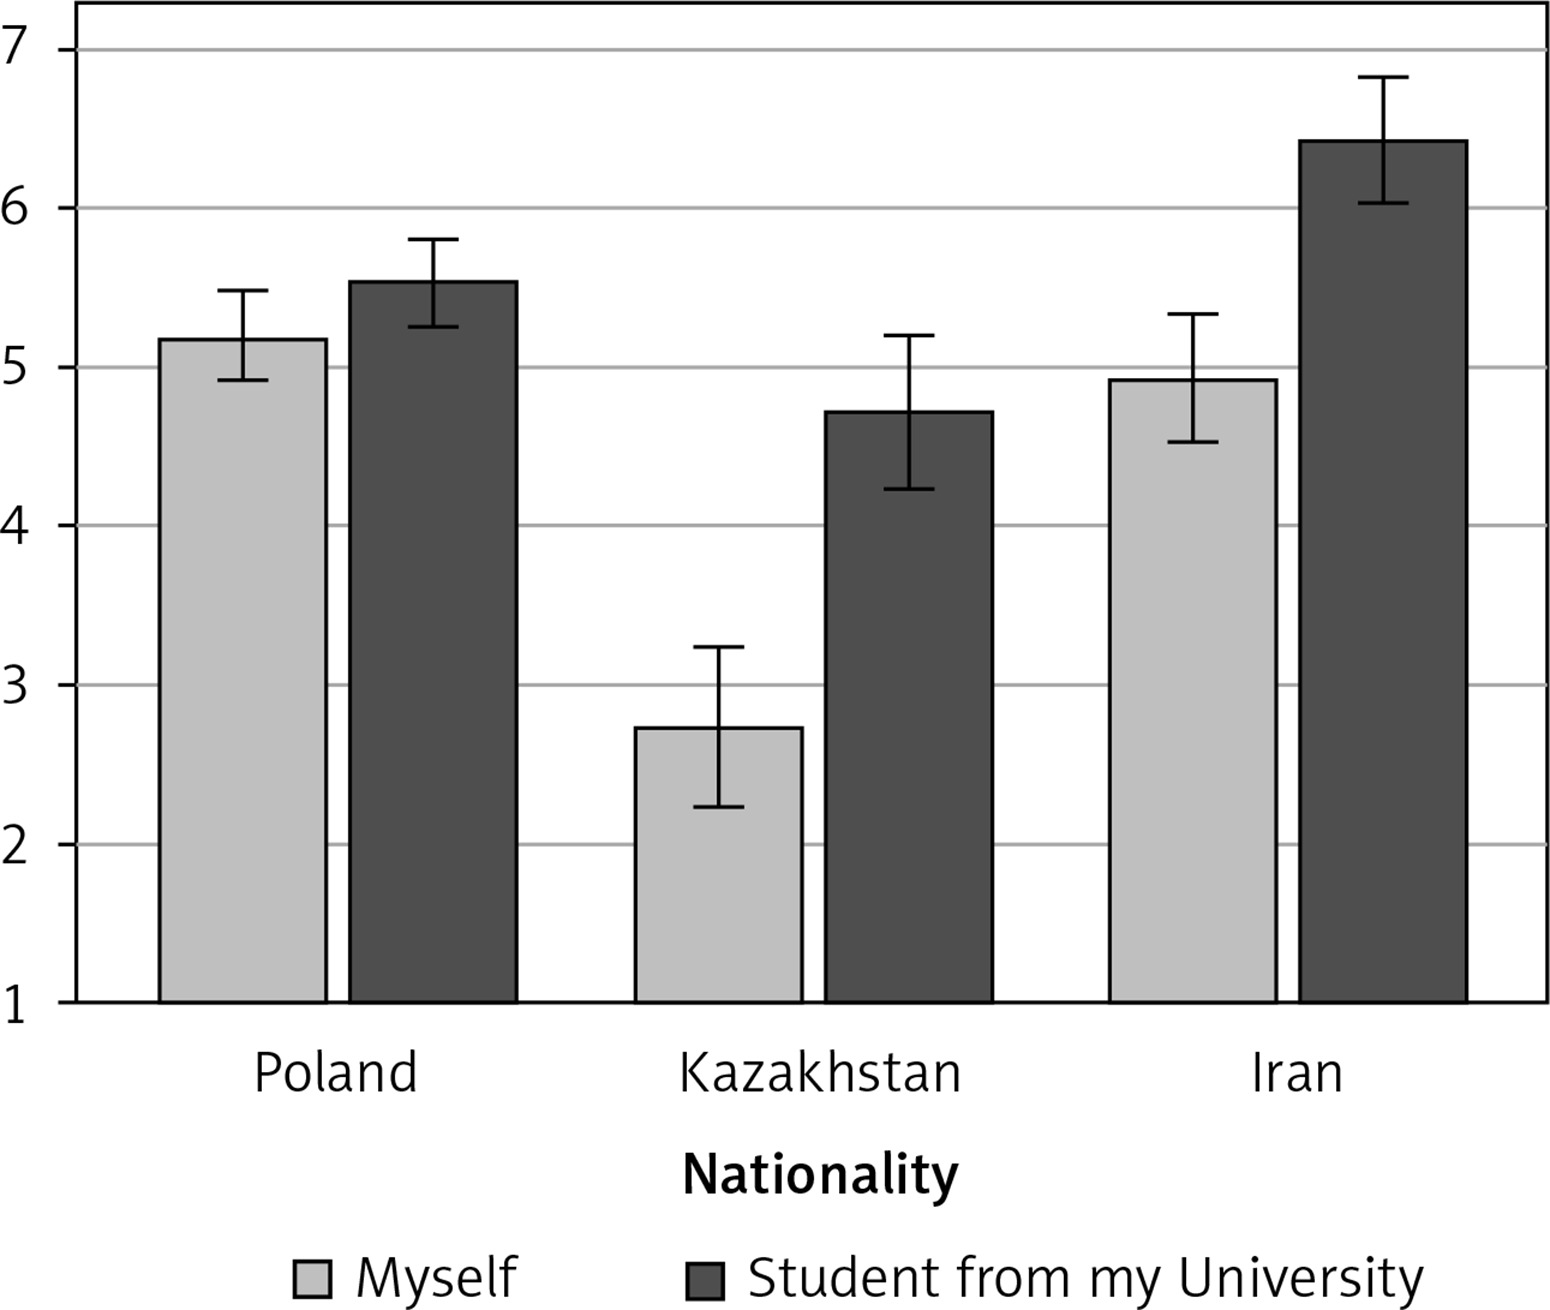
An analysis of the simple main effects of 2 measurements of unrealistic optimism by nationality was conducted. In the Polish sample, the estimation of own risk of falling ill was smaller (M = 5.19; SD = 2.21) than the estimate of the chance of another student from the university getting ill (M = 5.53; SD = 2.03) (pbonf = 0.006). In the Iranian sample, the estimation of the risk of own illness was smaller (M = 4.93; SD = 1.94) than the estimate of the chance of another student from the university getting ill (M = 6.43; SD = 1.76) (pbonf < 0.001). Again, there was no exception in the Kazakh sample. The estimation of own risk of falling ill was smaller (M = 2.73; SD = 1.87) than the estimate of the chance of another student from the university getting ill (M = 4.72; SD = 2.24) (pbonf < 0.001). Detailed results are shown in Figure 4.
Figure 4
Unrealistic optimism (a difference between “myself” and “an average student from my University”) with tracking specific students by code (wave II)
To conclude, study 1 showed that unrealistic optimism is not only global (not restricted to a specific nationality or region), but also time-persistent, meaning that it does not disappear when the severity of the health crisis (locally, nationally, internationally) is more precise, visible, and present. A summary of the results can be found in Table I.
Table I
Summary of results from first study (simple main effects)
| Measurement | Nationality and unrealistic optimism bias | F | P-value | ηp² | |||||||||||||||||||||
|---|---|---|---|---|---|---|---|---|---|---|---|---|---|---|---|---|---|---|---|---|---|---|---|---|---|
| Poland | Iran | Kazakhstan | |||||||||||||||||||||||
| Myself | Student from my university | Myself | Student from my university | Myself | Student from my university | ||||||||||||||||||||
| M | SD | M | SD | M | SD | M | SD | M | SD | M | SD | ||||||||||||||
| Wave I | |||||||||||||||||||||||||
| No match | 5.42a | 2.42 | 5.93a | 2.23 | 5.06b | 2.59 | 6.66b | 2.49 | 3.04c | 2.27 | 4.76c | 2.64 | 41.53 | < 0.001 | 0.05 | ||||||||||
| Match | 5.37a | 2.04 | 5.89a | 2.02 | 4.86b | 2.29 | 6.35b | 1.96 | 3.09c | 2.51 | 5.25c | 3.28 | 22.87 | < 0.001 | 0.11 | ||||||||||
| Wave II | |||||||||||||||||||||||||
| No match | 5.19a | 2.55 | 5.71a | 2.54 | 3.84b | 2.23 | 5.86b | 2.38 | 3.84c | 2.23 | 4.79c | 2.26 | 43.72 | < 0.001 | 0.06 | ||||||||||
| Match | 5.19a | 2.21 | 5.53a | 2.03 | 4.93b | 1.94 | 6.43b | 1.76 | 2.73c | 1.87 | 4.72c | 2.24 | 30.36 | < 0.001 | 0.14 | ||||||||||
There is, however, at least one caveat for this study. It is possible that unrealistic optimism is not changeable; thus, global leaders should not address this issue. To address this issue, we replicated the aforementioned study in one of the previous countries (Poland) among the frontline healthcare workers. Having the same result (unrealistic optimism) would mean that this effect is global, and expert knowledge held by this specific group does not make people at least realistic, if not pessimistic. If just the opposite emerged – this group would be at least realistic – this result would open new possibilities for global leaders: it is possible – by providing full, and not sugar-coated knowledge – to change one’s perception from unrealistic. As a result, such a result would call for changing the narrative provided by the governments.
Study 2 (healthcare professionals)
Analysis for the whole sample (physicians, nurses, paramedics) combined
Concerning the likelihood of oneself falling ill (M = 5.96, SD = 1.73) and of illness occurring for coworkers (M = 5.87, SD = 1.7), a dependent samples t-test revealed no statistically significant difference: t(206) = 1.06; p = 0.290, d = 0.07.
Analysis for physicians
Concerning the likelihood of oneself falling ill (M = 5.94, SD = 2.11) and of illness occurring in coworkers (M = 5.87, SD = 2.03), a dependent samples t-test revealed no statistically significant difference: t(86) = 0.66; p = 0.511, d = 0.07.
Analysis for nurses
Concerning the likelihood of oneself falling ill (M = 5.99, SD = 1.45) and of illness occurring in coworkers (M = 5.88, SD = 1.46), the dependent samples t-test revealed no statistically significant difference: t(110) = 0.91; p = 0.363, d = 0.09. A summary of the results can be found in Table II.
Comparisons between nurses and physicians
Concerning the likelihood of oneself falling ill, the independent t-test revealed no statistically significant difference t(196) = 0.19; p = 0.849, d = 0.03) between physician and nurse groups. For the physician group (M = 5.94, SD = 2.11) the likelihood of oneself falling ill is similar to that of the nurse group (M = 5.99, SD = 1.45).
Concerning the likelihood of a coworker falling ill, the independent t-test revealed no statistically significant difference, t(196) = 0.04; p = 0.970, d = 0.01). For the physician group (M = 5.87, SD = 2.03) the likelihood of oneself falling ill is similar to that of the nurse group (M = 5.88, SD = 1.46). A summary of the results can be found in Table III.
Table III
Summary of results from second study (independent samples t-test)
| Unrealistic optimism bias | Work area | t | P-value | d | |||
|---|---|---|---|---|---|---|---|
| Nurses | Physicians | ||||||
| M | SD | M | SD | ||||
| Myself | 5.99 | 1.45 | 5.94 | 2.11 | 0.19 | 0.849 | 0.03 |
| Coworker | 5.88 | 1.46 | 5.87 | 2.03 | 0.04 | 0.970 | 0.01 |
Taken together, it is clear that unrealistic optimism is not a general mechanism present in every group, among all citizens. In Poland, the country where we have reported the presence of unrealistic optimism, well educated in COVID-19 issues, a specific group of healthcare workers did not represent unrealistic optimism. With these data in hand, it is clear that unrealistic optimism is not a general, resistant-to-change unrealistic optimism, and could be manageable (by knowledge).
Discussion
In study 1, unrealistic optimism was reported for the whole sample and in each of the investigated countries. It means that the participants perceived their chances of getting COVID-19 as smaller, in comparison to another student from their university. It means that we have got a robust result: unrealistic optimism is general, present in many different countries; thus, this effect might be global. In study 2 a realistic narrative changed the unrealistic optimism into at least a realistic view among healthcare professionals since unrealistic optimism was not present in this group, very aware of the COVID-19 pandemic. Both results are new in the light of the body of literature on unrealistic optimism. First, it is the very first cross-cultural comparison for the link between COVID-19 and unrealistic optimism. Second, our second study delivers a comparison follow-up result suggesting that healthcare professionals – due to the medical knowledge – may not be predestinated to unrealistic optimism.
There was at least one caveat for the first study, leading to recommendations to global health experts: maybe unrealistic optimism is a global feature, dangerous but impossible to change; consequently, governments should not pay attention to unrealistic optimism. On the one hand, the future scenario is pessimistic: scientists and world leaders responsible for global health might assume that unrealistic optimism is present, and they cannot fight back. On the other hand, the second, optimistic scenario is possible as well. It may be the case that unrealistic optimism might be reduced by the data citizens who would receive full understandable knowledge about the severity of COVID-19, making them at least realistic (if not pessimistic). It might mean an enormous push for massive education, and the campaign might reduce unrealistic global optimism. One might expect that only then would COVID-19 be fully eradicated.
To address this issue, we replicated this study in a group that might be very at least realistic, if not pessimistic, about the severity of COVID-19: medical workers who face this virus every day (study 2). In other words, for the comparison, we chose a group loaded with knowledge, making this group realistic. This undertaking sheds light on practical implications stemming from this paper by answering the question: is unrealistic optimism changeable? The answer is clear: yes.
A critical reader of the presented experiments might stress that – on the one hand – there is no proof that unrealistic optimism truly and negatively affects pro-health decisions and actions. On the other hand, it is possible that this effect would not be replicated in a representative, Western sample.
In another study on unrealistic optimism, on a representative USA sample of 1000 participants [14], it was found that unrealistic optimism predicts rejecting a COVID-19 vaccine once it is available on the market. Therefore, the aforementioned critique would not be feasible.
Another critique may have its sources in a closer look at the dates of the 2 waves of the survey carried out in Iran. One might say that the second study was performed very close in time to the first one, and thus no change in time could be possible to measure. With the present data in hand, we are unable to address this issue. On the other hand, we are fully aware that on social sciences grounds (experts in survey research), there is no clear border of the recommended time delay between waves.
Of course, comparisons between Poland, Kazakhstan, and Iran were based on answers given by students. It is still a limitation of the study. One should, however, keep in mind that other studies conducted on more general and diverse populations report the same pattern of results.
Finally, of course, optimism – a psychological feature – is closely linked with patients’ health. For example, optimists report fewer health problems in comparison to pessimists [15, 16]. Secondly, optimistic patients who have undergone under coronary bypass surgery recover at a faster pace, report less severe anginal pain [17], and their blood pressure is higher [18].
A review of studies reporting numerous benefits find 2 main sources of the link between optimism and health: firstly, optimists are more eager to present healthy behaviors; secondly, a positive attitude toward illness lowers stress/stressors and heightens positive biological responses (e.g., immune system [16]).
Although there are many social and behavioral benefits of being optimistic both in the health domain and in other areas of our life [8, 19, 20], in some situations, just the opposite is true. On the one hand, the key factor may be that optimism pays off while fighting illness, or recovering after surgery. On the other hand, the realistic point of view pushes us toward proactive behaviors protecting us from the negative consequences of future events.
In the introduction, we specified 2 main research areas in which vaccines and cure for COVID-19 have to be developed. From the perspective of the experiments presented above, it is clear that the third line is absolutely critical, where it would be tested how to change one’s perspective from unrealistically optimistic to at least realistic. Together with research on effective vaccines and drugs for COVID-19, we have to start the third line of research to stop the mutated and global UO-COVID-19 virus. In our opinion, boosting optimism among citizens cannot be stopped, but global health experts have to start a massive information campaign pushing for more realistic if not pessimistic about health assessments, predictions, and recommendations.
We are not alone in this call for the change in narrative. On June 2nd, Dr. Richard Besser, who used to run the Centers for Disease Control and Prevention (CDC) and now heads the Robert Wood Johnson Foundation, stated: We’re seeing public health and public health recommendations put up as the enemy of restarting the economy, getting people back to work; a lot of people saying, you know what? I don’t think this is such a big deal. And no, I don’t want to wear a mask. I don’t want to social distance. I just want to get back to the way things were. That’s a very dangerous course [21].
Sources of boosting citizens’ optimism toward the COVID-19 pandemic are not hard to find. For example, on May 10, Donald Trump still did not wear a face mask at the press briefing even when the news broke out that 2 staffers of the White House had tested positive for COVID-19, and 3 more key personnel to fight the pandemic went into self-quarantine. In the USA and Europe, economies are being opened, and massive production is returning to full capacity.
Another proposition for employing these data in practical recommendations is that, on the one hand, governments might boost optimism in terms of the economy, and on the other hand, they should keep citizens informed, making them realistic (just as medics and medical staff are). With the present data in hand, it is clear that unrealistically optimistic citizens may start hitting the economy hard since tight restrictions would be placed. In light of the aforementioned factors, there is an urgent need to start massive research on reducing unrealistic optimism (by, for example, searching for data showing unrealistic pessimism during a global threat, e.g., Chernobyl research). It may be acquired by public figures and, at the same time, well-known and respected experts in the field of global health. Planning global change in the narrative, experts should keep in mind that according to previous research on unrealistic optimism, beliefs about personal invulnerability to negative events are so strong that optimistic individuals are exceptionally resistant to objective risk-likelihood information and debiasing interventions that contradict these beliefs [22].
On the other hand, one might consider putting the unrealistic optimism-pessimism coin at the edge. In this situation, one would think that she/he is equally vulnerable to health-threatening episodes precisely to the same extent as an average person. We propose to call this tendency realism. It is to explain, however, that determining whether any specific person is overly optimistic or pessimistic (or whether she or he is right to be realistic) is simply impossible. A person who claims to be relatively (in)vulnerable to a particular negative event may or may not be (in)vulnerable objectively.
The strength of the first study is clear: the study was performed across different cultures and with big sample sizes. Both factors make the reported results important in the body of literature on unrealistic optimism. By the same token, the limitation of this study is evident: in all 3 countries samples were not representative for the society, which makes generalizations less grounded and legitimized. The same issue concerns the second study: it is possible that healthcare professionals working in that specific hospital are very different from the global population. Finally, in case of the first study a real experiment should take place to assess whether in fact participants will or will not follow recommendations and regulations as a result of unrealistic optimism.
In conclusion, in light of the results of this research, global optimism, on the one hand, is present among students but not among healthcare professionals, and on the other hand, might be a double-edged sword. On the one hand, it makes people very eager to leave their homes, return to work, saving consumption by saving the workplace. On the other hand, however, such optimism makes citizens unrealistic about the chances of getting the infection and, by the same token, it creates a risk to the general public [23, 24]. Without a global coordinated push for interdisciplinary psycho-socio-medical research changing the narrative such unrealistic optimism stemming from the leaders is like putting down the wildfire of COVID-19 by use of highly flammable chemicals. Without reconsideration, we are fueling a new, highly infectious and dangerous, mutated virus: UO-COVID-19, i.e., Unrealistic Optimism COVID-19.
Data availability statement
All the data are available under the link:
https://osf.io/pr8he/?view_only=4b17dcacefe5433bb39f0038a3b1d67a