
Introduction
Fibrosis and cirrhosis are the results of chronic liver disease (CLD), which is defined by the progressive destruction and regeneration of the liver parenchyma that lasts for at least six months [1]. Several etiological factors have been identified in children with chronic liver disease, including infections, developmental abnormalities, and metabolic and neoplastic disorders leading to hepatic failure [2]. These factors differ considerably from those observed in adults. According to World Health Organization (WHO) estimates, more than 50% of the global population is affected by chronic hepatitis C virus (HCV) infection, with approximately one million new cases reported annually [3]. In 2022, the WHO projected that nearly 242,000 deaths were attributable to hepatitis C, primarily due to cirrhosis and hepatocellular carcinoma [4]. Globally, HCV remains a leading cause of chronic liver disease, contributing substantially to morbidity and mortality. The therapeutic landscape for HCV infection has changed dramatically as a result of short-course, oral, curative, direct-acting antiviral regimens [5]. HCV infection frequently appears asymptomatic in children, and cirrhosis and hepatocellular cancer are rare and usually progress more slowly than in adults [6]. The rate of HCV infection in children has been assumed to be 0.87% overall, ranging from 0.34% throughout Europe to 3.02% in Africa [7]. Children over ten years old had a considerably greater incidence of HCV (0.97%) than children younger than ten years old (0.75%) [7]. About 3.26 million (2.07-3.90) children around the world are assumed to have HCV, representing a 0.13% (95% CI: 0.08-0.16) viremic prevalence in the pediatric population aged 0-18 years [8-13]. In stark contrast to adult groups, the prevalence and burden of HCV infection in children individuals are not as well understood. According to historical data from small, hospital-based cohorts, adolescents and children who have undergone hospital care for cancer, renal failure, hemodialysis, or surgery of any kind may have an HCV infection prevalence of up to 20% [6, 14, 15].
Hepatitis C virus is primarily transmitted through blood [16]. Given the known risk of infection, children delivered to mothers with ongoing infection with hepatitis C need to be evaluated and tested for HCV [17]. The hepatitis C treatment plan depends on the HCV genotype. There are now two pan-genotype HCV therapies for children’s health: sofosbuvir/velpatasvir and glecaprevir/pibrentasvir [18].
In order to support the early detection of infected people, screening measures have been developed, such as universal screening of expectant mothers and nucleic acid testing for all perinatally exposed newborns between the ages of two and six months [19]. Children of all ages have excellent cure rates thanks to direct-acting antiviral medications, which have revolutionized treatment [20]. Despite significant progress, challenges remain in the fight to eradicate HCV [21]. This includes ongoing efforts to develop a preventive vaccination as well as the need for improved access to testing and treatment [22]. Reducing the burden of HCV infection requires ongoing research and the implementation of efficient therapies [3].
The alanine aminotransferase/aspartate aminotransferase (AAR) ratio, the AST-to-platelet ratio (APRI), and the fibrosis score (FIB-4) are examples of conventional fibrosis grading systems [23]. In adults, these scores have been used to predict the presence of advanced liver fibrosis (cutoff values) [24]. A number of studies have shown that these metrics are inappropriate for children, underscoring the pressing need to validate and set new thresholds for pediatric populations [25]. Liver cirrhosis progression can be slowed, and the risk of liver cancer may be reduced by intervention in the initial stages of hepatic fibrosis [26]. It is noteworthy that no research has evaluated the APRI and FIB-4 scores for identifying fibrosis in children with HCV worldwide. The purpose of this research was to determine whether APRI and FIB-4 scores may be used to identify the stage of liver fibrosis among children diagnosed with HCV.
Material and methods
Study design and patient setting
At Menoufia University’s National Liver Institute’s Pediatric Hepatology, Gastroenterology, and Nutrition department, 120 children with HCV diagnoses participated in a retrospective study. The study involved 120 patients in total who were split into two groups: 98 patients were assigned to the ≤ F2 group and 22 patients to the > F2 group.
Ethical considerations
The study complied with the World Medical Association’s Declaration of Helsinki, according to the authors. Both the local committee of the National Liver Institute at Menoufia University (NLI 00014014/FWA00034015, IRB: 00755/2025) and the Ethical Committee of the Faculty of Medicine at Al-Azhar University (RESERACH/ AZ.AST./PHY003/11/237/1/2025) approved all study methods. The advantages, possible risks, and every stage of the procedure were explained to all participants. Before taking part in the research, each participant signed an informed consent form.
Patients’ selection criteria
Participants under the age of eighteen who had been diagnosed with a chronic HCV infection defined as having positive HCV RNA for more than six months were eligible to participate. Every participant had the complete clinical, laboratory, and imaging information needed to determine their FIB-4 and APRI scores. The study excluded patients with co-infections of hepatitis B virus (HBV), those with alternative causes of chronic liver disease (e.g., Wilson’s disease, autoimmune hepatitis), those who had previously received antiviral medications, those who had decompensated liver disease, and those with insufficient medical records.
Sample size estimation
A representative sample of 120 participants is thought to be sufficient for first validation to assess the precision of non-invasive ratings for forecasting hepatic fibrosis in children infected with HCV. Although larger samples improve the stability of statistical results, the current literature suggests that clinical validation studies require at least 120 individuals, especially when the condition under investigation is somewhat uncommon in the target population. The selected sample size ensures practical viability in a pediatric clinical setting while facilitating reliable estimation of diagnostic performance parameters, such as sensitivity, specificity, and area under the ROC curve. Larger cohorts and additional external validation should be a part of future research.
Clinical and laboratory assessment
All patients underwent an assessment of clinical and demographic variables, including gender and age. A complete blood count was obtained using the Sysmex KX-21 automated hematology analyzer (Sysmex Corporation, Japan), including the differential leucocytic count. The Sysmex XT Automated Hematology Systems use hydrodynamic focusing and fluorescence flow cytometry. Liver function tests, including ALT, AST, total and direct bilirubin, serum albumin, as well as kidney function tests, including urea and creatinine levels, were performed using the Integra 400 auto-analyzer from Roche Diagnostics, Germany (COBAS INTEGRA 400 plus, 2009). Hepatitis B and C virus screening was performed in addition to abdominal ultrasound imaging.
Histopathological examinations
Throughout July 2024 and August 2025, 120 individuals with a persistent HCV infection had their formalin-fixed, paraffin-embedded specimens used in this retrospective cohort analysis. The National Liver Institute’s Pathology Department’s archives provided the specimens. Histological findings, radiographic information, and a positive serological test were used to make the diagnosis. Data from radiographic, laboratory, histopathological, and clinical sources were reported. On a scale of 0-18, the severity of necro-inflammation was determined by microscopically examining hematoxylin and eosin (H&E)-stained sections (minimum 1-3/18, mild 4-8/18, moderate 9-12/18, and severe 13-18/18). Microscopical examination of MT-stained sections verified the histological stage of fibrosis (6/6). The Ishak scoring system was used for both fibrosis stage and necro-inflammation grading [27].
As shown in Figure 1, the histopathology of liver biopsy revealed hepatic tissue of HCV infected children showing variable stages of fibrosis ranging from (mild, moderate and severe) and variable grades of inflammation (mild and moderate) in form of portal and lobular inflammation. Some cases also displayed steatosis which is characteristic feature in HCV infected liver.
Fig. 1
Histopathology of liver biopsy of H&E stained slide of a child with HCV infection showing A) mild periportal fibrosis (blue arrows), mild portal inflammation (red arrows) and minimal steatosis (green arrow) (100×), B) high-power image of mild periportal fibrosis (blue arrow), mild portal inflammation (red arrow) and minimal steatosis (green arrow) (200×), C) moderate portal fibrosis and porto-portal link formation (blue arrows), and mild portal inflammation (red arrows) (200×), D) high-power picture of moderate portal fibrosis (blue arrow), and mild portal inflammation (red arrow) (400×), E) marked fibrosis (established cirrhosis) with regenerative nodule formation (blue arrows), and moderate portal inflammation (red arrows) (100×), and F) high power image showing marked fibrosis (blue arrow), and moderate portal inflammation (red arrow) (400×)
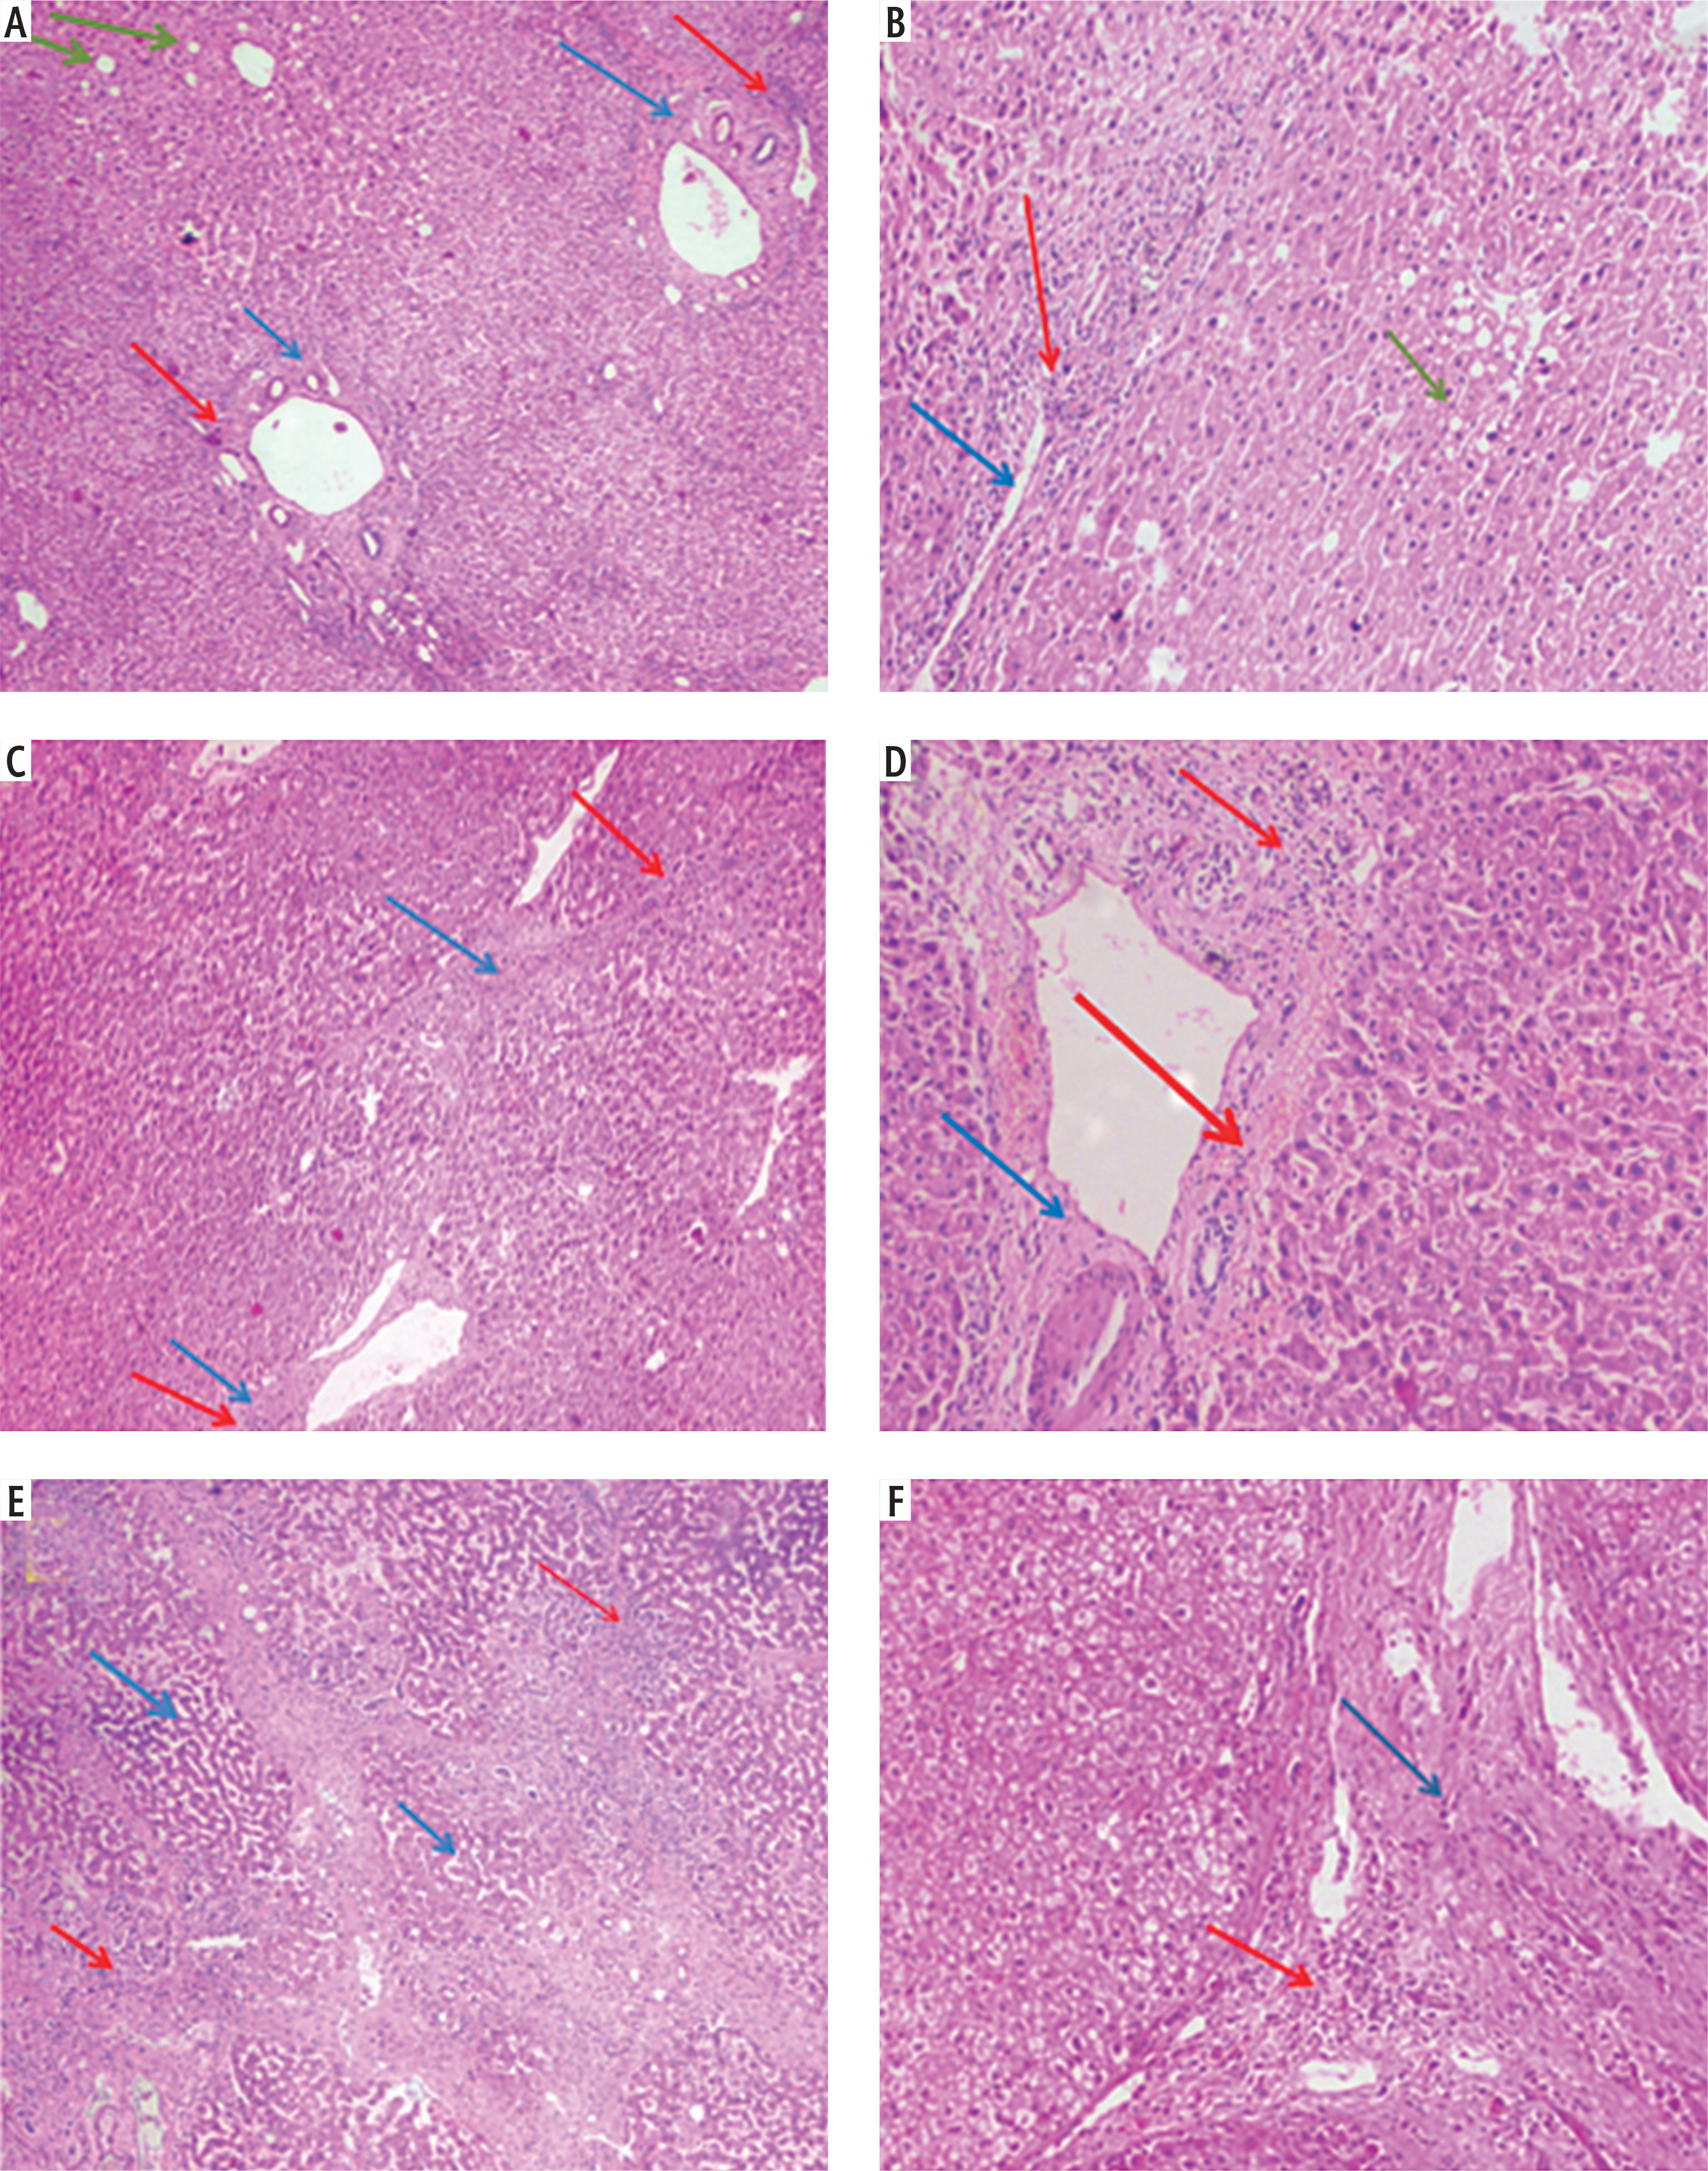
Blood sample collection
Serum separator tubes were used to collect blood samples from each participant, which were then centrifuged, aliquoted, and frozen. Before being analyzed, the samples were kept at –80°C.
Statistical analysis methods
The data were collected, tabulated, and analyzed statistically using SPSS version 25 on a compatible IBM personal computer (Armonk, NY: IBM Corp.). Descriptive statistics were calculated for quantitative variables, and are presented as median and range. The study used the chi-squared (χ2) test to investigate the relationship between qualitative characteristics. When over 20% of the cells had an expected count of less than 5, the Monte Carlo correction for the chi-square test or Fisher’s exact test was applied. Two normally distributed datasets were compared through quantitative variables using Student’s t-test (t). The Mann-Whitney U test (U) was employed to compare quantitative variables between two groups of non-normally distributed data. ROC analysis plotted sensitivity versus 1-specificity to assess the accuracy of classification model predictions. P-values below 0.05 were considered statistically significant.
Results
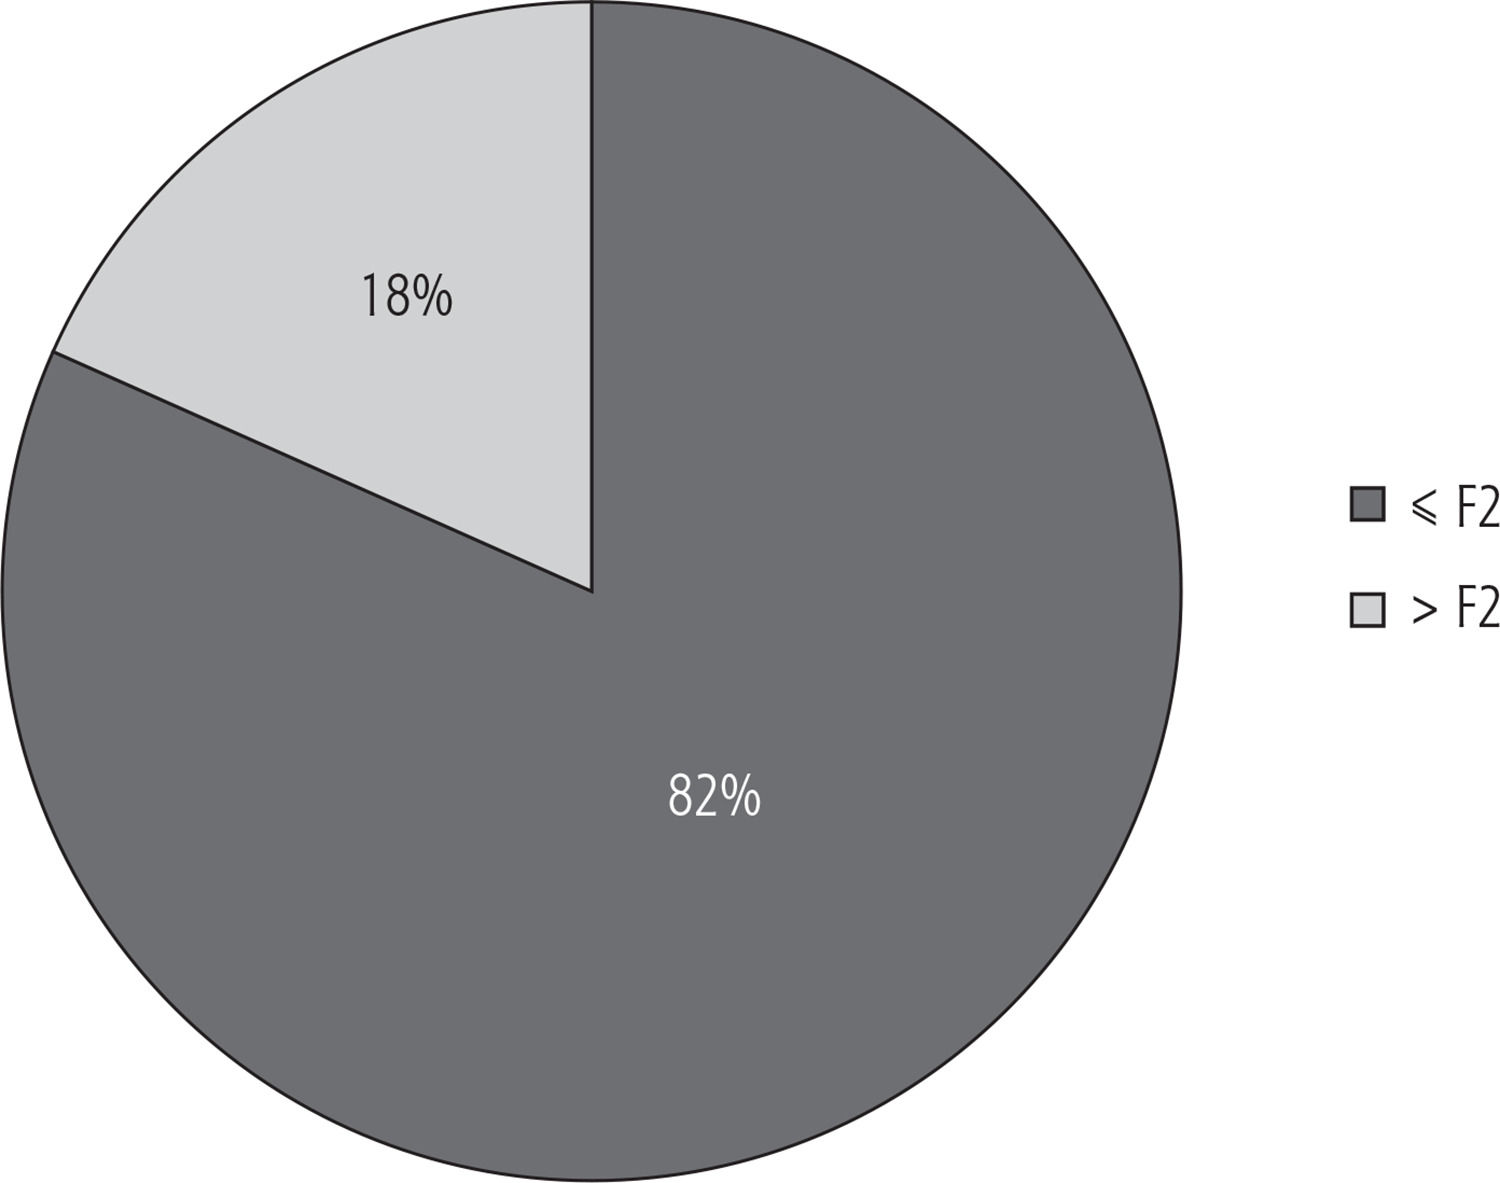
According to a workflow diagram describing the cohort of 126 children with HCV infections who enrolled at Menoufia University’s National Liver Institute, 6 individuals were not included in the study (2 denied consent and 4 did not match the inclusion criteria). This led to the inclusion of 120 patients in the research. A total of 98 patients were assigned to the ≤ F2 group, while 22 more patients were assigned to the > F2 group (Fig. 2). The descriptive information about the study participants is shown in Table 1. Of the individuals we evaluated, 82% had ≤ F2 at presentation, while 18% had > F2 (Fig. 3).
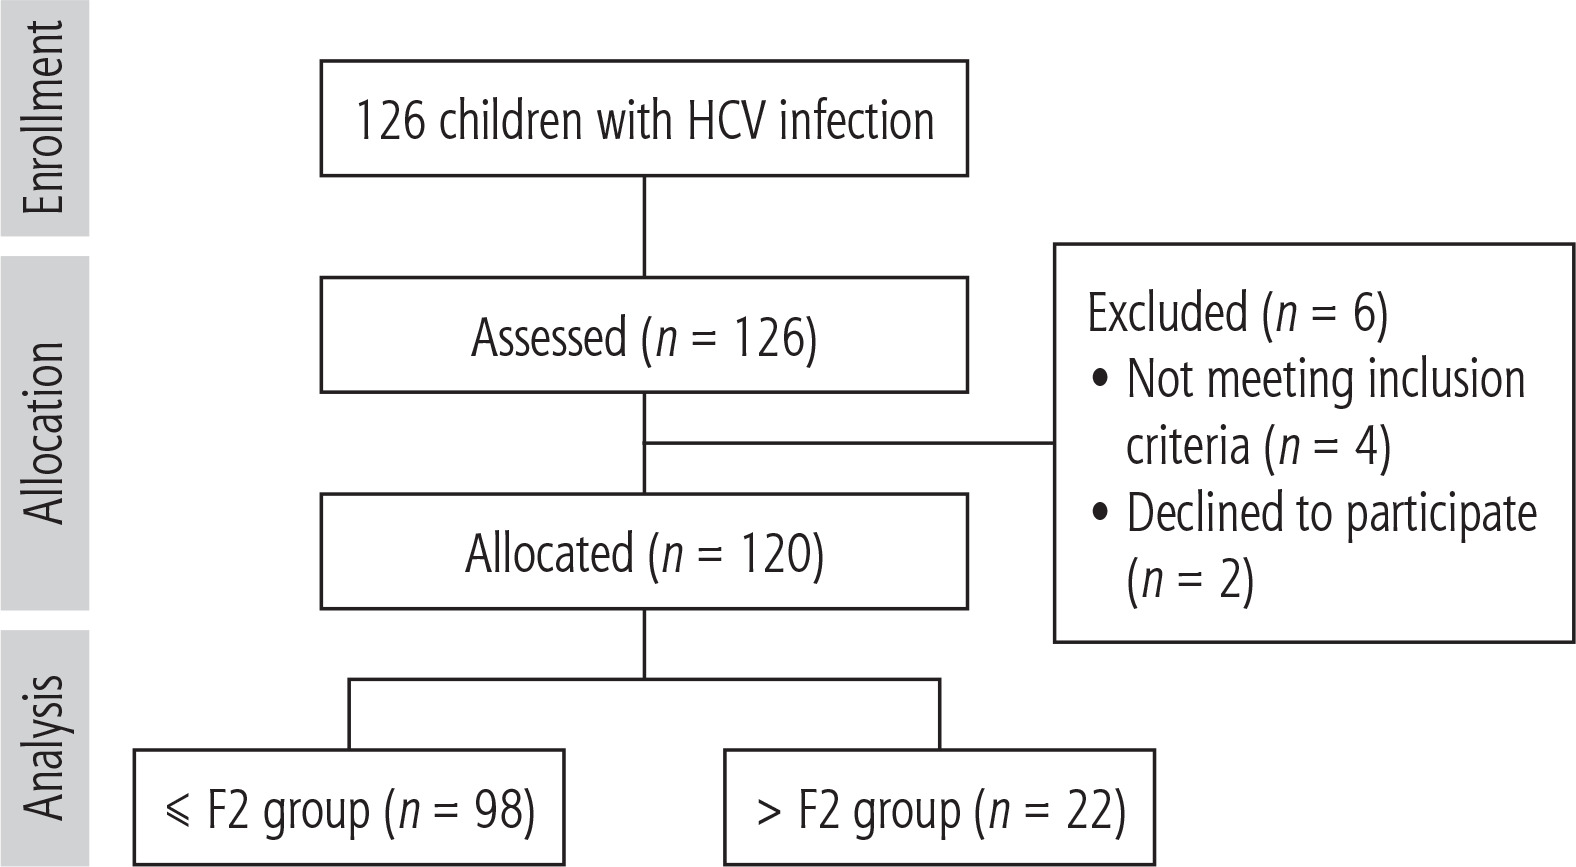
Table 1
Descriptive data of the patients studied
[i] HB – hemoglobin, WBCs – white blood cells, PLT – platelets, TBIL – total serum bilirubin test, DBIL – direct bilirubin test, ALT – alanine transaminase, AST – aspartate amino transferase, ALKP – alkaline phosphate, AAR – alanine and aspartate ratio, GGT – ã-glutamyl transferase, INR – International Normalized Ratio, FIB-4 – Fibrosis-4 Index, APRI – AST to platelet ratio
The current study found no significant differences between the groups concerning age and gender (p > 0.05). Significant differences were observed between the studied groups concerning abdominal examination and abdominal ultrasound (p < 0.001). Among patients with > F2, 82% (n = 18) exhibited splenomegaly, and 82% (n = 18) presented with both cirrhotic liver and splenomegaly, in contrast to the ≤ F2 group (Table 2).
Table 2
Relation between liver biopsy findings and demographic data
| Liver biopsy | ≤ F2 (n = 98) | > F2 (n = 22) | ZU | P value |
|---|---|---|---|---|
| Age (years) | 0.374 | 0.708 | ||
| Mean ±SD | 9.75 ±2.84 | 10.36 ±3.61 | ||
| Median (range) | 10 (5-15) | 9 (5-17) | ||
| Males | 68 (69) | 16 (73) | FE = 0.047 | 0.829 |
| Females | 30 (31) | 6 (27) | ||
| Abdominal examination | FE = 46.380 | < 0.001* | ||
| No organomegaly | 98 (100) | 4 (18) | ||
| Splenomegaly | 0 (0) | 18 (82) | ||
| Abdominal ultrasound | FE = 46.380 | < 0.001* | ||
| No organomegaly | 98 (100) | 4 (18) | ||
| Cirrhotic liver and splenomegaly | 0 (0) | 18 (82) |
Additionally, HB, WBCs, TBIL, DBIL, ALT, AST, INR, and AAR did not significantly differ across the groups in this ongoing research (Table 3, Fig. 4). Significant differences (p < 0.05) were found between the groups under study for PLT, ALKP, GGT, serum albumin, FIB-4, and APRI. The levels of PLT, ALKP, and GGT were significantly higher in the ≤ F2 group than in the > F2 group. APRI, FIB-4 and serum albumin levels were significantly higher in the > F2 group than in the ≤ F2 group (Table 3, Fig. 4).
Table 3
Relation between liver biopsy findings and laboratory investigation
| Liver biopsy | ≤ F2 (n = 98) Mean ±SD Median (range) | > F2 (n = 22) Mean ±SD Median (range) | ZU | P value |
|---|---|---|---|---|
| HB (g/dl) | 12.31 ±1.28 12.30 (10.10-15.80) | 12.07 ±1.86 12.20 (8.70-15.80) | 0.411 | 0.681 |
| WBCs (cells/μl) | 6264.89 ±2200.46 6100 (2590-11600) | 5927.27 ±2567.13 5600 (2900-11600) | 0.774 | 0.439 |
| PLT (103/mm3) | 295979.59 ±79255.78 310000 (164000-450000) | 137818.18 ±31086.38 140000 (93000-191000) | 4.961 | < 0.001* |
| TBIL (mg/dl) | 0.77 ±0.24 0.70 (0.40-1.20) | 0.70 ±0.24 0.60 (0.40-1.10) | 0.914 | 0.361 |
| DBIL (mg/dl) | 0.36 ±0.092 0.40 (0.20-0.50) | 0.33 ±0.12 0.40 (0.20-0.50) | 0.711 | 0.477 |
| ALT (U/l) | 44.63 ±27 34 (7-110) | 40.72 ±29.82 32 (7-108) | 0.660 | 0.509 |
| AST (U/l) | 44.46 ±24.88 40 (8-110) | 42.36 ±29.107 35 (8-110) | 0.382 | 0.702 |
| ALKP (U/l) | 118.51 ±44.33 120 (4-187) | 84.90 ±31.68 64 (57-145) | 2.360 | 0.018* |
| GGT (IU/ml) | 3.98 ±0.24 4 (3.60-4.50) | 3.02 ±0.26 3 (2.50-3.50) | 5.177 | < 0.001* |
| Serum albumin (gm/l) | 1.01 ±0.7 1 (1-1.50) | 1.83 ±0.22 1.80 (1.40-2.20) | 7.343 | < 0.001* |
| INR | 1.03 ±0.217 1.03 (0.63-1.58) | 1.12 ±0.37 1.06 (0.63-1.94) | 0.449 | 0.653 |
| AAR | 35.34 ±9.04 36 (15-54) | 34.18 ±8.32 30 (27-55) | 0.555 | 0.579 |
| FIB-4 | 1.67 ±0.56 1.70 (0.90-2.80) | 3.08 ±0.29 3.10 (2.40-3.50) | 5.037 | < 0.001* |
| APRI | 0.59 ±0.19 0.60 (0.20-0.90) | 1.43 ±0.31 1.30 (1.10-2) | 5.214 | < 0.001* |
HB – hemoglobin, WBCs – white blood cells, PLT – platelets, TBIL – total serum bilirubin test, DBIL – direct bilirubin test, ALT – alanine transaminase, AST – aspartate amino transferase, ALKP – alkaline phosphate, GGT – γ-glutamyl transferase, INR – International Normalized Ratio, AAR – alanine and aspartate ratio, FIB-4 – Fibrosis-4 Index, APRI – AST to platelet ratio, U – Mann-Whitney U test),
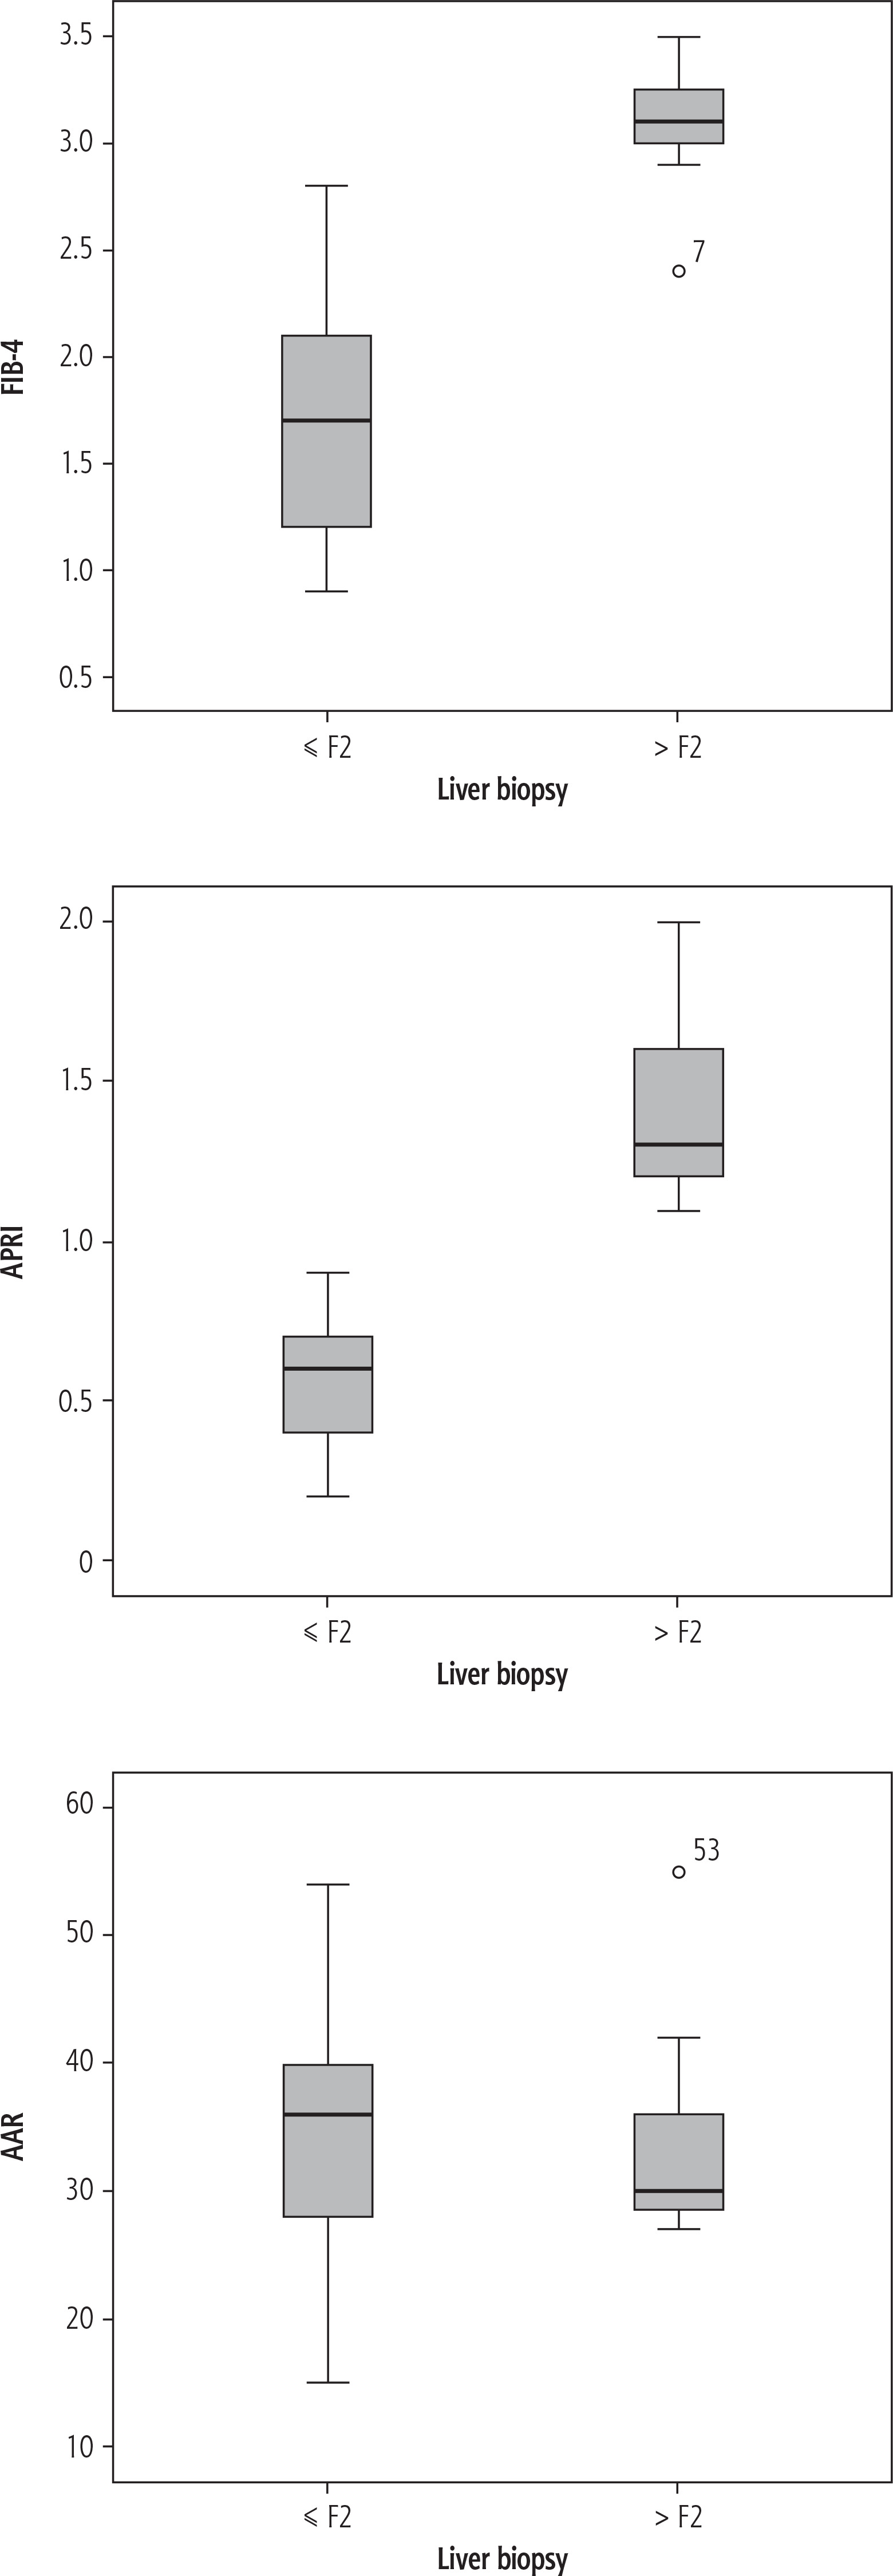
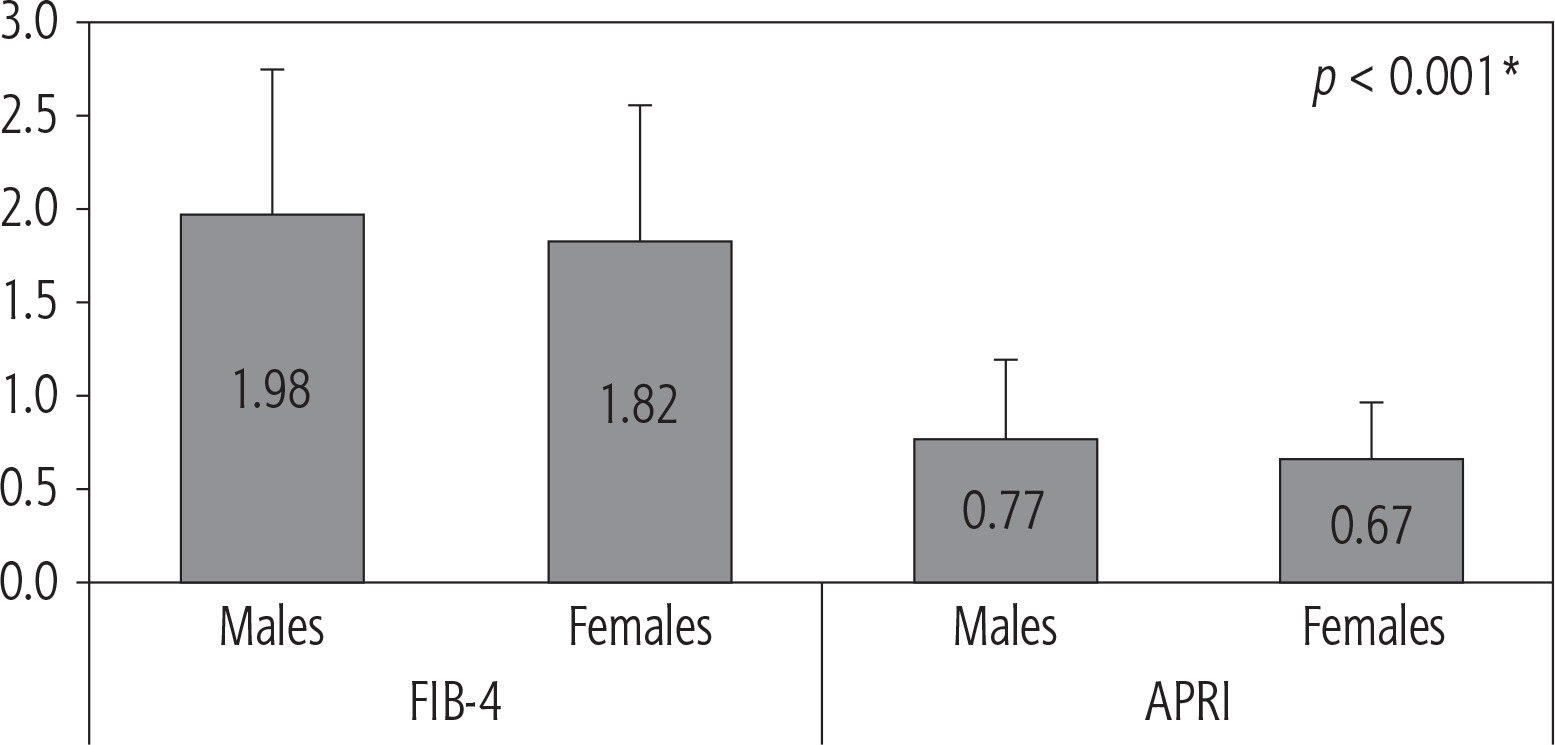
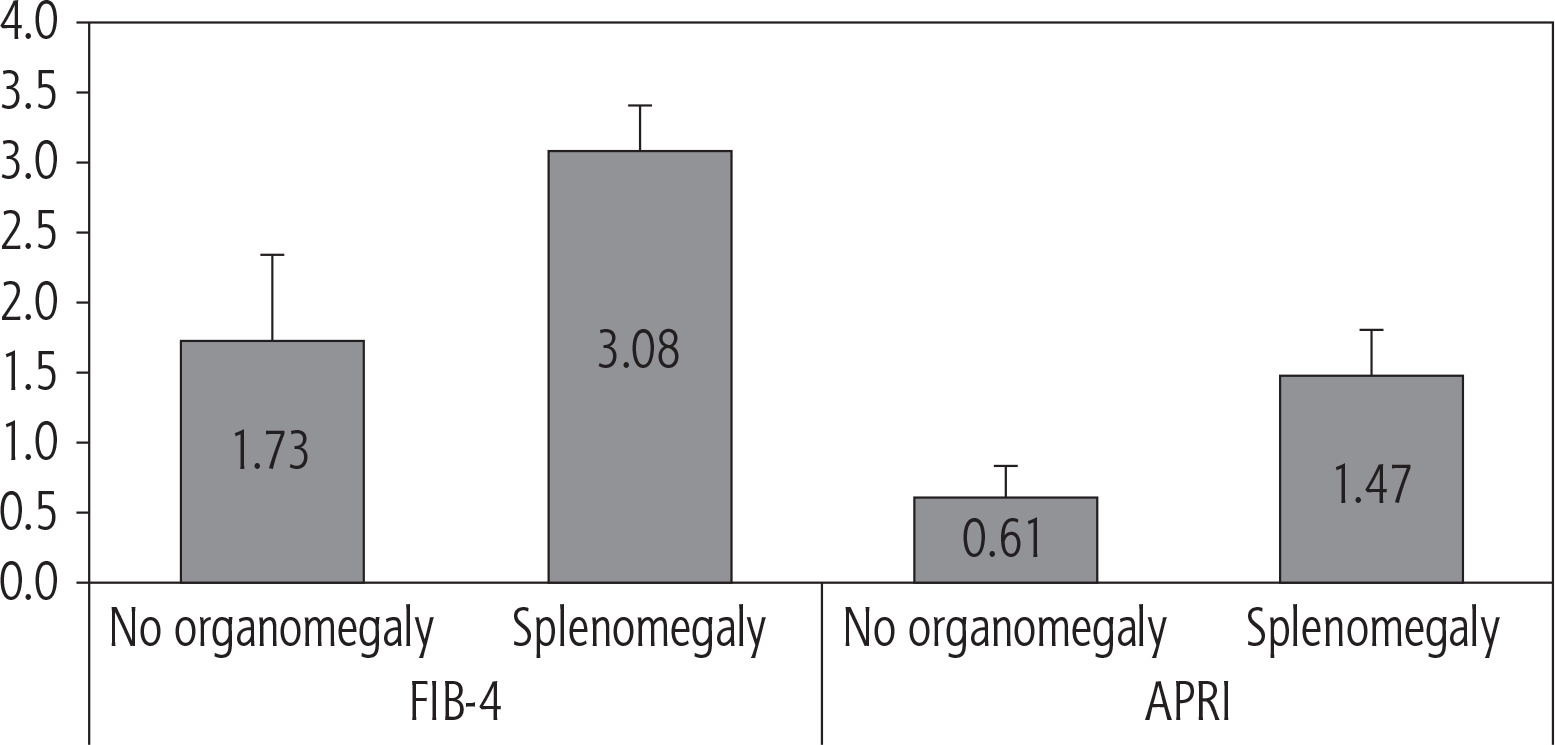
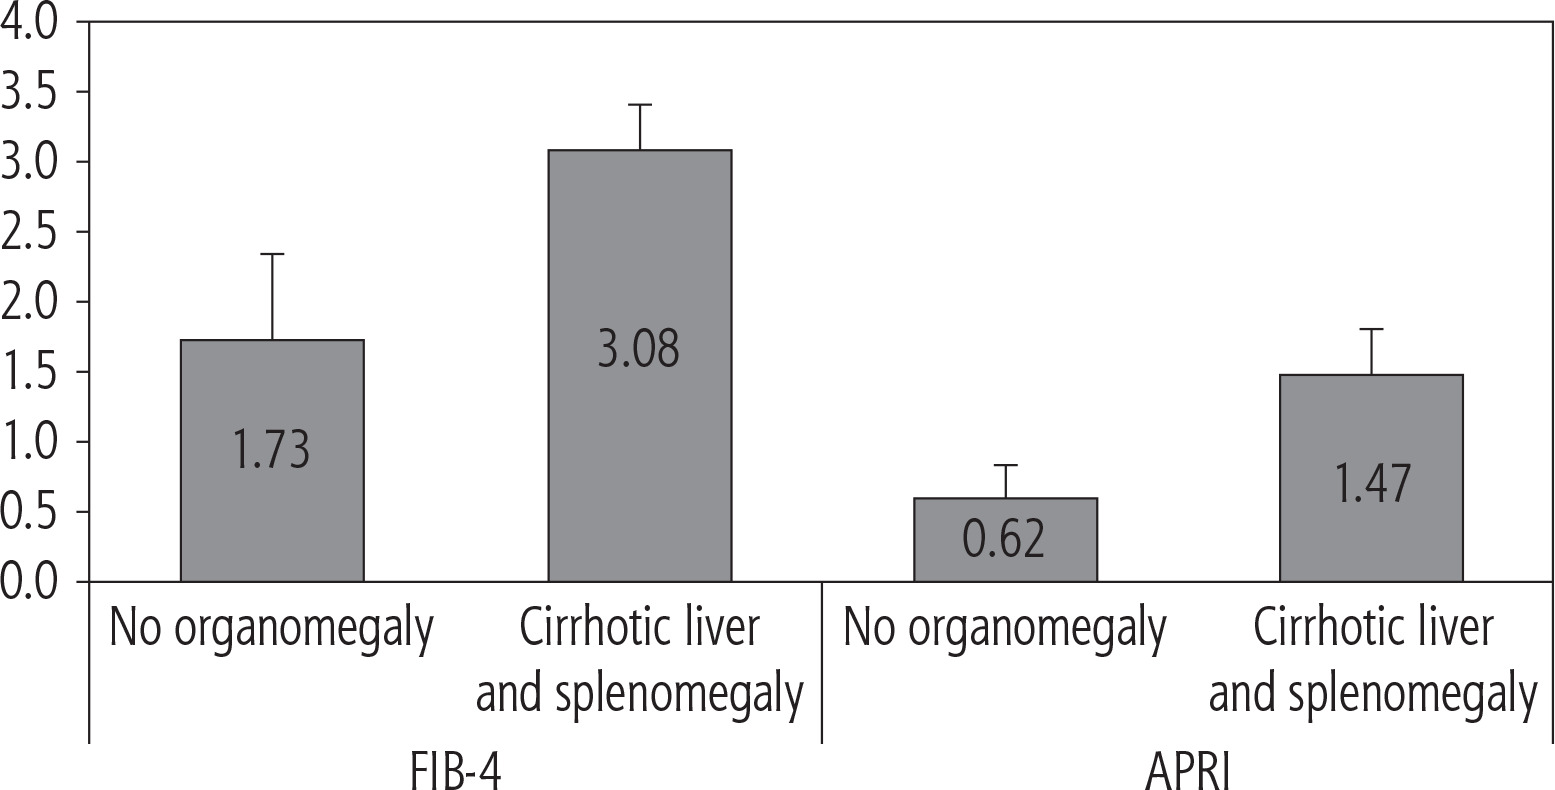
The findings shown in Figures 5-7 indicate that male participants had significantly higher FIB-4 and APRI scores than female patients (1.98 vs. 1.82 and 0.77 vs. 0.67, p < 0.001), respectively (Fig. 5). For example, Figure 6 shows that the prevalence was significantly higher in splenomegaly patients (3.08 compared to 1.73 and 1.47 compared to 0.61, p < 0.001). APRI and FIB-4 scores were considerably higher in cirrhotic individuals with splenomegaly during ultrasound examination (3.08 compared to 1.73 and 1.47 compared to 0.62, p < 0.001), as displayed in Figure 7.
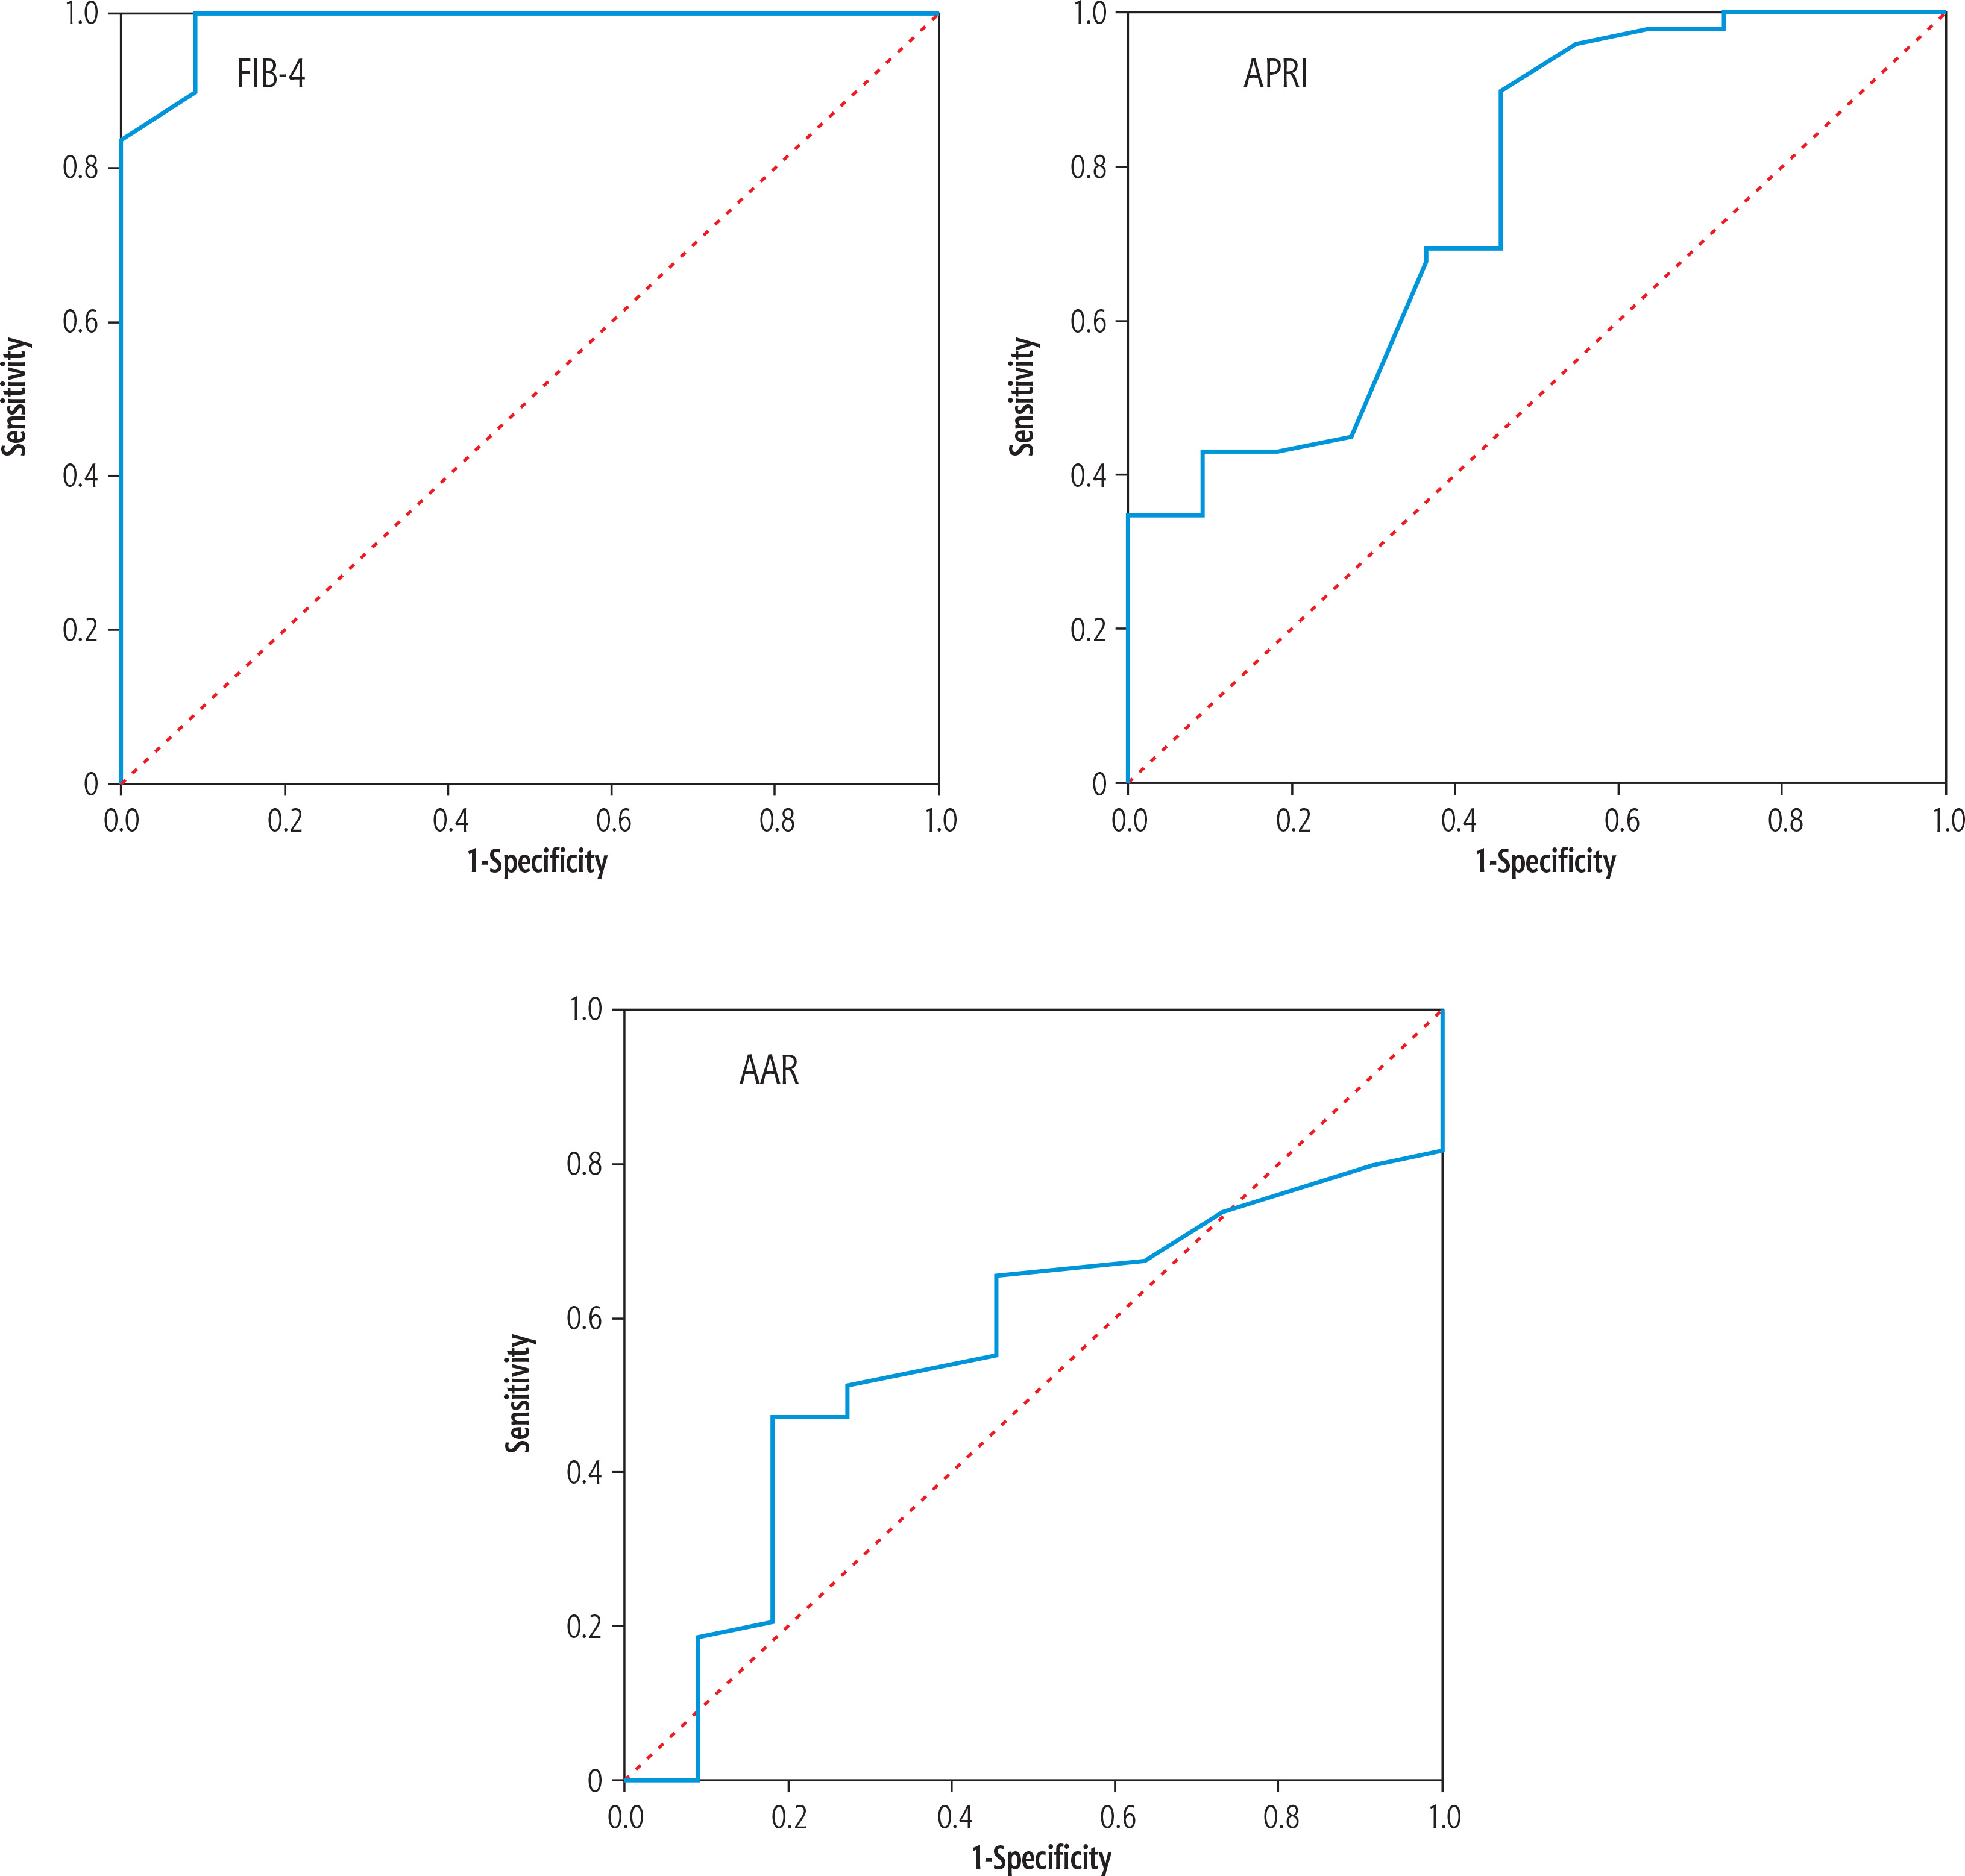
According to ROC curve analysis, FIB-4 and APRI are highly predictive of fibrosis stage in the current study. Their respective areas under the ROC curve were 0.988 (95% CI: 0.962-1.000) and 0.863 (95% CI: 0.940-1.000). According to Table 4 and Figure 8, these measurements highlighted sensitivity levels of 96.73% and 92.55%, specificities of 89.12% and 84.16%, and accuracies of 89.95% and 85.49% (p < 0.001).
Table 4
Accuracy of the three different scores in prediction of fibrosis stage
| Test result variable(s) | AUC | P value | Sensitivity (%) | Specificity (%) | Accuracy (%) | Asymptotic 95% CI | |
|---|---|---|---|---|---|---|---|
| Lower bound | Upper bound | ||||||
| AAR | 0.446 | 0.580 | 62.80 | 75.90 | 72.66 | 0.272 | 0.620 |
| FIB-4 | 0.988 | < 0.001* | 96.73 | 89.12 | 89.95 | 0.962 | 1.000 |
| APRI | 0.863 | < 0.001* | 92.55 | 84.16 | 85.49 | 0.940 | 1.000 |
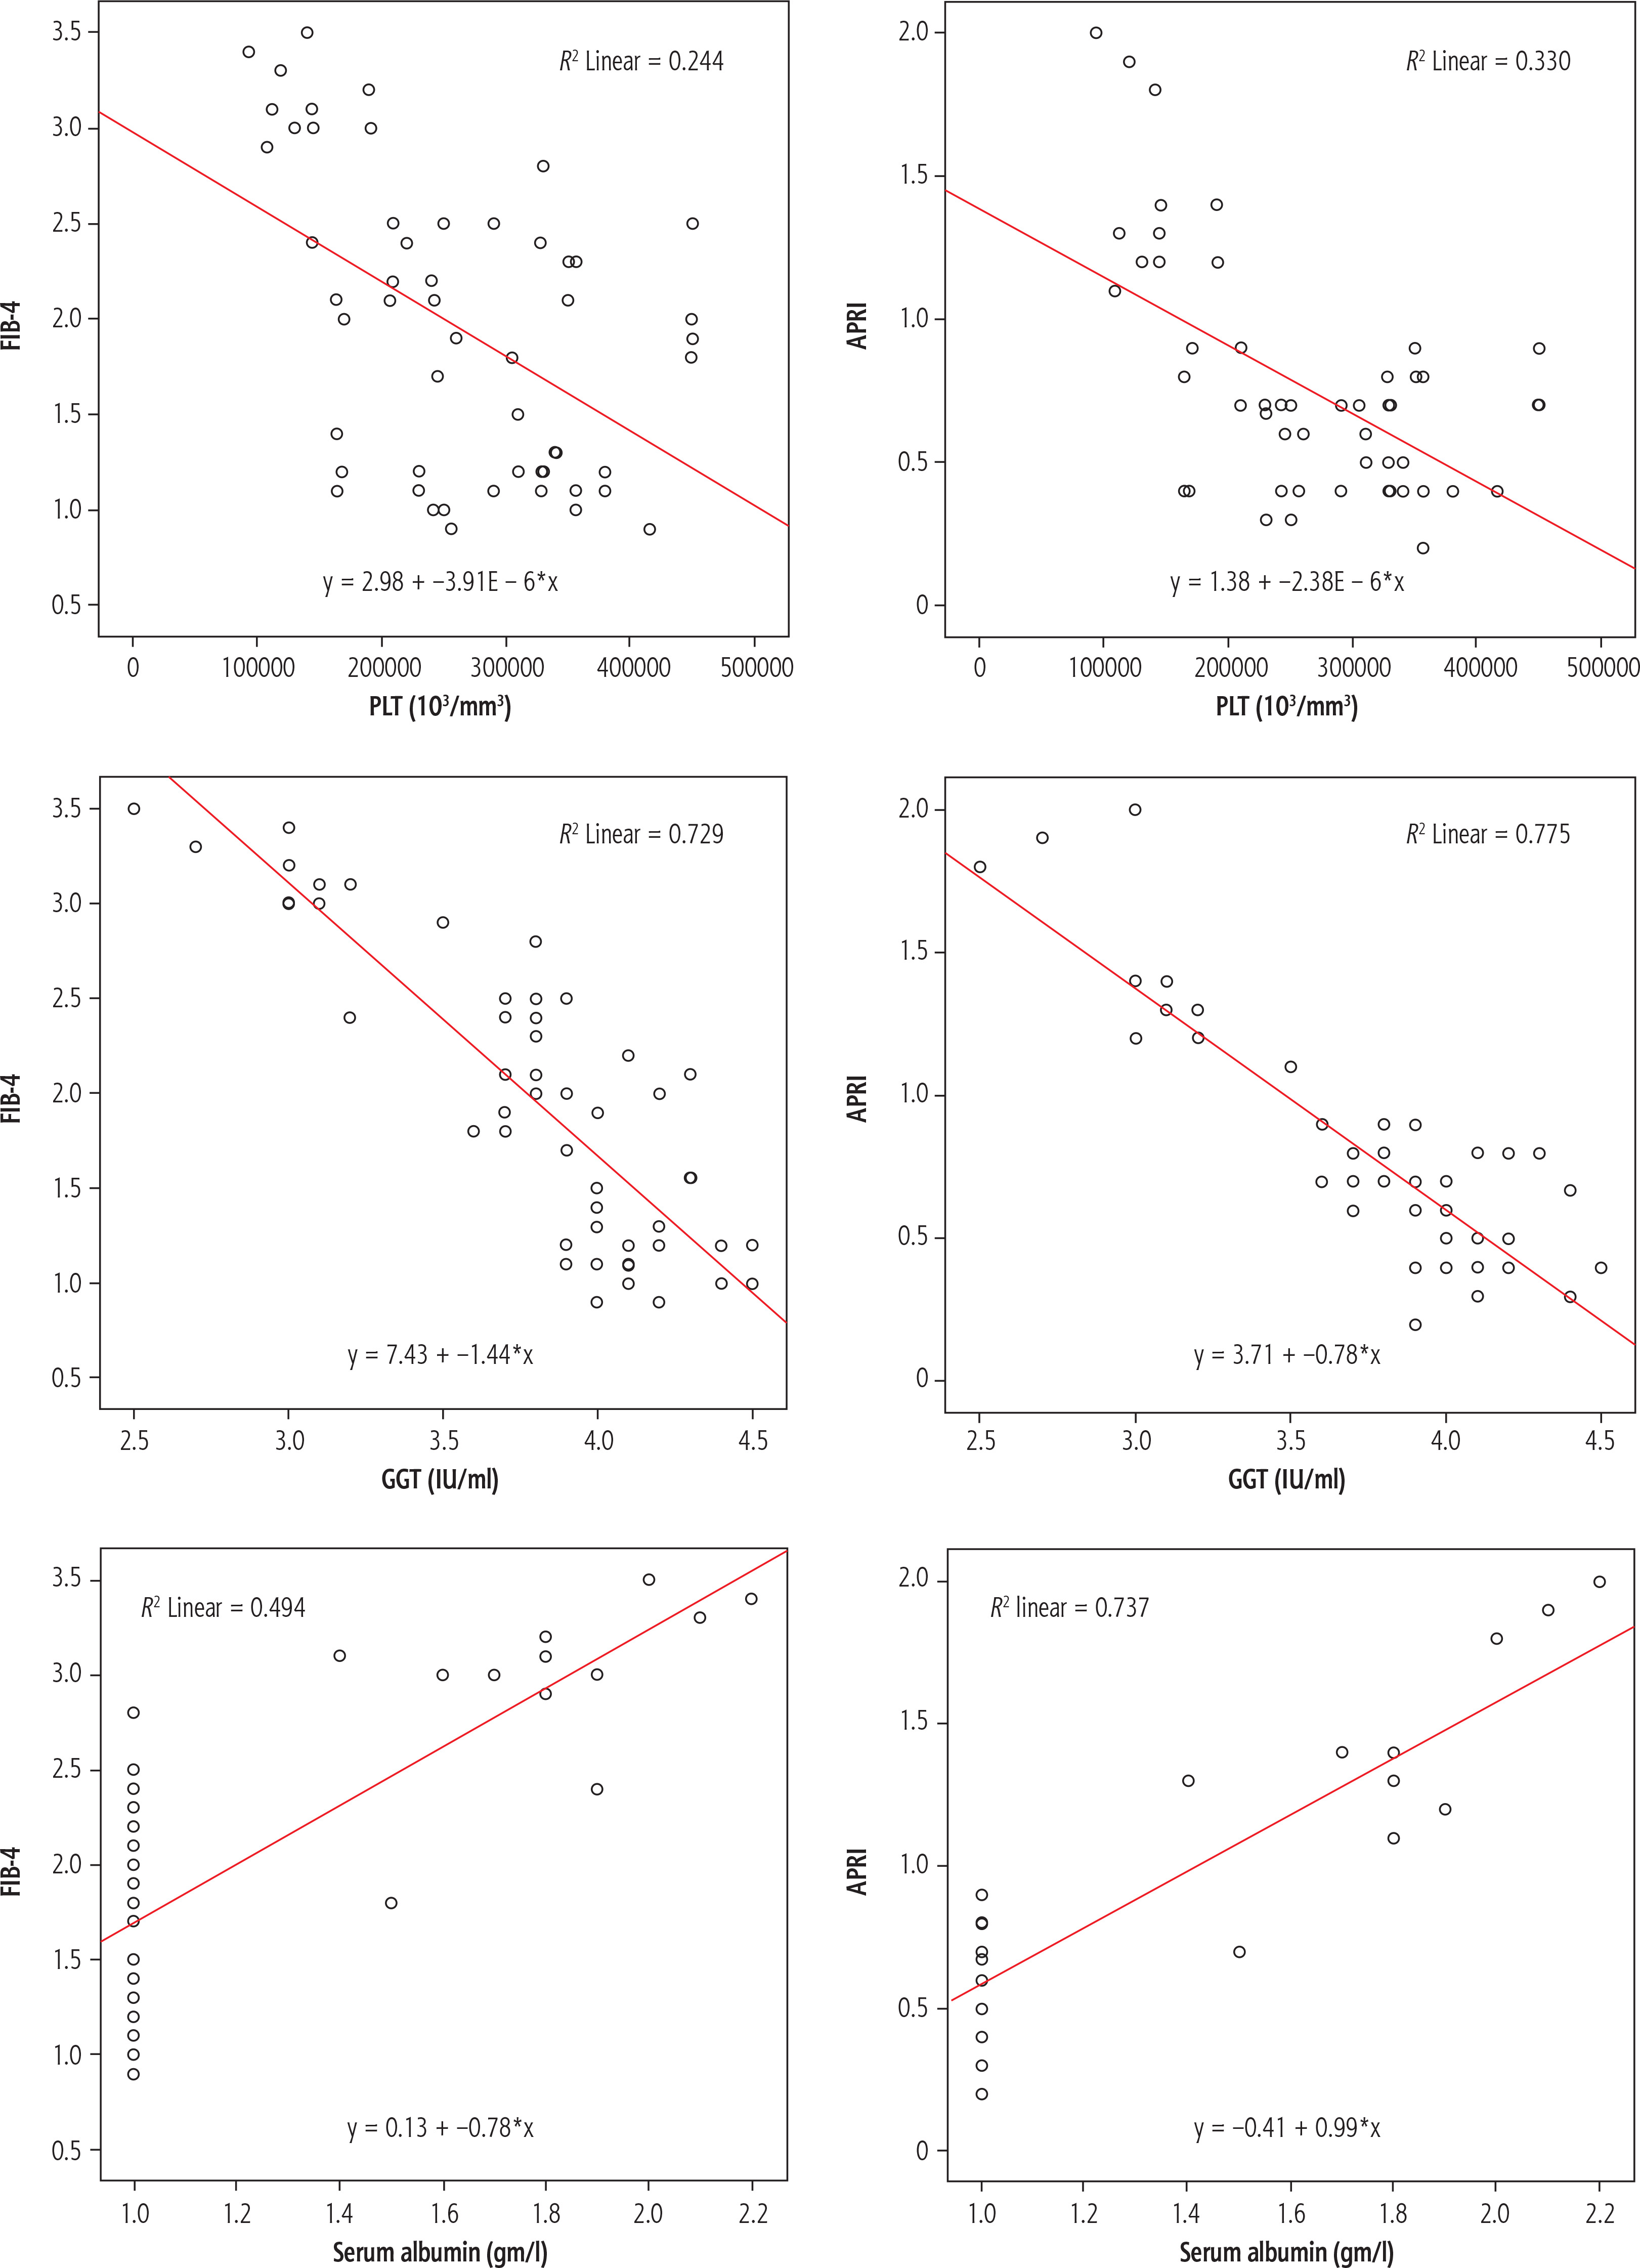
The FIB-4 score was shown to be significantly positively correlated with serum albumin (r = 0.703, p = 0.001), APRI (r = 0.902, p = 0.001), GGT (r = 0.854, p = 0.001), ALKP (r = 0.285, p = 0.027), and PLT (r = 0.494, p = 0.001) in the current investigation. There was no discernible relationship between the variables under study and FIB-4. APRI also showed a strong positive connection with serum albumin (r = 0.859, p = 0.001), GGT (r = 0.880, p = 0.001), and PLT (r = 0.575, p = 0.001). APRI did not significantly correlate with the variables under study (Table 5, Fig. 9).
Table 5
Correlation coefficient between FIB-4 and APRI score and the studied variables
| Variable | FIB-4 | APRI | ||
|---|---|---|---|---|
| r | p value | r | p value | |
| Age (years) | 0.132 | 0.315 | 0.117 | 0.374 |
| HB (g/dl) | 0.128 | 0.331 | 0.170 | 0.193 |
| WBCs (cells/μl) | 0.141 | 0.283 | 0.110 | 0.401 |
| PLT (103/mm3) | 0.494 | 0.001* | 0.575 | 0.001* |
| TBIL (mg/dl) | 0.064 | 0.625 | 0.114 | 0.387 |
| DBIL (mg/dl) | 0.104 | 0.430 | 0.176 | 0.180 |
| ALT (U/l) | 0.110 | 0.405 | 0.040 | 0.764 |
| AST (U/l) | 0.099 | 0.450 | 0.067 | 0.611 |
| ALKP (U/l) | 0.285 | 0.027* | 0.205 | 0.116 |
| AAR | 0.032 | 0.806 | 0.031 | 0.814 |
| GGT (IU/ml) | 0.854 | 0.001* | 0.880 | 0.001* |
| Serum albumin (gm/l) | 0.703 | 0.001* | 0.859 | 0.001* |
| INR | 0.030 | 0.818 | 0.140 | 0.285 |
| APRI | 0.902 | 0.001* | – | – |
HB – hemoglobin, WBCs – white blood cells, PLT – platelets, TBIL – total serum bilirubin test, DBIL – direct bilirubin test, ALT – alanine transaminase, AST – aspartate amino transferase, ALKP – alkaline phosphate, AAR – alanine and aspartate ratio, GGT – γ-glutamyl transferase, INR – International Normalized Ratio, APRI – AST to platelet ratio, correlation coefficient (r),
Discussion
Although children are less likely than adults to have chronic hepatitis C, between 3.5 and 5 million children worldwide are thought to have chronic HCV infection [11]. For a number of hepatic disorders in children, liver biopsy is an essential part of the medical decision-making process [28]. Although liver biopsy remains the gold standard for assessing fibrosis, its routine use is limited by invasiveness, cost, and potential complications, particularly in pediatric patients [29]. In recent years, several non-invasive blood-based markers for liver fibrosis have been developed; however, their application is still restricted, as clinicians often question their diagnostic accuracy [30]. These markers generally demonstrate limited precision in patients with chronic HCV monoinfection, particularly in predicting advanced fibrosis [31]. Therefore, the aim of this study was to evaluate the performance of the FIB-4 and APRI scores in identifying liver fibrosis among children with HCV infection. It is important to note that no research has looked at the APRI and FIB-4 scores for identifying fibrosis in children with HCV worldwide.
The current study’s findings reveal significant differences in various biochemical and radiological markers among pediatric patients with differing levels of liver fibrosis resulting from HCV infection. Platelet count, ALKP, GGT, and APRI were significantly elevated in patients with fibrosis stages ≤ F2, whereas serum albumin and FIB-4 levels were higher in those with fibrosis stages > F2. Furthermore, FIB-4 and APRI scores were markedly elevated in male patients and individuals exhibiting splenomegaly. In cirrhotic patients, ultrasound-detected splenomegaly was associated with increased FIB-4 and APRI scores. The observations highlight the potential effectiveness of FIB-4 and APRI as non-invasive methods for evaluating liver fibrosis severity in pediatric HCV cases. Multiple prior studies corroborate our findings. According to Kayadibi et al. [30], APRI and platelet count are useful non-invasive indicators for identifying and ruling out severe cirrhosis and fibrosis in HCV patients. In order to improve diagnostic quality, Ishtiaq et al. [32] emphasized the diagnostic use of FIB-4 in circumstances where APRI scores are equivocal and recommended applying both indices simultaneously. Their results, alongside findings from Crossan et al. [33] and de Oliveira et al. [34], support our observations on the complementary value of APRI and FIB-4, particularly in resource-limited settings lacking access to transient elastography (TE). Gökcan et al. [35] emphasized the advantages of FIB-4 over APRI, citing its incorporation of age and ALT, which enhances its efficacy in identifying advanced fibrosis.
Additionally, the findings of research conducted by Papadopoulos et al. [36] with 575 patients were in agreement with ours. Both APRI and FIB4 are useful in predicting severe fibrosis, as this study shows. A retrospective analysis was conducted by Papaluca et al. [37] using a sample of 1007 patients who tested positive for HCV. The authors showed that FIB4 and APRI scores are trustworthy and sensitive noninvasive diagnostic methods that may successfully demonstrate the absence of liver cirrhosis. Meanwhile, the requirement for transient elastography is reduced by both APRI and FIB4 scores. According to the study by Yen et al. [38] FIB4 is better than APRI at determining hepatic fibrosis in HCV patients. APRI’s area under the curve (AUC) was 0.70 in patients with F4 fibrosis, while FIB4’s was 0.73. Consistent with our results, Taneja et al. [39] found that both FIB-4 and APRI were inexpensive initial tests with good diagnostic performance. Additional evidence suggesting that APRI exhibits intermediate accuracy in identifying fibrosis in chronic hepatitis C was reported by Liu et al. [40]. Similar to the predictive trends seen in our pediatric population, Lin et al. [41] found that FIB-4 and APRI were the most validated non-invasive measures for identifying advanced fibrosis and cirrhosis. Our results are more relevant in the regional context because El-Kassas et al. [42] and Bonnard et al. [43] found that FIB-4 is better than APRI at predicting fibrosis stages among Egyptian HCV patients. Despite differences in cut-off levels between investigations, the evidence, particularly from comparable groups, supports the therapeutic importance and dependability of FIB-4.
Based on ROC curve analysis, this study confirmed the high predictive power of FIB-4 and APRI scores in determining the phases of liver fibrosis in juvenile HCV patients. With FIB-4 and APRI scores of 0.988 and 0.863, respectively, AUC was markedly enhanced, indicating high sensitivity, specificity, and overall diagnostic accuracy. Particularly when liver biopsy is not feasible or appropriate, the results corroborate the growing body of literature on the validity of non-invasive markers for fibrosis staging. Kayadibi et al. [30] conducted a study that corroborates these findings, indicating that APRI demonstrates good diagnostic performance for cirrhosis, though it is less reliable for significant fibrosis. The study demonstrated that restricting liver biopsies to patients with intermediate APRI values may significantly reduce the occurrence of unnecessary procedures. Taneja et al. [39] found that APRI exhibited high sensitivity but low specificity in diagnosing significant fibrosis (AUROC = 0.77) and demonstrated improved performance in predicting cirrhosis (AUROC = 0.82). The FIB-4 index demonstrated high specificity and moderate sensitivity in their study, achieving an AUROC of 0.90 for cirrhosis, thereby supporting our conclusion of high diagnostic accuracy for FIB-4. The findings of El-Kassas et al. [42] support the enhanced efficacy of FIB-4 compared to APRI in forecasting advanced fibrosis and cirrhosis, despite minor variations in their suggested cutoff values. The study indicated that a FIB-4 cutoff greater than 3.25 demonstrated high specificity for advanced fibrosis, whereas lower thresholds exhibited effective exclusion capabilities. The diagnostic performance in their cohort, characterized by a predominance of intermediate fibrosis, was marginally lower than our findings. The unequal distribution of fibrosis stages or variations in inflammatory activity could be the cause of this disparity. Studies by Vallet‐Pichard et al. [44], Sterling et al. [45], and Bota et al. [46], with AUROC values ranging from 0.76 to 0.91, corroborate the diagnostic validity of FIB-4, particularly with regard to advanced fibrosis. Omran et al. [47] and Güzelbulut et al. [48], on the other hand, only reported moderate accuracy for both APRI and FIB-4. This seems to indicate that, depending on the fibrosis stage and the scoring method used, APRI may have a higher positive predictive value than negative predictive value.
Contrasting findings exist, however. Omran et al. [47] found reduced AUROC values for both scores in the prediction of significant fibrosis. In contrast, Rungta et al. [49] and Yen et al. [38] suggested alternative cutoff values, indicating variations specific to the population studied. Shaheen et al. [50] indicated that APRI was more effective in identifying significant fibrosis than in excluding it, contrasting with findings from Lin et al. [41], who recommended standardized cutoff values with moderate diagnostic accuracy.
Although there is variation in reported cutoff values and diagnostic accuracy among various groups, the evidence generally suggests that APRI and FIB-4 are non-invasive alternatives to liver biopsy, especially for cirrhosis and advanced fibrosis. Variations in the distribution of fibrosis stages, biochemical variability, or the grading systems used can all lead to discrepancies. The current study’s findings are backed up by a wealth of research showing the clinical usefulness and dependability of FIB-4 and APRI in the non-invasive evaluation of liver fibrosis.
Strengths and limitations of the study
Worldwide, no research has looked at the APRI and FIB-4 scores for identifying fibrosis in children with HCV. However, the study had limitations because of the limited sample size, which may constrain how broadly the results could be applied. The study was carried out in only one location. The fluctuation of transaminase levels may be impacted by concurrent inflammatory activity, which could impact the effectiveness of FIB-4 and APRI scores.
Conclusions
According to the findings of our study, children with chronic HCV infection can be diagnosed with high diagnostic accuracy using both FIB-4 and APRI scores to determine the stage of liver fibrosis. As an effective non-invasive tool for fibrosis assessment, the FIB-4 index showed excellent performance, with high sensitivity, specificity, and overall accuracy. The results show that FIB-4 and APRI are safe and practical substitutes for liver biopsies, particularly in pediatric patients, for whom invasive procedures carry higher risks.







