
Purpose
Radiation therapy that is delivered by combining external beam radiotherapy (EBRT) and brachytherapy is a curative treatment option for uterine cervical cancer and is the standard therapy for a locally advanced disease [1,2,3,4,5,6,7,8,9]. Radiation therapy with a high-dose-rate (HDR) remote afterloading system for intracavitary brachytherapy is the standard treatment for uterine cervical cancer in Japan [10].
Two orthogonal X-ray images were used for conventional brachytherapy planning based on the Manchester method. The dose was prescribed to point A, which was defined as 2 cm lateral to the central uterine canal and 2 cm from the mucous membrane of the lateral fornix in the axis of the uterus. On the other hand, point B, which was designated as 5 cm from the midline at the level of point A, represented the dose delivered to the pelvic lymph node, and was routinely recorded to calculate the integral dose to the pelvic sidewall delivered by EBRT and brachytherapy [11]. However, with the advent of three-dimensional (3D) image-guided brachytherapy (IGBT), the evaluation of dose distributions to assess the target coverage and to spar normal tissue has become possible [12,13]. Structures of interest can be more accurately evaluated with the dose volume histogram (DVH). The gynecologic GEC-ESTRO (Groupe Europeen de Curietherapie and the European Society for Radiotherapy and Oncology) Working Group has published guidelines on 3D image-based treatment planning for cervical cancer brachytherapy [12,13]. A previous study showed that while using IGBT, the clinical outcome presented an increase in local control and an approximately 20% decrease in toxicity compared with the 2D brachytherapy technique [14]. Derks et al. indicated that the 3D IGBT showed a trend for improved local control and overall survival compared to the 2D technique, and resulted in a decrease in observed toxicity from 17% (2D) to 12% (3D IGBT) [15]. Paul et al. reported a relative improvement in organs at risk (OAR) doses per HDR brachytherapy fraction by the volume-based HDR brachytherapy plan compared to the point A-based HDR brachytherapy plan, and described dosimetric advantages of using a volume-based HDR brachytherapy plan to create more conformal plans [16]. Moreover, Lee et al. examined the relationship between the point B dose and the dose delivered to the pelvic nodal chains, and indicated that the point B dose was a poor surrogate for the dose to specific nodal groups [11]. The relationship between the point B dose and the dose delivered to the pelvic lymph node region has been reported in several studies [11,17], but these studies did not analyze the anatomical position of point B on a 3D view. In this study, we investigated the anatomical position of point B and the relationship between the point B dose and the dose delivered to the pelvic lymph nodes in computed tomography (CT)-based HDR brachytherapy for cervical cancer.
Material and methods
From February 2013 to January 2016, forty-nine patients with the International Federation of Gynecology and Obstetrics (FIGO) stage IB-IVB cervical cancer were treated at the Kyushu University Hospital. A tandem and ovoid applicator was used in 39 cases and a cylinder applicator was used in 10 cases. For all cases, CT images were obtained after applicator insertion for planning on a Plato treatment planning system (Elekta AB, Stockholm, Sweden). In our institutes, CT images were routinely obtained only after the initial applicator insertion to assess applicator position and dose distribution of the conventional 2D plan, before IGBT was introduced. This planning study is a retrospective analysis of the patient data when the conventional 2D plan was implemented. Therefore, we used the initial planning CT image per patient, not per fraction.
The initial planning CT images were imported to the treatment planning system Oncentra Brachy (Elekta AB, Stockholm, Sweden), and we reperformed the treatment planning again based on the Manchester method. A dose of 6 Gy was prescribed to point A with a standard dwell weight pattern [18], and point B was set according to the Manchester method.
The pelvic lymph node regions (the external iliac, internal iliac, and obturator) were contoured as in the previous reports [11,19] by a radiation oncologist on the basis of CT images, using the pre-treatment MRI as a reference if necessary. The external iliac was contoured including the external iliac artery and vein, and a 7-mm vessel margin was set to encompass the medial, lateral, anterior, and posterior subgroups of the external iliac chain. This contour extended from the bottom of the sacroiliac joint superiorly to the top of the acetabulum inferiorly, along the iliopsoas muscle to include the lateral external iliac nodes and exclude the bones and muscles. The internal iliac node group included the internal iliac artery and vein. The contour began superiorly at the level of the sacroiliac joint and extended the roof of the acetabulum along the pelvic sidewall, like the external iliac chain. The obturator nodal contour extended from the fovea of the femoral head to the top of the acetabulum along the pelvic sidewall to exclude the muscle and OAR.
First, we examined where point B was located among the following five volumes: the obturator node region, external iliac node region, internal iliac node region, inside of the pelvis, and outside of the pelvis. The inside of the pelvis was defined as an area in the pelvic cavity excluding the lymph node regions, and the outside of the pelvis was defined as the area of the pelvic bone and the region external to that. The DVH parameters were calculated for each pelvic lymph node group (left, right, and bilateral), and represented the doses received by 100%, 90%, and 50% of the volume (D100, D90, D50) and the doses received by 2 cc, 1 cc, and 0.1 cc of tissue (D2cc, D1cc, D0.1cc), respectively. The dose administered to point B was compared with the DVH parameters for each pelvic lymph node group. An 192Ir source was used for the calculations in the treatment planning system. Additionally, DVH parameters for each lymph node region and point B dose were compared by applicator type (tandem and ovoid in 39 cases, tandem and cylinder in 10 cases).
For statistical analysis, JMP Pro13 software (SAS Institute Inc., Cary, NC, USA) was used, and the point B dose was compared with the DVH parameters for each lymph node group using a two-sided paired t-test. In order to examine the relationship between the point B dose and the DVH parameters, Pearson’s correlation coefficients (CCs) were used. The comparison of DVH parameters and point B dose by applicator type was performed using a t-test. Statistical significance was accepted with a p value < 0.05.
Results
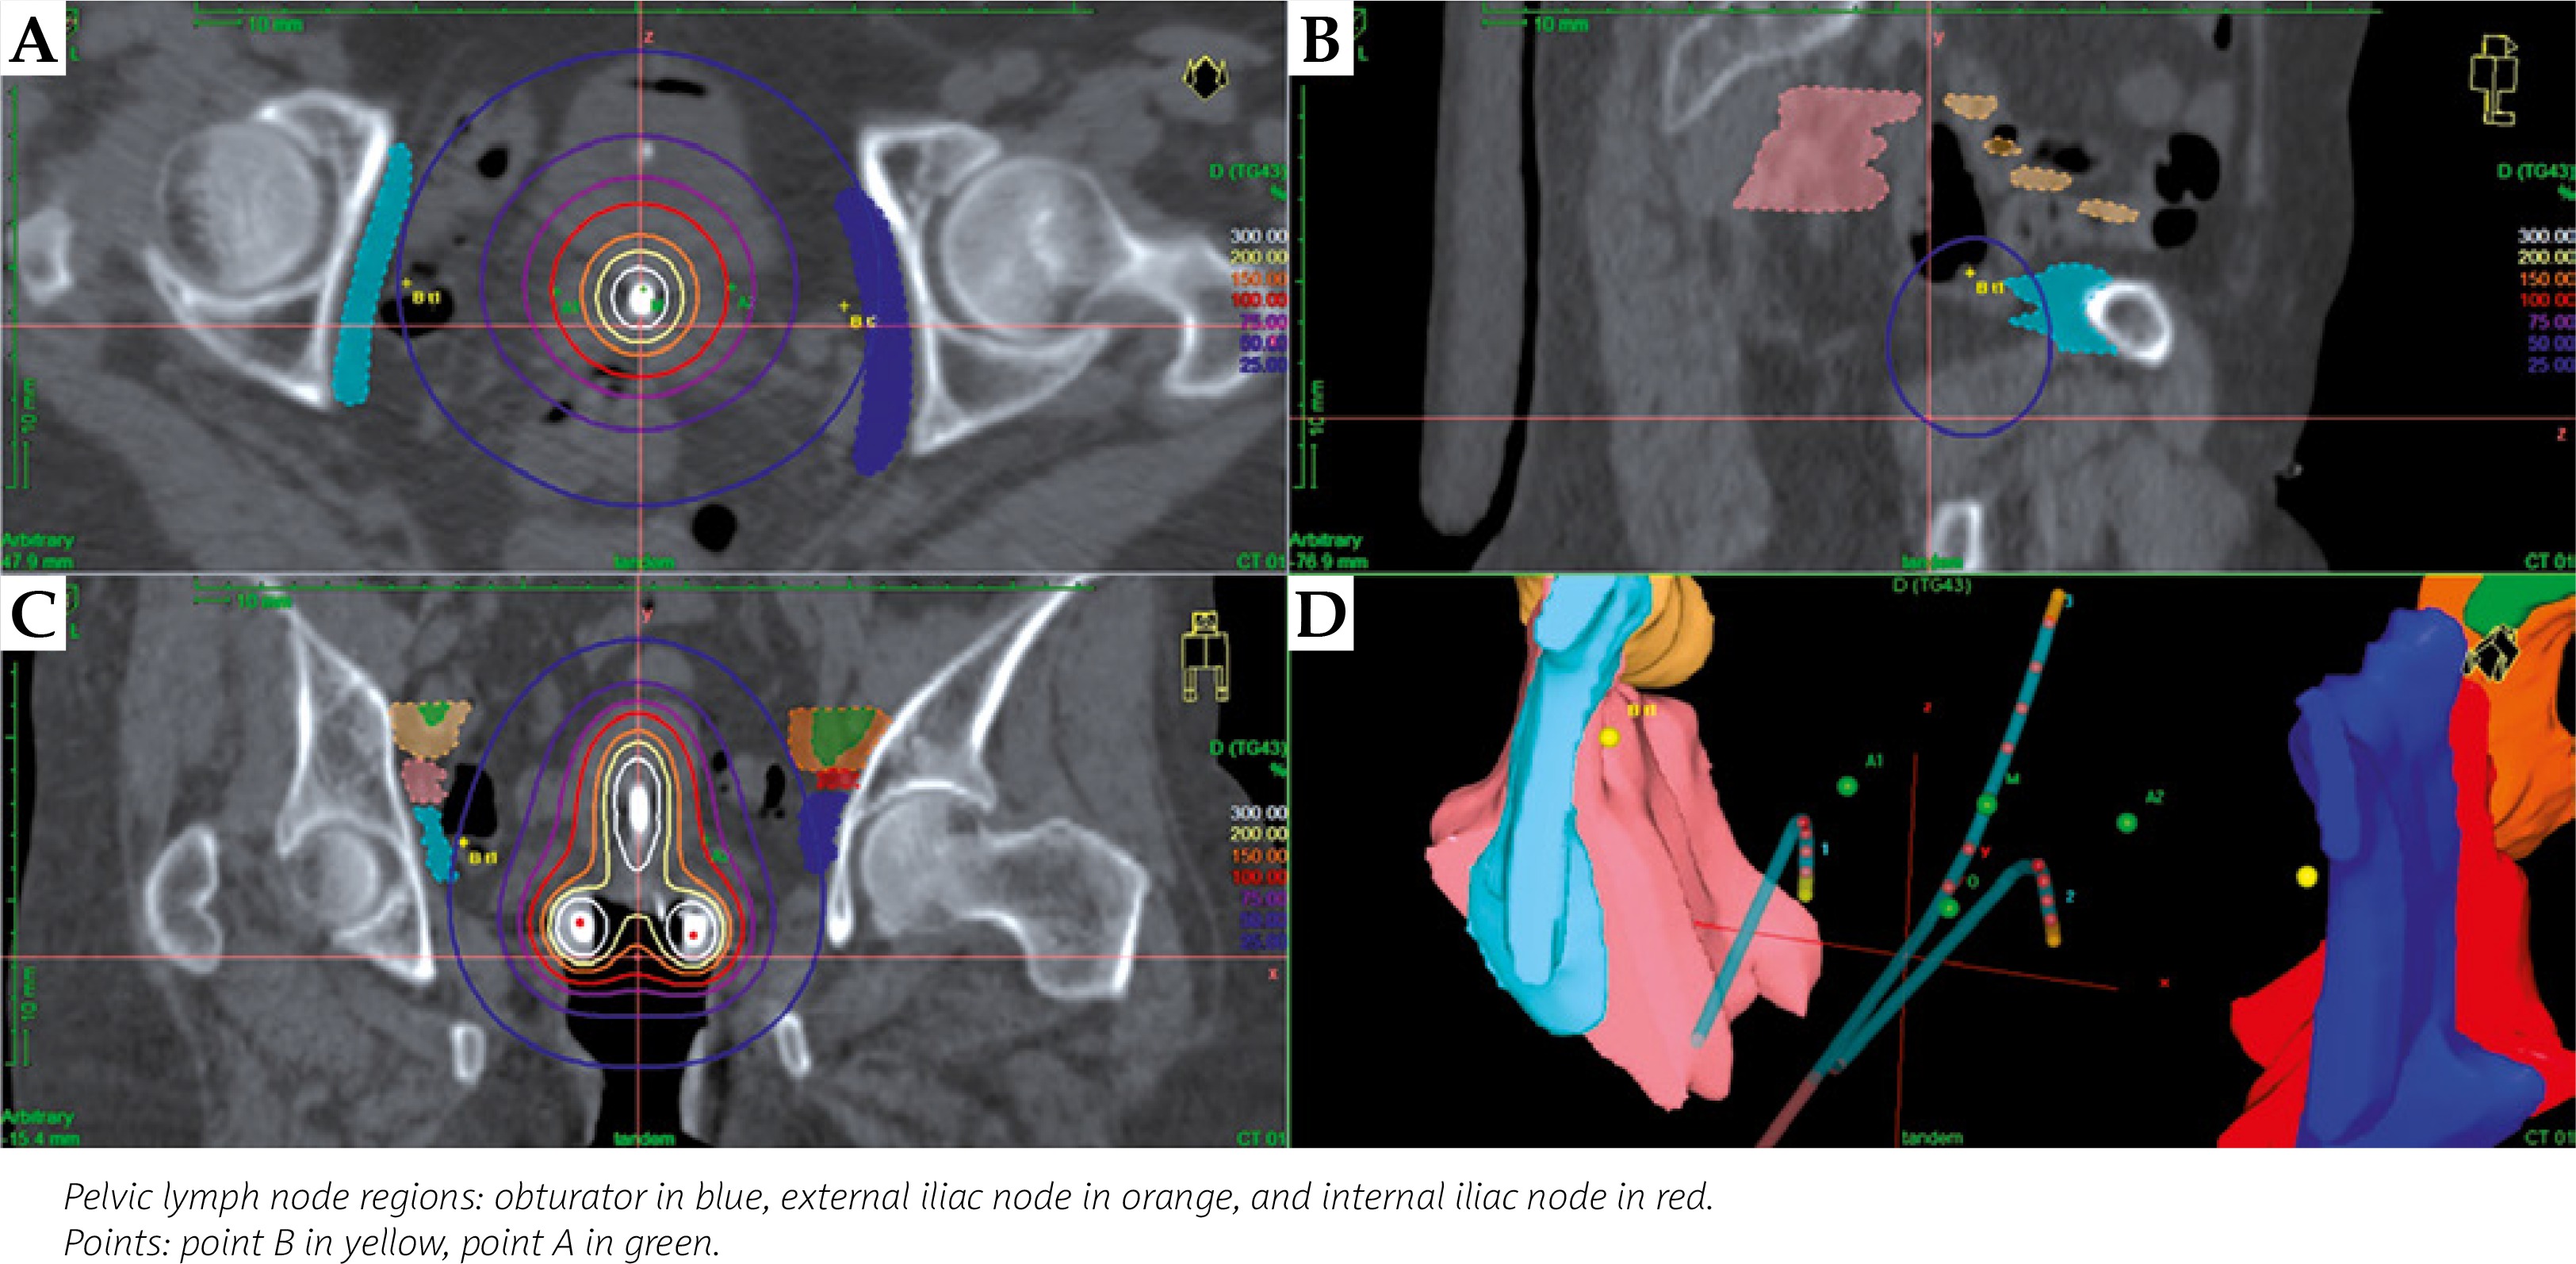
The patient and tumor characteristics are shown in Table 1. The median patient age was 62 years (range, 32-92 years) and of the 49 patients, 3 had FIGO stage IB, 3 had IIA, 17 had IIB, 2 had IIIA, 18 had IIIB, 2 had IVA, and 4 had IVB. The results for the anatomical position of point B are summarized in Table 2 and Figure 1. Seventy-two (73%) of 98 points B (2 points per patient) were located in the pelvic lymph node regions. Fifty-two percent of bilateral points B were in the obturator node region, and 21% were in the internal iliac node region. Twenty percent and 6% of points B were inside and outside of the pelvis, respectively. No point was located in the external iliac chain in this study (49 patients). Figures 2 and 3 shows the pelvic lymph node volumes and the point B in relation to the dose distribution in a typical patient, where the point B is located in the pelvic lymph node region and in a typical patient, where the point B is not located in the pelvic lymph node region, respectively.
Table 1
Patient and tumor characteristics
| Patients (n = 49) | |
|---|---|
| Age (years) | |
| Median | 62 |
| Range | 32-92 |
| FIGO stage | |
| IB | 3 |
| IIA | 3 |
| IIB | 17 |
| I IIA | 2 |
| IIIB | 18 |
| IVA | 2 |
| IVB | 4 |
Table 2
The anatomical location of point B for 49 cervical cancer patients
Fig. 1
Contoured pelvic lymph node regions and the percentage values of the anatomical location of point B on CT image. A) The axial plane, on which the external and internal iliac nodes are observed; B) The axial plane, on which the obturator is observed; C) The sagittal plane; D) The coronal plane; E) 3D view
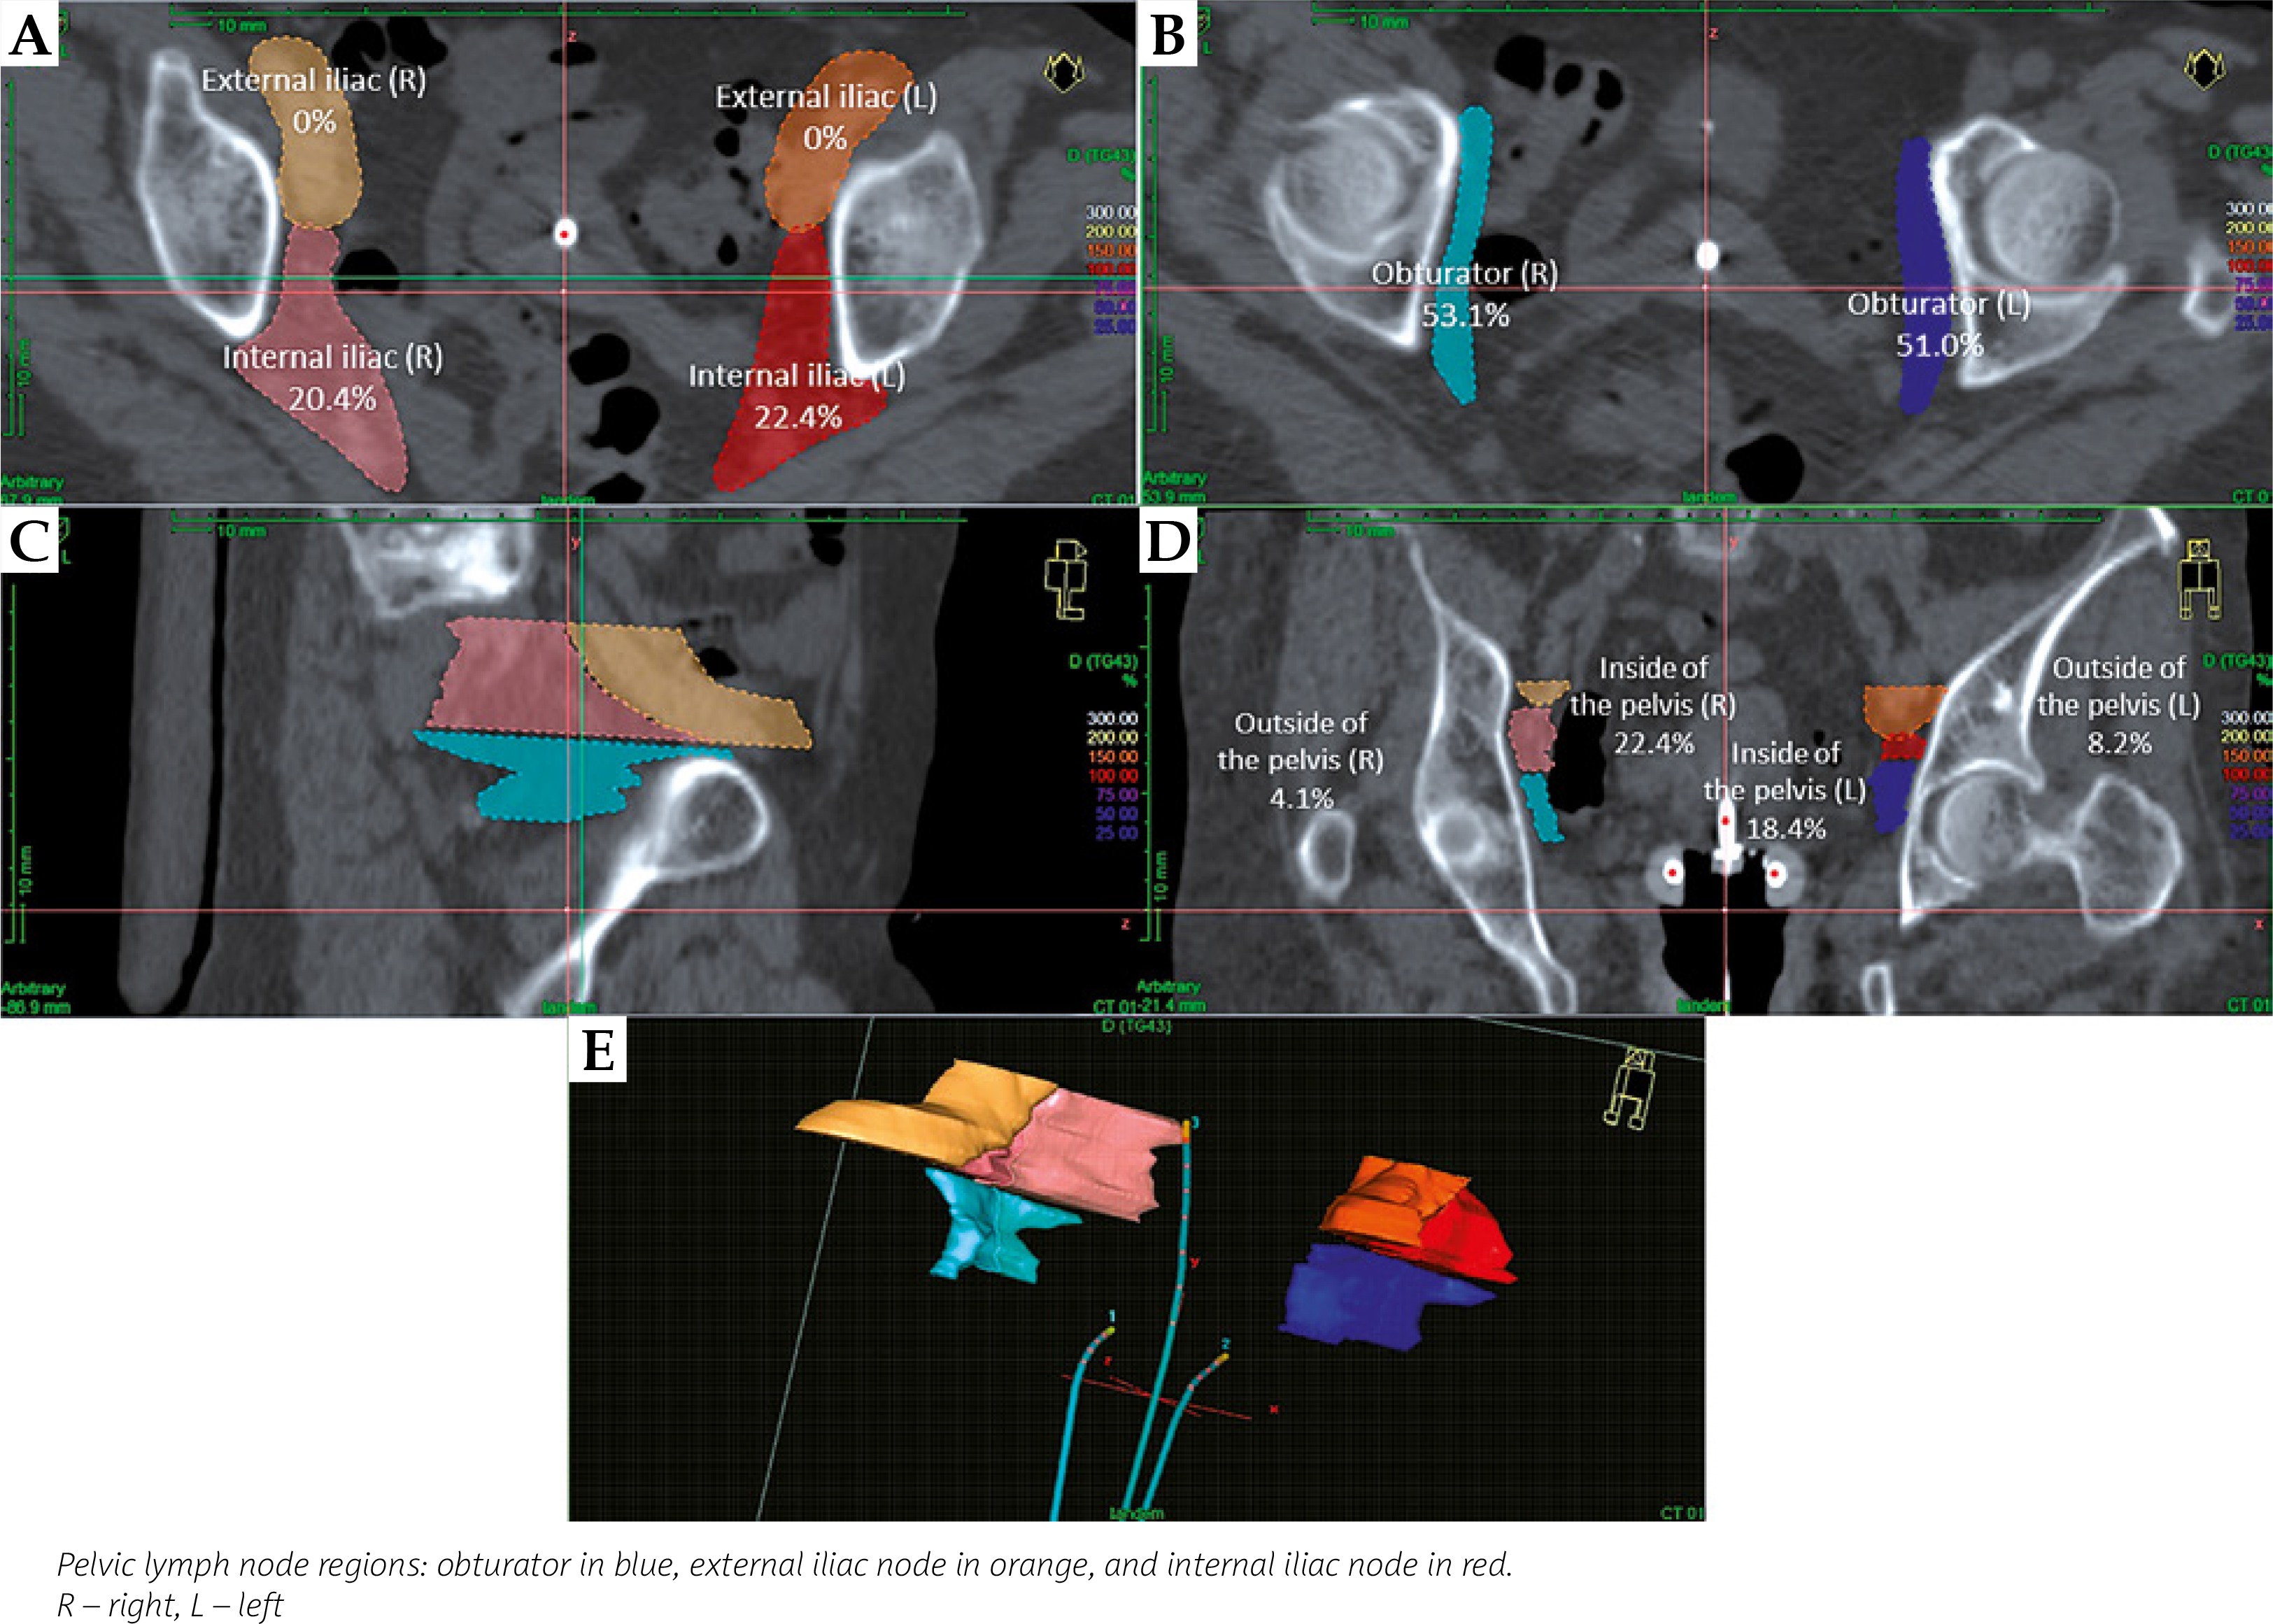
Fig. 2
The pelvic lymph node volumes and point B in relation to the dose distribution, in a typical patient, where point B is located in the pelvic lymph node region. A) Axial plane; B) Sagittal plane; C) Coronal plane; D) 3D view
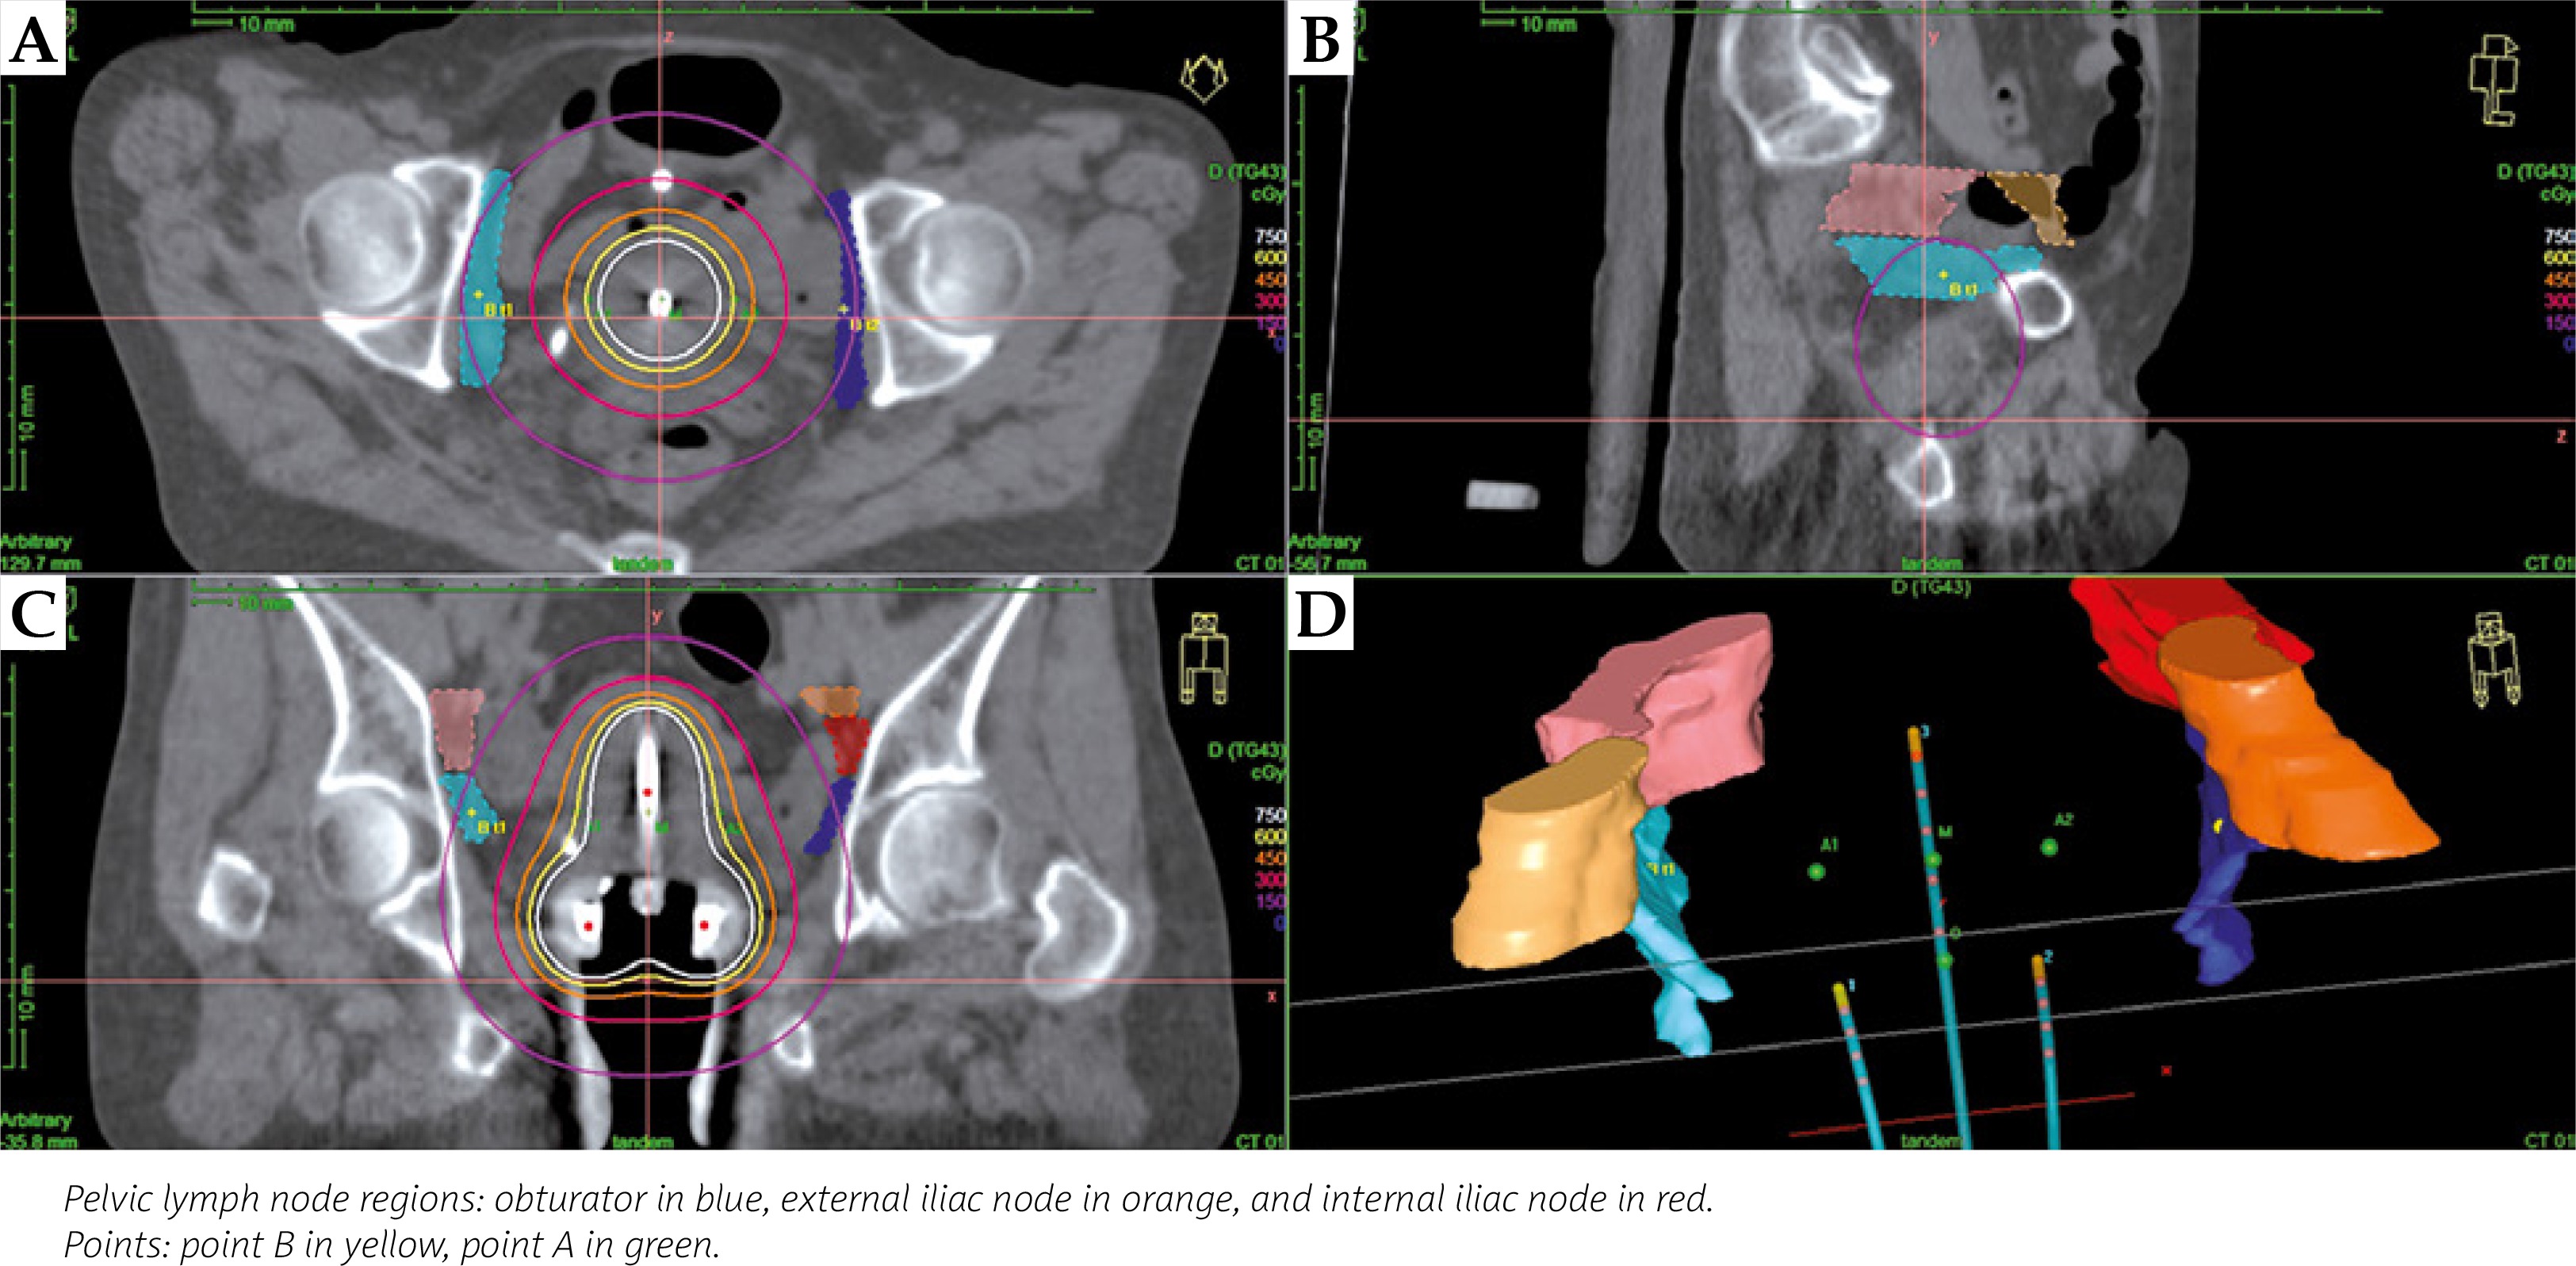
Fig. 3
The pelvic lymph node volumes and the point B in relation to the dose distribution, in a typical patient, where the point B is not located in the pelvic lymph node region. A) Axial plane; B) Sagittal plane; C) Coronal plane, D) 3D view
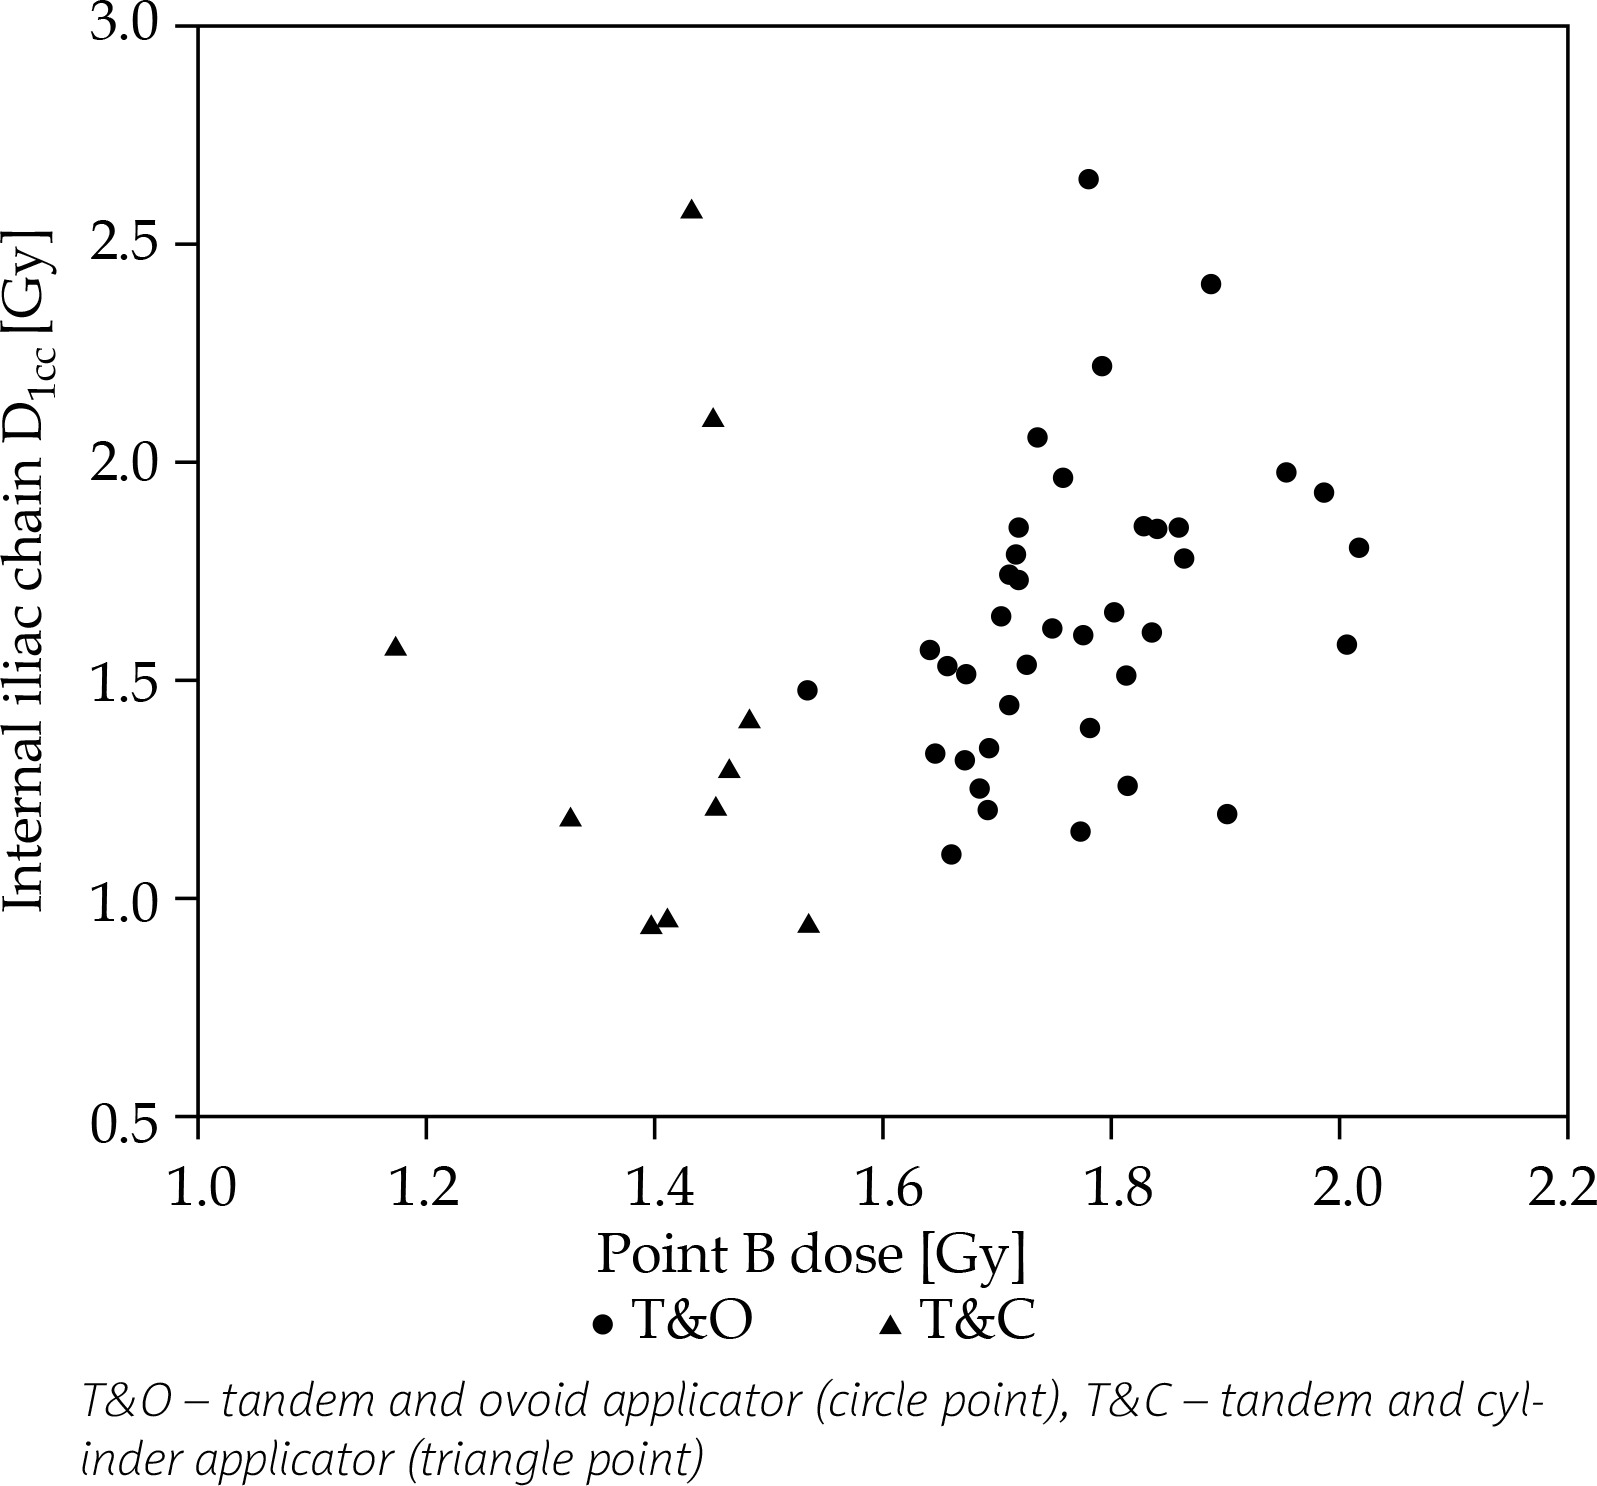
For 49 applications, the mean bilateral dose to point B was 1.70 ±0.18 Gy (right dose, 1.64 ±0.34 Gy; left dose, 1.76 ±0.35 Gy). The DVH parameters (D100, D90, D50, D2cc, D1cc, and D0.1cc) for the pelvic lymph node groups and the statistical analysis results are shown in Table 3. The CCs were less than 0.7, except for D50 of the obturator lymph node group (CC, 0.73) (bilateral), and the results indicated a low degree of correlation overall. All parameters of the obturator, D100, D90, D50, D2cc, and D1cc of the external iliac node and D100, D90, D50, D2cc, and D0.1cc of the internal iliac node were significantly different from the point B doses. However, D0.1cc of the external iliac node group and D1cc of the internal iliac node group were not statistically different from the point B doses. For the obturator group, the mean D50 was 1.47 ±0.28 Gy (t-test, p < 0.0001), and the CC for D50 of the obturator was only slightly more than 0.7 (CC, 0.73, p < 0.0001). However, all DVH parameters were significantly different from the point B dose. The DVH parameter of the obturator that most closely represented the point B dose was D2cc, and the mean value was 1.81 ±0.35 Gy (t-test, p = 0.0089) with a CC of 0.68 (p < 0.0001). In this study, we found that the point B doses were not adequate surrogates for the DVH parameters of the obturator group. For the external iliac chain, the mean D0.1cc was 1.60 ±0.37 Gy (p = 0.0594), and the CC was 0.32 (p = 0.0236) (Figure 4). The D100, D90, D50, D2cc, and D1cc were statistically different from the point B dose (t-test, p < 0.0001). For the internal iliac chain, the mean D1cc was 1.60 ±0.39 Gy (t-test, p = 0.0711), and this parameter alone did not indicate a significant difference. The CC of D1cc was 0.33 (p = 0.0223) (Figure 5). The D100, D90, D50, D2cc, and D0.1cc for the internal iliac chain were statistically different from the point B dose. The mean uterine length and separation between ovoids were 61.6 mm (range, 41.1-83.4 mm) and 32.1 mm (range, 22.6-42.1 mm), respectively. The correlation between these values and the doses delivered to pelvic lymph node regions was analyzed. The separation between ovoids did not correlate with the doses to pelvic lymph nodes significantly; however, we found the positive significant correlation between the uterine length and the doses to the external iliac node.
Table 3
The DVH parameters (D100, D90, D50, D2cc, D1cc, and D0.1cc) for pelvic lymph node groups and correlation coefficients between these parameters and point B dose
| Bilateral mean dose (Gy) | CC1 | p value2 | t-test3 | Percentage4 (%) | |
|---|---|---|---|---|---|
| Obturator node group | |||||
| D1005 | 0.65 ±0.17 | 0.60 | < 0.0001 | < 0.0001 | 10.8 ±2.87 |
| D906 | 1.07 ±0.22 | 0.66 | < 0.0001 | < 0.0001 | 17.8 ±3.74 |
| D507 | 1.47 ±0.28 | 0.73 | < 0.0001 | < 0.0001 | 24.5 ±4.61 |
| D2cc8 | 1.81 ±0.35 | 0.68 | < 0.0001 | 0.0089 | 30.1 ±5.87 |
| D1cc9 | 1.95 ±0.38 | 0.66 | < 0.0001 | < 0.0001 | 32.4 ±6.37 |
| D0.1cc10 | 2.27 ±0.45 | 0.64 | < 0.0001 | < 0.0001 | 37.9 ±7.56 |
| External iliac nodes | |||||
| D100 | 0.29 ±0.10 | 0.55 | < 0.0001 | < 0.0001 | 4.80 ±1.62 |
| D90 | 0.59 ±0.15 | 0.56 | < 0.0001 | < 0.0001 | 9.82 ±2.55 |
| D50 | 0.90 ±0.22 | 0.52 | 0.0001 | < 0.0001 | 14.9 ±3.66 |
| D2cc | 1.24 ±0.31 | 0.41 | 0.0037 | < 0.0001 | 20.7 ±5.16 |
| D1cc | 1.35 ±0.34 | 0.38 | 0.0069 | < 0.0001 | 22.5 ±5.59 |
| D0.1cc | 1.60 ±0.37 | 0.32 | 0.0236 | 0.0594 | 26.7 ±6.24 |
| Internal iliac nodes | |||||
| D100 | 0.49 ±0.14 | 0.47 | 0.0006 | < 0.0001 | 8.22 ±2.31 |
| D90 | 0.81 ±0.19 | 0.43 | 0.0021 | < 0.0001 | 13.5 ±3.19 |
| D50 | 1.08 ±0.25 | 0.39 | 0.0054 | < 0.0001 | 18.0 ±4.11 |
| D2cc | 1.49 ±0.36 | 0.33 | 0.0198 | < 0.0001 | 24.8 ±6.04 |
| D1cc | 1.60 ±0.39 | 0.33 | 0.0223 | 0.0711 | 26.7 ±6.49 |
| D0.1cc | 1.89 ±0.45 | 0.29 | 0.0396 | 0.0043 | 31.5 ±7.55 |
| Point B dose | 1.70 ±0.18 | 28.3 ±2.98 | |||
Fig. 4
Correlation between the point B dose and D0.1cc of the external iliac chain (CC, 0.32). The scatter-plot points were categorized into two forms by the applicator type
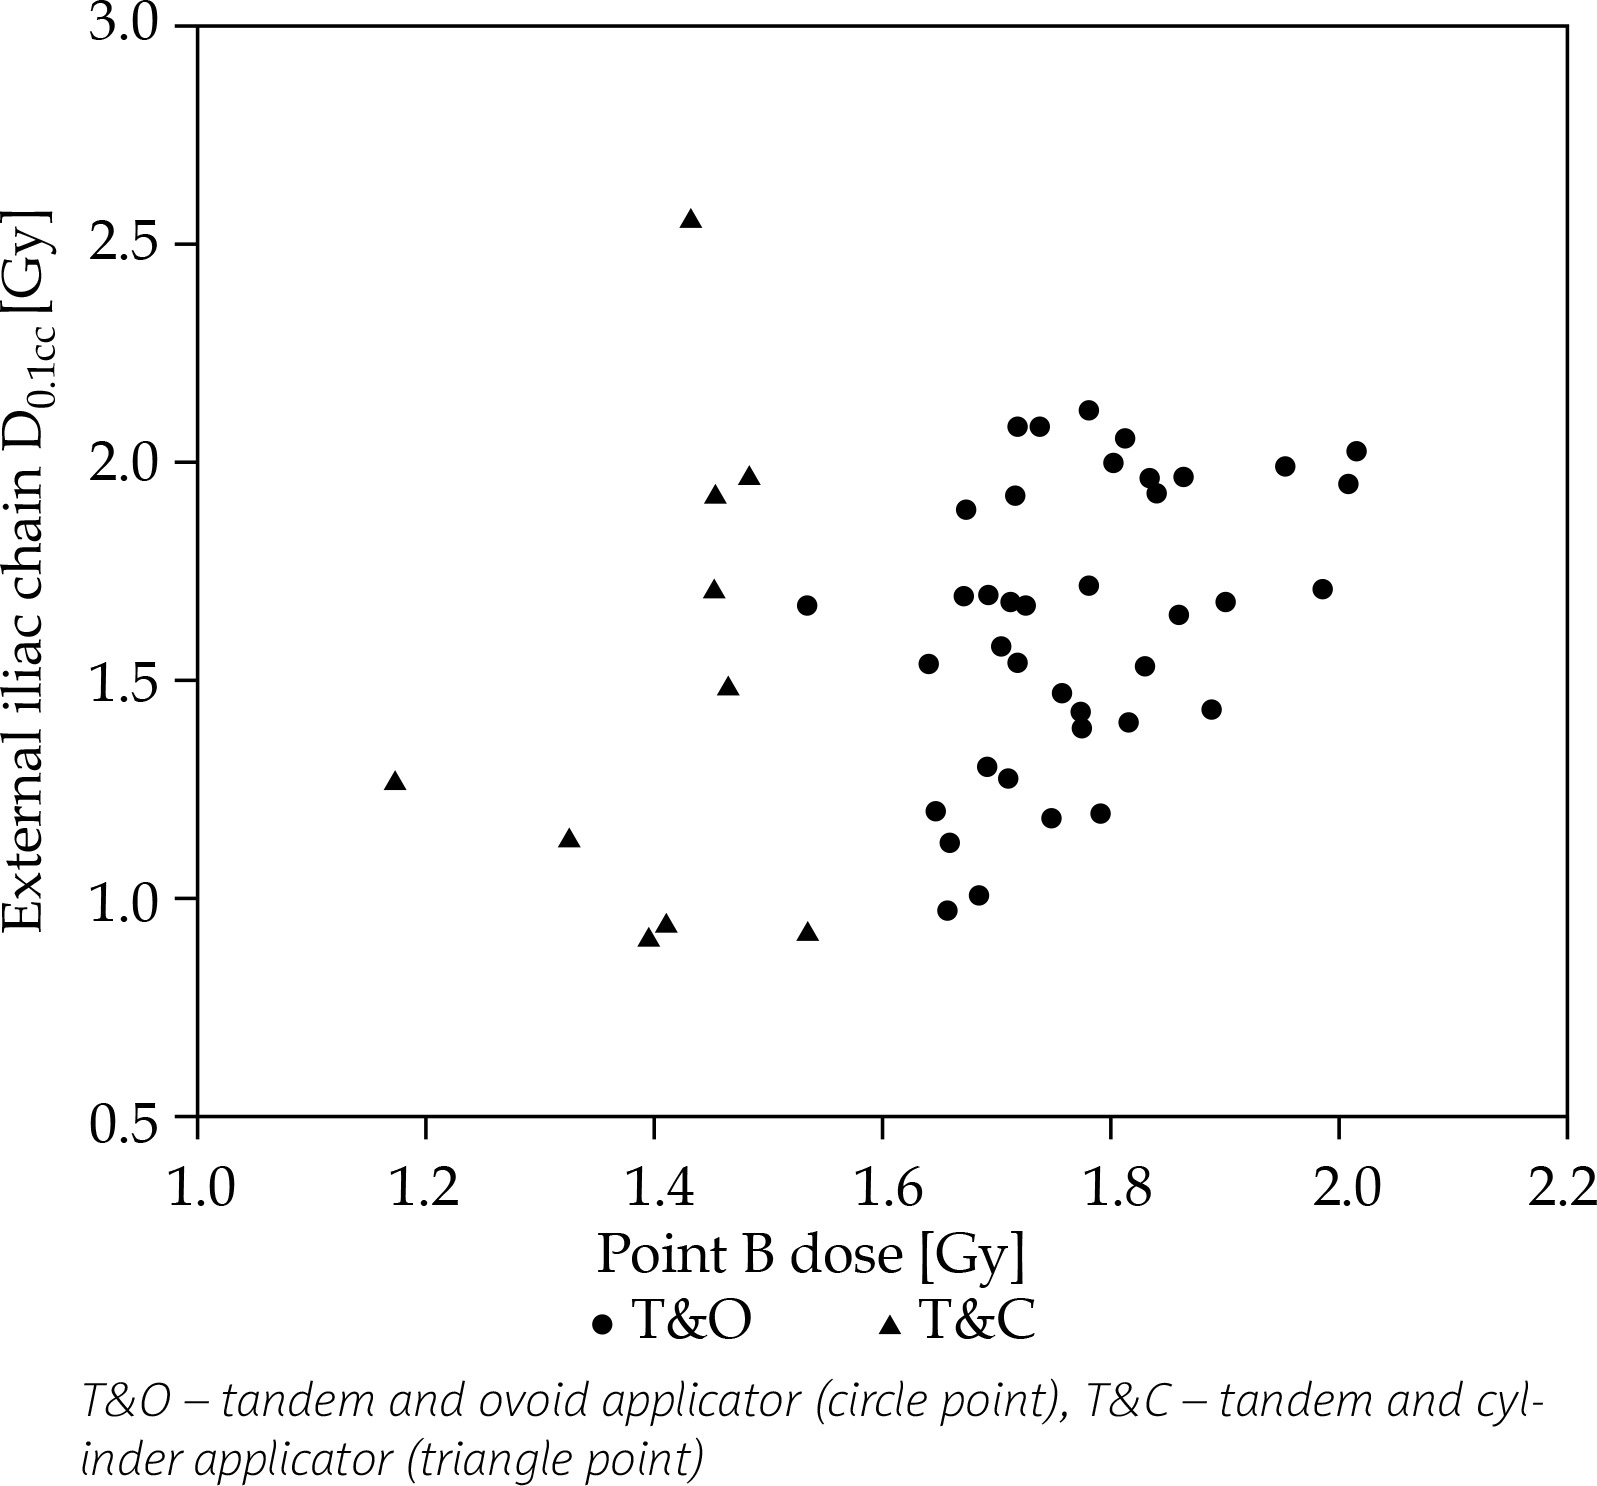
Fig. 5
Correlation between the point B dose and D1cc of the internal iliac chain (CC, 0.33). The scatter-plot points were categorized into two forms by the applicator type
In addition, Table 4 shows the comparison of DVH parameters for each lymph node region and point B dose by applicator type, including 39 tandem and ovoid and 10 tandem and cylinder applicators. The dose to the obturator nodes was lower 0.27-0.67 Gy for the tandem and cylinder applicator when compared by a t-test, although there was not such a significant difference for the external iliac nodes and the internal iliac nodes. We also analyzed the correlation between point B dose and the dose delivered to the pelvic lymph node regions by applicator type. However, we could not find a significant correlation between point B dose and the dose delivered to the pelvic lymph node regions in tandem and cylinder applicator cases, probably because sample size of the cylinder applicator was small (Table 5).
Table 4
Comparison of DVH parameters for each nodal region and point B dose by applicator type
| T&O1 mean dose (Gy) n = 39 | T&C2 mean dose (Gy) n = 10 | Δ3 (Gy) | t-test4 | |
|---|---|---|---|---|
| Obturator node group | ||||
| D1005 | 0.70 ±0.14 | 0.43 ±0.11 | 0.27 | < 0.0001 |
| D906 | 1.15 ±0.17 | 0.76 ±0.13 | 0.39 | < 0.0001 |
| D507 | 1.57 ±0.20 | 1.08 ±0.18 | 0.49 | < 0.0001 |
| D2cc8 | 1.92 ±0.27 | 1.36 ±0.28 | 0.56 | < 0.0001 |
| D1cc9 | 2.07 ±0.30 | 1.48 ±0.29 | 0.59 | < 0.0001 |
| D0.1cc10 | 2.41 ±0.38 | 1.74 ±0.33 | 0.67 | < 0.0001 |
| External iliac nodes | ||||
| D100 | 0.31 ±0.09 | 0.20 ±0.07 | 0.11 | 0.0005 |
| D90 | 0.62 ±0.13 | 0.45 ±0.15 | 0.17 | 0.001 |
| D50 | 0.94 ±0.20 | 0.74 ±0.24 | 0.20 | 0.0097 |
| D2cc | 1.28 ±0.27 | 1.09 ±0.39 | 0.19 | 0.0753 |
| D1cc | 1.39 ±0.29 | 1.20 ±0.43 | 0.19 | 0.1231 |
| D0.1cc | 1.63 ±0.32 | 1.48 ±0.52 | 0.15 | 0.2822 |
| Internal iliac nodes | ||||
| D100 | 0.52 ±0.12 | 0.40 ±0.17 | 0.12 | 0.0228 |
| D90 | 0.84 ±0.16 | 0.70 ±0.24 | 0.14 | 0.0433 |
| D50 | 1.11 ±0.21 | 0.96 ±0.32 | 0.15 | 0.0838 |
| D2cc | 1.53 ±0.31 | 1.32 ±0.48 | 0.21 | 0.0985 |
| D1cc | 1.65 ±0.34 | 1.42 ±0.51 | 0.23 | 0.1038 |
| D0.1cc | 1.94 ±0.39 | 1.71 ±0.60 | 0.23 | 0.162 |
| Point B dose | 1.77 ±0.11 | 1.41 ±0.10 | 0.36 | < 0.0001 |
Table 5
The DVH parameters (D100, D90, D50, D2cc, D1cc, and D0.1cc) for pelvic lymph node groups, and correlation coefficients between these parameters and point B dose by applicator type
| T&O1 (n = 39) | T&C2 (n = 10) | |||||||
|---|---|---|---|---|---|---|---|---|
| Bilateral mean dose (Gy) | CC3 | p value4 | t-test5 | Bilateral mean dose (Gy) | CC | p value | t-test | |
| Obturator node group | ||||||||
| D1006 | 0.70 ±0.14 | 0.19 | 0.2584 | < 0.0001 | 0.43 ±0.11 | 0.16 | 0.6495 | < 0.0001 |
| D907 | 1.15 ±0.17 | 0.21 | 0.2092 | < 0.0001 | 0.76 ±0.13 | 0.34 | 0.3364 | < 0.0001 |
| D508 | 1.57 ±0.20 | 0.33 | 0.0404 | < 0.0001 | 1.08 ±0.18 | 0.50 | 0.1437 | 0.0001 |
| D2cc9 | 1.92 ±0.27 | 0.33 | 0.0418 | 0.0013 | 1.36 ±0.28 | 0.48 | 0.1606 | 0.5475 |
| D1cc10 | 2.07 ±0.30 | 0.31 | 0.0541 | < 0.0001 | 1.48 ±0.29 | 0.51 | 0.1343 | 0.4922 |
| D0.1cc11 | 2.41 ±0.38 | 0.31 | 0.0576 | < 0.0001 | 1.74 ±0.33 | 0.52 | 0.1196 | 0.0078 |
| External iliac nodes | ||||||||
| D100 | 0.31 ±0.09 | 0.32 | 0.0461 | < 0.0001 | 0.20 ±0.07 | 0.26 | 0.4598 | < 0.0001 |
| D90 | 0.62 ±0.13 | 0.40 | 0.0106 | < 0.0001 | 0.45 ±0.15 | 0.24 | 0.5046 | < 0.0001 |
| D50 | 0.94 ±0.20 | 0.46 | 0.0034 | < 0.0001 | 0.74 ±0.24 | 0.22 | 0.5321 | < 0.0001 |
| D2cc | 1.28 ±0.27 | 0.41 | 0.0095 | < 0.0001 | 1.09 ±0.39 | 0.20 | 0.5725 | 0.0288 |
| D1cc | 1.39 ±0.29 | 0.41 | 0.0093 | < 0.0001 | 1.20 ±0.43 | 0.21 | 0.5644 | 0.1676 |
| D0.1cc | 1.63 ±0.32 | 0.41 | 0.0104 | 0.0044 | 1.48 ±0.52 | 0.21 | 0.5572 | 0.686 |
| Internal iliac nodes | ||||||||
| D100 | 0.52 ±0.12 | 0.51 | 0.001 | < 0.0001 | 0.40 ±0.17 | -0.0045 | 0.9902 | < 0.0001 |
| D90 | 0.84 ±0.16 | 0.46 | 0.0031 | < 0.0001 | 0.70 ±0.24 | 0.040 | 0.9132 | < 0.0001 |
| D50 | 1.11 ±0.21 | 0.46 | 0.0029 | < 0.0001 | 0.96 ±0.32 | -0.00021 | 0.9995 | 0.0028 |
| D2cc | 1.53 ±0.31 | 0.36 | 0.024 | < 0.0001 | 1.32 ±0.48 | -0.060 | 0.8699 | 0.5741 |
| D1cc | 1.65 ±0.34 | 0.36 | 0.026 | 0.0176 | 1.42 ±0.51 | -0.071 | 0.8453 | 0.9691 |
| D0.1cc | 1.94 ±0.39 | 0.35 | 0.031 | 0.0109 | 1.71 ±0.60 | -0.084 | 0.8175 | 0.1859 |
| Point B dose | 1.77 ±0.11 | 1.41 ±0.10 | ||||||
Discussion
The present study was carried out to evaluate the anatomical position of point B, and the relationship between the point B dose and the dose delivered to the pelvic lymph nodes in HDR brachytherapy for uterine cervical cancer according to the Manchester method. We found that 27% of points B were not located in any pelvic lymph node regions. For DVH analysis, the CCs were less than 0.7, except for the D50 of the obturator group. As in the previous study [11], we indicated that the DVH parameters were statistically different from the point B dose, and the pelvic lymph node contours defined the nodal dose more accurately than did point B. The two DVH parameters, i.e., the D0.1cc of the external iliac chain and the D1cc of the internal iliac chain, were not statistically different from the point B dose; however, the low CC of these parameters suggests that the point B dose was not a clinically significant surrogate for the dose delivered to the pelvic lymph nodes (Figures 4 and 5). We found a significant positive correlation between the uterine length and the doses to the external iliac node. This observation may have been caused by the location of the tandem, which was closer to the external iliac node region in the case of a long uterine.
Although the apparent pattern in the implant geometry was not established in this study (Figures 2 and 3), we found that 27% of points B were not located in any pelvic lymph node regions, which tended to be inside of the pelvis from the results of Table 2. Several studies have reported that Caucasians have a larger pelvic and iliac width than Japanese individuals [20,21]. The dose delivered to the pelvic lymph nodes may vary in relation to the difference in pelvic and iliac width between Japanese and Caucasians patients, although we cannot compare the dose parameters observed in our study with the previous data [11] simply because of the difference in the dose prescription and fraction. Given our results and the difference in pelvic width between Caucasians and Japanese [20,21], we consider that point B for Caucasians may be located relatively more inside the pelvis compared to that for Japanese. Hence, the dose to the pelvic lymph nodes should be estimated according to the anatomical pelvic size in the case of 2D conventional planning.
When the dose delivered to lymph nodes was analyzed by applicator type (Table 4), the DVH parameters for the tandem and ovoid applicator were higher than the tandem and cylinder applicator overall. Although there were significant differences between the two applicator types for D100, D90, and D50 of the external iliac nodes and D100 and D90 of the internal iliac nodes, the differences were smaller than that of the obturator, and D2cc, D1cc, and D0.1cc of the external iliac nodes and D50, D2cc, D1cc, and D0.1cc of the internal iliac nodes did not show significant differences. However, the dose to the obturator nodes was significantly lower by 0.27-0.67 Gy for the tandem and cylinder applicator than in case of the tandem and ovoid applicator when compared by a t-test. This observation may have been due to the location of the obturator node region, which was closer to the ovoid applicator than other lymph nodes.
For cervical cancer patients, who have enlarged nodal disease and receive an external-beam boost dose, the dose contribution to the pelvic lymph nodes from brachytherapy is very important. Lee et al. investigated the dose and equivalent dose contribution of HDR brachytherapy to metastatic pelvic lymph nodes in locally advanced cervical cancer patients [22]. They demonstrated that the brachytherapy dose accounted for about 7% of the total prescription boost dose to the lymph nodes. In addition, Mohamed et al. evaluated the dose delivered to the lymph nodes by brachytherapy and the effect of brachytherapy image-guided optimization on the lymph node dose. They mentioned that brachytherapy contributes a significant dose to the pelvic lymph nodes and should be considered in the evaluation of total lymph node doses. The dose was 4-6 Gy equivalent total dose in 2 Gy fractions (EQD2) for the obturator, external iliac nodes, and internal iliac nodes, when two fractions of MRI-guided pulsed-dose-rate (PDR) brachytherapy were delivered 1 week apart and each fraction was 20-hourly pulses. The brachytherapy plan optimization aimed to deliver a total EQD2 (EBRT plus brachytherapy) of at least 85 Gy to the high-risk clinical target volume (HR-CTV) D90, and to keep the D2cc for bladder below 90 Gy, and the D2cc of the rectum, sigmoid, and bowel below 70-75 Gy [23]. Bacorro et al. also analyzed the dose delivered to pelvic lymph nodes during brachytherapy. The planning objectives, summing EBRT plus PDR-IGBT in EQD2, consisted of HR-CTV D90 ≥ 85 Gy and the OAR dose constraints were 75 Gy, 75 Gy, and 85 Gy to D2cc of the rectum, sigmoid, and bladder, respectively. They reported brachytherapy contribution to the treatment of pelvic nodes at the level of approximately 5 Gy in the internal iliac, external iliac, and obturator nodes [24]. Chua et al. quantified the brachytherapy dose contribution to pelvic node groups using the Manchester method. They indicated that the mean cumulative EQD2 doses to the external iliac, the internal iliac, and the obturator nodes were 4.30 Gy, 5.95 Gy, and 7.09 Gy, respectively, in patients who received 6 Gy × 4 fractions [25]. Thus, the brachytherapy dose was reported to make a significant contribution in these studies, and the accurate evaluation of the dose delivered to the pelvic lymph nodes by brachytherapy is essential.
In this simulation study, we adopted only the standard loading pattern [18], and source dwell times were not optimized to minimize the dose to the OAR and maximize the coverage of the HR-CTV, because we used the previous conventional 2D plan data; this is a limitation of the present study. Three-dimensional IGBT was developed to ensure target coverage and avoid exposure to OAR [12,13]. However, in low-income countries, where the incidence of cervical cancer is high, 3D imaging is generally not available, and a non-optimized 2D plan is used instead [26,27,28]. Therefore, we consider that the findings of this study are important for resource-limited institutes that use the 2D plan.


