Summary
Myocardial scar is associated with adverse outcomes in patients with chronic total occlusion (CTO). Electrocardiography (ECG) is a simple and widely available tool that provides valuable information on myocardial ischaemia and scar. We aimed to evaluate the value of the ECG-derived total Q/R ratio for identifying myocardial scar in patients with CTO and ischaemia on myocardial perfusion scintigraphy (MPS). In this retrospective study, 283 consecutive patients with myocardial ischaemia on MPS and CTO on coronary angiography were included. Myocardial scar was defined as severe fixed perfusion defects on MPS. The total Q/R ratio and left ventricular ejection fraction (LVEF) were independently associated with myocardial scar in multivariate analysis (OR = 2.53, 95% CI: 1.13–5.63, p = 0.02; OR = 0.93, 95% CI: 0.89–0.97, p < 0.001; respectively). The total Q/R ratio demonstrated moderate discriminative ability for myocardial scar (AUC = 0.705, 95% CI: 0.639–0.770, p < 0.001), while LVEF showed higher discriminative performance (AUC = 0.779, 95% CI: 0.719–0.839, p < 0.001). The total Q/R ratio is independently associated with myocardial scar and may provide clinically relevant information for identifying myocardial scar in patients with CTO and ischaemia on MPS.
Introduction
Chronic total occlusions (CTOs) are noted in approximately 15–20% of patients with clinically significant coronary artery diseases [1, 2]. Although the benefits of CTO revascularisation remain controversial, successful percutaneous coronary intervention for CTO (CTO PCI) has been associated with better left ventricular (LV) function, higher quality of life, and increased survival [2–4]. Revascularisation is generally recommended when myocardial viability or ischaemia is present in the area supplied by the occluded artery [5]. Myocardial viability and ischaemia can be evaluated using various imaging tests, including dobutamine stress echocardiography, single-photon emission computed tomography (SPECT), positron emission tomography (PET), fractional flow reserve computed tomography (FFR-CT), and cardiac magnetic resonance imaging (CMR). Each method has specific advantages and drawbacks; their use may vary depending on local availability and expertise. When myocardial ischaemia > 10% and reversible perfusion defects are present, revascularisation is generally recommended [5–7]. Therefore, differentiating myocardial ischaemia from scar tissue plays a pivotal role in guiding revascularisation decisions.
The standard 12-lead electrocardiogram (ECG) is a simple, inexpensive, and widely available tool used in the initial evaluation of patients. It may also provide useful information regarding myocardial ischaemia and scar. Pathological Q waves are usually associated with transmural necrosis and myocardial scar [8, 9], while R-wave amplitude may change during ischaemia [10]. In addition, several ECG-derived parameters, including QT dispersion, T wave normalisation, and QRS score, have been reported to be associated myocardial viability and scar [11–13].
Aim
In this study, we aimed to evaluate the association and discriminative ability of the ECG-derived total Q/R ratio for identifying myocardial scar in patients with CTO and ischaemia on MPS.
Material and methods
Study design and population
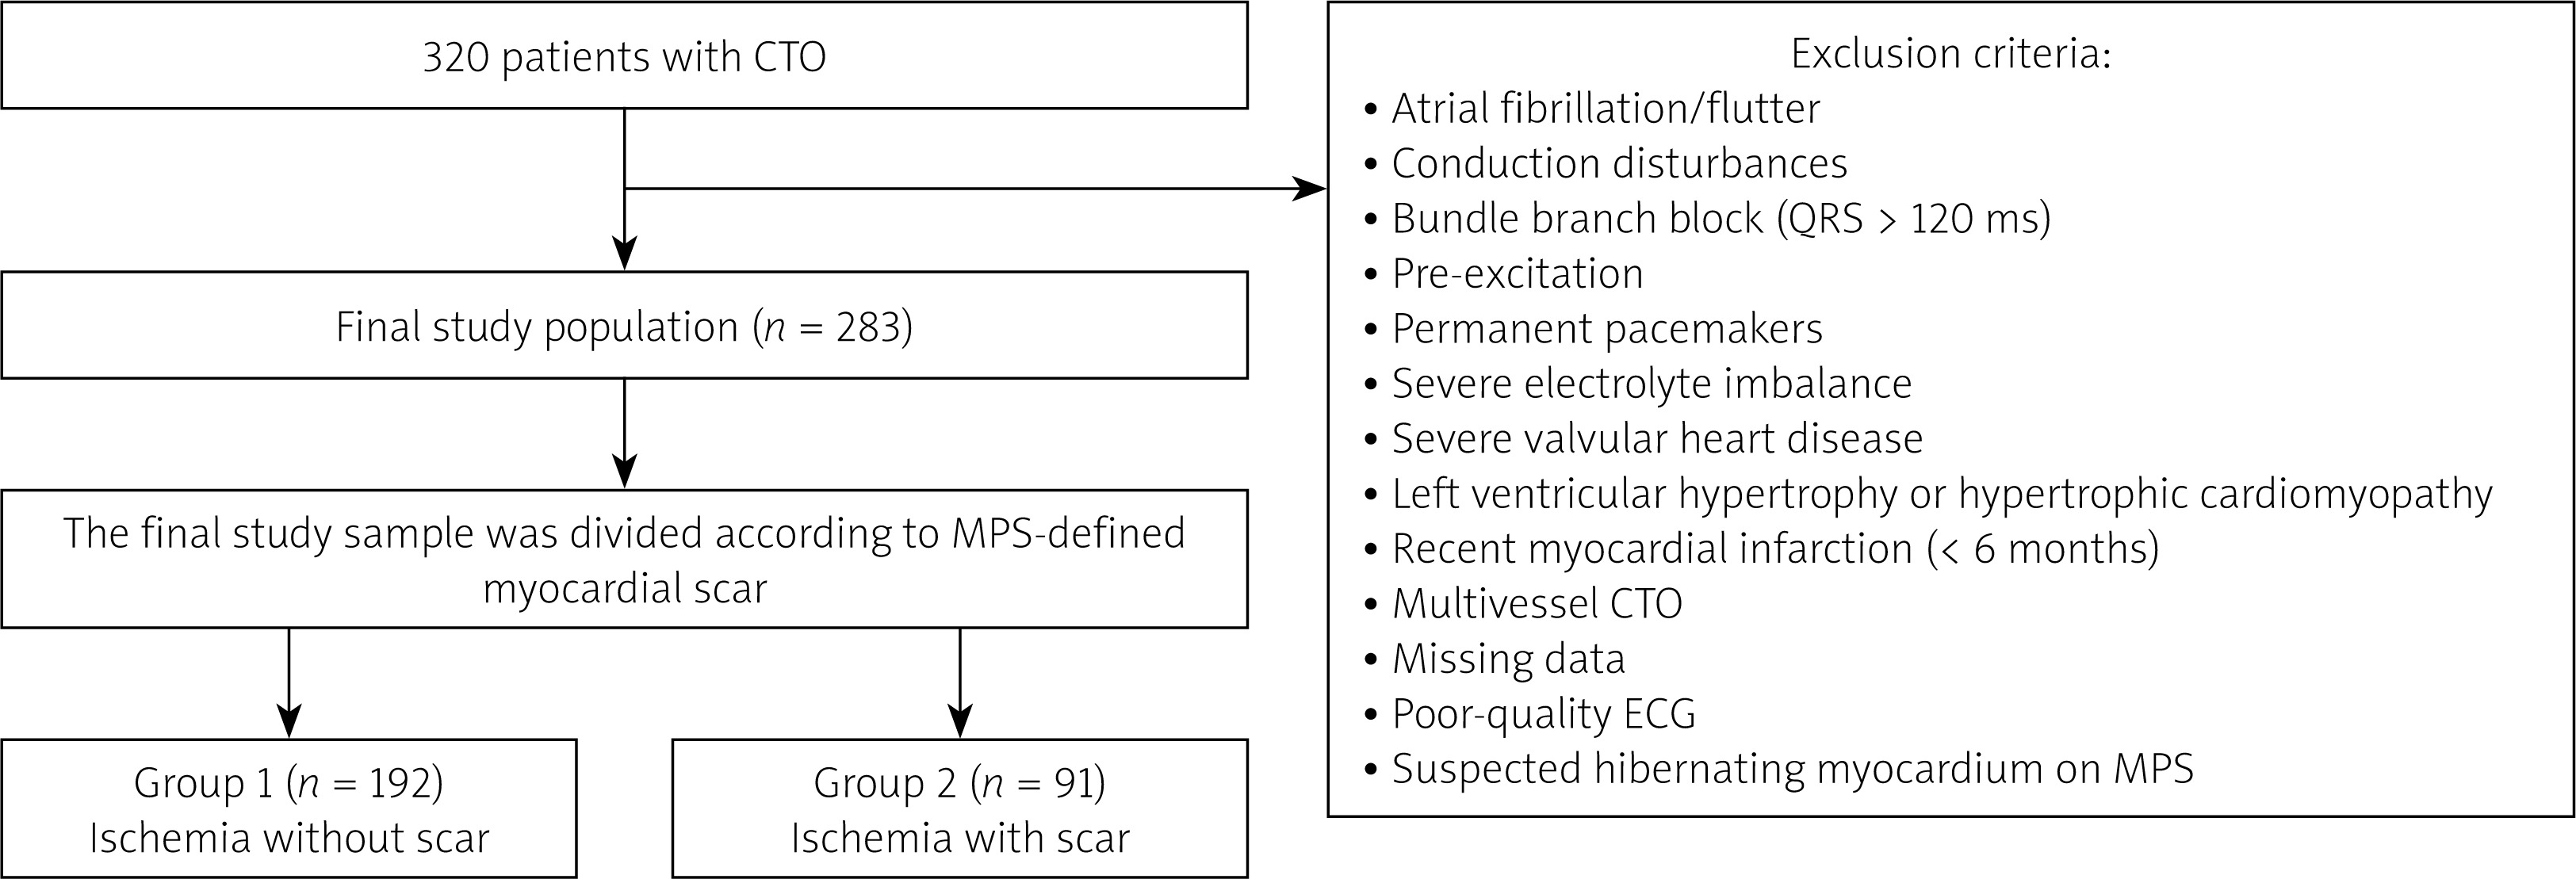
In this retrospective study, we evaluated the clinical data from 320 patients with myocardial ischaemia on myocardial perfusion scintigraphy (MPS) and CTO on coronary angiography at our tertiary centre between January 2018 and June 2023. Patients with atrial fibrillation or flutter, atrioventricular conduction disturbances, bundle branch block (QRS > 120 ms), pre-excitation, permanent pacemakers, severe electrolyte imbalance, severe valvular heart disease, left ventricular hypertrophy or hypertrophic cardiomyopathy, recent acute myocardial infarction (< 6 months), multivessel CTO, missing data, poor-quality ECG recordings, or suspected hibernating myocardium on MPS were excluded from the study. The remaining 283 patients constituted the study population (Figure 1). Age, sex, presence of hyperlipidaemia, diabetes mellitus, and prior coronary artery disease were recorded. Baseline demographic, clinical, laboratory, imaging, angiographic, and electrocardiographic characteristics were obtained from patients’ medical records. The study protocol was approved by the local institutional review board, and the requirement for written informed consent was waived due to the retrospective design of the study.
Definitions
Diabetes was defined according to patients’ medical history. Hyperlipidaemia was defined as a total cholesterol level of > 200 mg/dl, or low-density lipoprotein (LDL) level of > 116 mg/dl, or a triglyceride level of > 150 mg/dl, or the use of lipid-lowering drugs [14].
Echocardiography
Conventional two-dimensional echocardiography was performed according to the recommendations of the guideline, and the left ventricle ejection fraction (LVEF) was calculated using the biplane Simpson’s method [15].
Myocardial perfusion scintigraphy
A two-day protocol of 99mTc-sestamibi stress and rest imaging was performed. After a 6-hour period of fasting, patients underwent exercise treadmill testing for the stress study. An intravenous injection of 10–12 mCi (370–444 MBq) of 99mTc-sestamibi was administered at peak exercise, and the test was terminated 1 min after injection. The rest study was performed on the following day using a similar protocol. The SPECT images were obtained 15–60 min after the tracer injection using the IQ-SPECT Symbia S system (Siemens, USA) gamma camera with multifocal SMARTZOOMTM collimators. The SPECT tomograms were reconstructed by using an automated algorithm and processed with Cedars-Sinai quantitative perfusion SPECT (QPS) software [16]. Using a 2-day imaging protocol enhances the clarity of defect visualisation by minimising image contamination between sessions and reducing background activity. Myocardial ischaemia was defined as reversible perfusion defects on resting images, whereas persistent severe fixed perfusion defects were considered indicative of myocardial scar. Mild or moderate fixed defects were interpreted as possible hibernating myocardium [17, 18]. To ensure anatomical relevance, myocardial ischaemia and scar were specifically evaluated within the vascular territory of the CTO vessel. Accordingly, only segmental perfusion abnormalities corresponding to the CTO-related coronary distribution (anterior for LAD, inferior for RCA, and lateral for CX) were included in the analysis. Patients with mild or moderate fixed defects on MPS, those with a history of acute myocardial infarction within the previous 6 months, and those with multivessel CTO were excluded from the study.
Angiographic procedure
Coronary angiography was performed via the femoral approach. All angiograms included at least two views of the right coronary artery and four views of the left coronary artery. Angiographic images were independently evaluated by at least two expert interventional cardiologists. After myocardial ischaemia was documented on MPS, patients with persistent symptoms despite optimal medical therapy underwent CTO PCI, and drug-eluting stents were implanted.
Chronic total occlusion was defined as an occlusion of an epicardial coronary artery without antegrade flow through the lesion and a probable or definite duration of at least 3 months [19]. The Rentrop classification was used to assess coronary collateral circulation (CCC). On the basis of this classification, collateral flow was graded as follows: 0, no collateral flow; 1, weak collateral flow; 2, partial collateral flow; and 3, complete collateral flow. Rentrop grades 2 and 3 were considered indicative of well-developed collateral circulation [20]. Lesion complexity was assessed according to the J-CTO score, which includes entry morphology, calcification, bending, occlusion length, and re-try. The J-CTO score was graded as follows: 0, easy; 1, intermediate; 2, difficult; and ≥ 3, very difficult [21].
Analysis of electrocardiographic parameters
A standard 12-lead ECG was obtained from all patients prior to the intervention, recorded at a paper speed of 25 mm/s and a calibration of 10 mm/mV. All ECG recordings were scanned at a resolution of 300-dpi and independently analysed by two experienced cardiologists who were blinded to the clinical data of patients. Heart rate, PR interval, QRS duration, QT interval, QTc interval, and the amplitudes of R and Q waves were measured. The total Q/R ratio was calculated as the ratio of summed Q-wave amplitude to summed R-wave amplitude across all analysed leads. A pathologic Q wave was defined as an initial negative deflection of the QRS complex with a duration ≥ 30 ms and an amplitude ≥ 1 mm [22].
Statistical analysis
Numerical variables were represented as mean ± standard deviation, while categorical variables were represented as absolute numbers and percentages. The Kolmogorov-Smirnov test was used to evaluate the normality of data distribution. The study population was divided into two groups according to the presence of myocardial scar based on MPS findings. Fisher’s exact test and the χ2 test were used to compare categorical variables in the two groups, while Student’s t-test and the Mann-Whitney U test were used to compare continuous variables in the two groups. Univariate and multivariate analyses were performed to identify independent predictors of myocardial scar. Univariate analyses were initially performed, and variables with a p-value < 0.05 were included in the multivariate logistic regression model. Associations between myocardial scar and age, LVEF, left ventricular end-systolic diameter (LVESD), QRS duration, and the total Q/R ratio were expressed as odds ratios (ORs) with 95% confidence intervals (CIs). Adjusted predicted probability of myocardial scar were derived from the multivariate logistic regression model. Omnibus likelihood ratio tests were used to assess the contribution of each predictor in the model. Receiver operating characteristics (ROC) curve analysis was performed to evaluate the discriminative ability of the identified predictors. The area under the curve (AUC) with 95% CIs was calculated, and optimal cut-off values were determined using Youden’s index. Sensitivity and specificity were derived accordingly. Potential multicollinearity between variables, particularly LVEF and LVESD, was assessed, and variable selection was guided by clinical and statistical considerations. Skewed variables were retained due to clinical interpretability. Intraobserver and interobserver reliability of ECG measurements were assessed using intraclass correlation coefficients (ICCs) based on a two-way mixed-effects model with an absolute agreement definition. Bland–Altman analysis was performed to evaluate systematic bias. A randomly selected subset of 54 patients was used for reliability. A two-tailed p-value < 0.05 was considered statistically significant. All statistical analyses were performed using SPSS 22.0 (SPSS Inc, Chicago, IL, USA).
Results
A total of 283 patients who met the inclusion criteria were enrolled in the study. Based on MPS findings, patients were classified into two groups: ischaemia without scar (68%) and ischaemia with scar (32%). The ischaemia without scar group included 155 (80.7%) males with a mean age of 62.8 ±9.1 years, whereas the ischaemia with scar group comprised 79 (86.8%) males with a mean age of 65.6 ±8.2 years. The prevalence of diabetes mellitus, hyperlipidaemia, and coronary artery disease was comparable between the groups (55.2% vs. 67%, p = 0.05; 77% vs. 82.4%, p = 0.30; and 73.4% vs. 82.4%, p = 0.09; respectively). Patients with ischaemia with scar exhibited lower LVEF and higher LVESD compared to those without scar (43.5 ±12.7 vs. 56.5 ±9.8, p < 0.001; 3.7 ±0.8 vs. 3.1 ±0.5, p < 0.001; respectively). The extent of ischaemia on MPS did not significantly differ between the two groups (p = 0.10). There were no significant differences between the groups in terms of CTO localisation (LAD, CX, RCA) or the presence of well-developed collateral circulation (all p > 0.05). Similarly, heart rate and the intervals of PR, QT, and QTc did not differ significantly between the groups (all p > 0.05). The total R-wave amplitude was significantly higher in patients without scar. In contrast, QRS duration, the total Q-wave amplitude, and the total Q/R ratio were significantly higher in patients with scar (all p < 0.001). The baseline demographic, clinical, and angiographic characteristics of the two groups are presented in Table I.
Table I
Demographic, clinical, and angiographic characteristics according to myocardial scar status
[i] BMI – body mass index, DM – diabetes mellitus, HL – hyperlipidaemia, CAD – coronary artery disease, LVEF – left ventricular ejection fraction, LVEDD – left ventricular end-diastolic diameter, LVESD – left ventricular end-systolic diameter, CTO – coronary total occlusion, LAD – left anterior descending artery, CX – circumflex artery, RCA – right coronary artery.
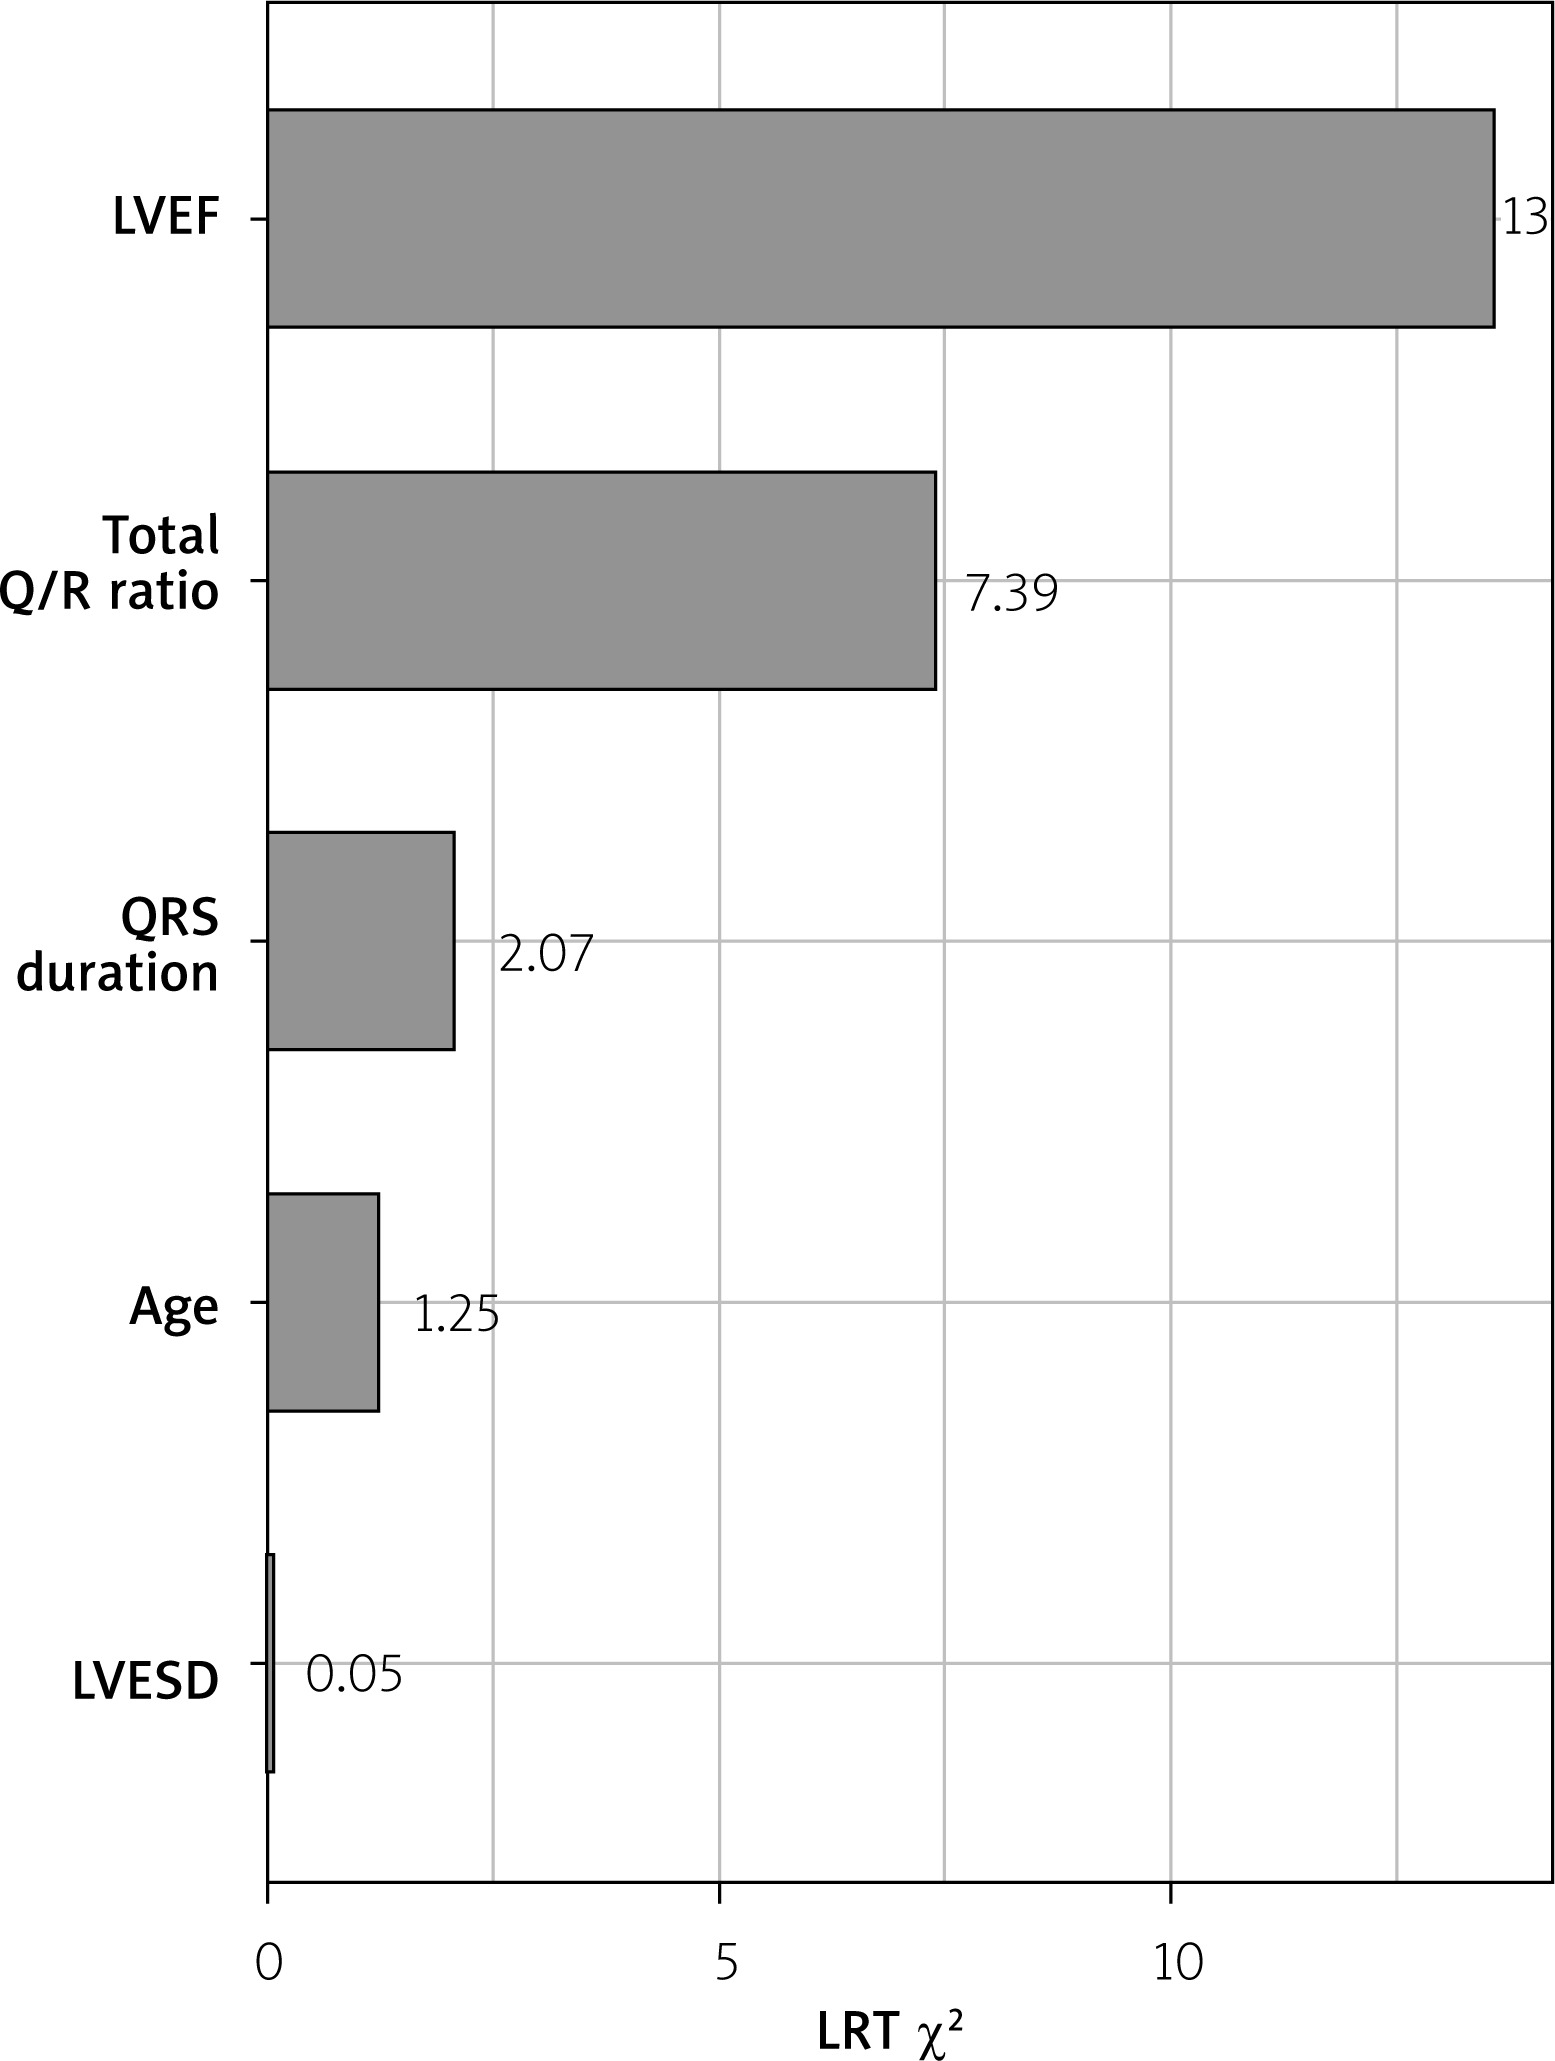
The statistically significant variables identified in univariate analysis, including age, LVEF, LVESD, QRS duration, and total Q/R ratio, were entered into the multivariate logistic regression analysis. In this analysis, total Q/R ratio and LVEF were found to be independently associated with myocardial scar (OR = 2.53, 95% CI: 1.13–5.63, p = 0.02; OR = 0.93, 95% CI: 0.89–0.97, p < 0.001, respectively) (Table II). Adjusted predicted probabilities of myocardial scar were derived from the multivariate model and are presented in Figures 2 A and B. ROC curve analysis was performed to further evaluate the discriminative performance of the identified predictors. The total Q/R ratio demonstrated moderate discriminative ability for myocardial scar (AUC = 0.705, 95% CI: 0.639–0.770, p < 0.001), while LVEF showed a higher discriminative performance (AUC = 0.779, 95% CI: 0.719–0.839, p < 0.001). The optimal cut-off value for the total Q/R ratio, determined using Youden’s index, was 0.43, yielding a sensitivity of 39.6% and specificity of 92.2%. For LVEF, the optimal cut-off was 47.5%, with a sensitivity of 64.4% and specificity of 80.2% (Figure 3). These findings support the potential clinical utility of these parameters in identifying myocardial scar. Omnibus likelihood ratio tests were used to evaluate the contribution of each predictor. The likelihood ratio analysis showed that LVEF and total Q/R ratio had greater predictive importance for myocardial scar than age, QRS duration, and LVESD (p < 0.001, p = 0.007, p = 0.19, p = 0.11, and p = 0.89, respectively) (Table III, Figure 4).
Table II
Predictors of myocardial scar in multivariate logistic regression analysis
| Predictors | OR | 95% CI | P-value |
|---|---|---|---|
| Age [years] | 1.02 | 0.99–1.06 | 0.20 |
| LVEF (%) | 0.93 | 0.89–0.97 | < 0.001 |
| LVESD [cm] | 1.04 | 0.54–2.03 | 0.89 |
| QRS duration [ms] | 1.01 | 0.99–1.03 | 0.11 |
| Total Q/R ratio | 2.53 | 1.13–5.63 | 0.02 |
Table III
Omnibus likelihood ratio test results for predictors of myocardial scar
| Predictors | χ2 | P-value |
|---|---|---|
| Age [years] | 1.64 | 0.19 |
| LVEF (%) | 13.3 | < 0.001 |
| LVESD [cm] | 0.01 | 0.89 |
| QRS duration [ms] | 2.51 | 0.11 |
| Total Q/R ratio | 7.38 | 0.007 |
Figure 2
Adjusted predicted probability of myocardial scar based on (A) total Q/R ratio and (B) LVEF derived from the multivariate logistic regression model
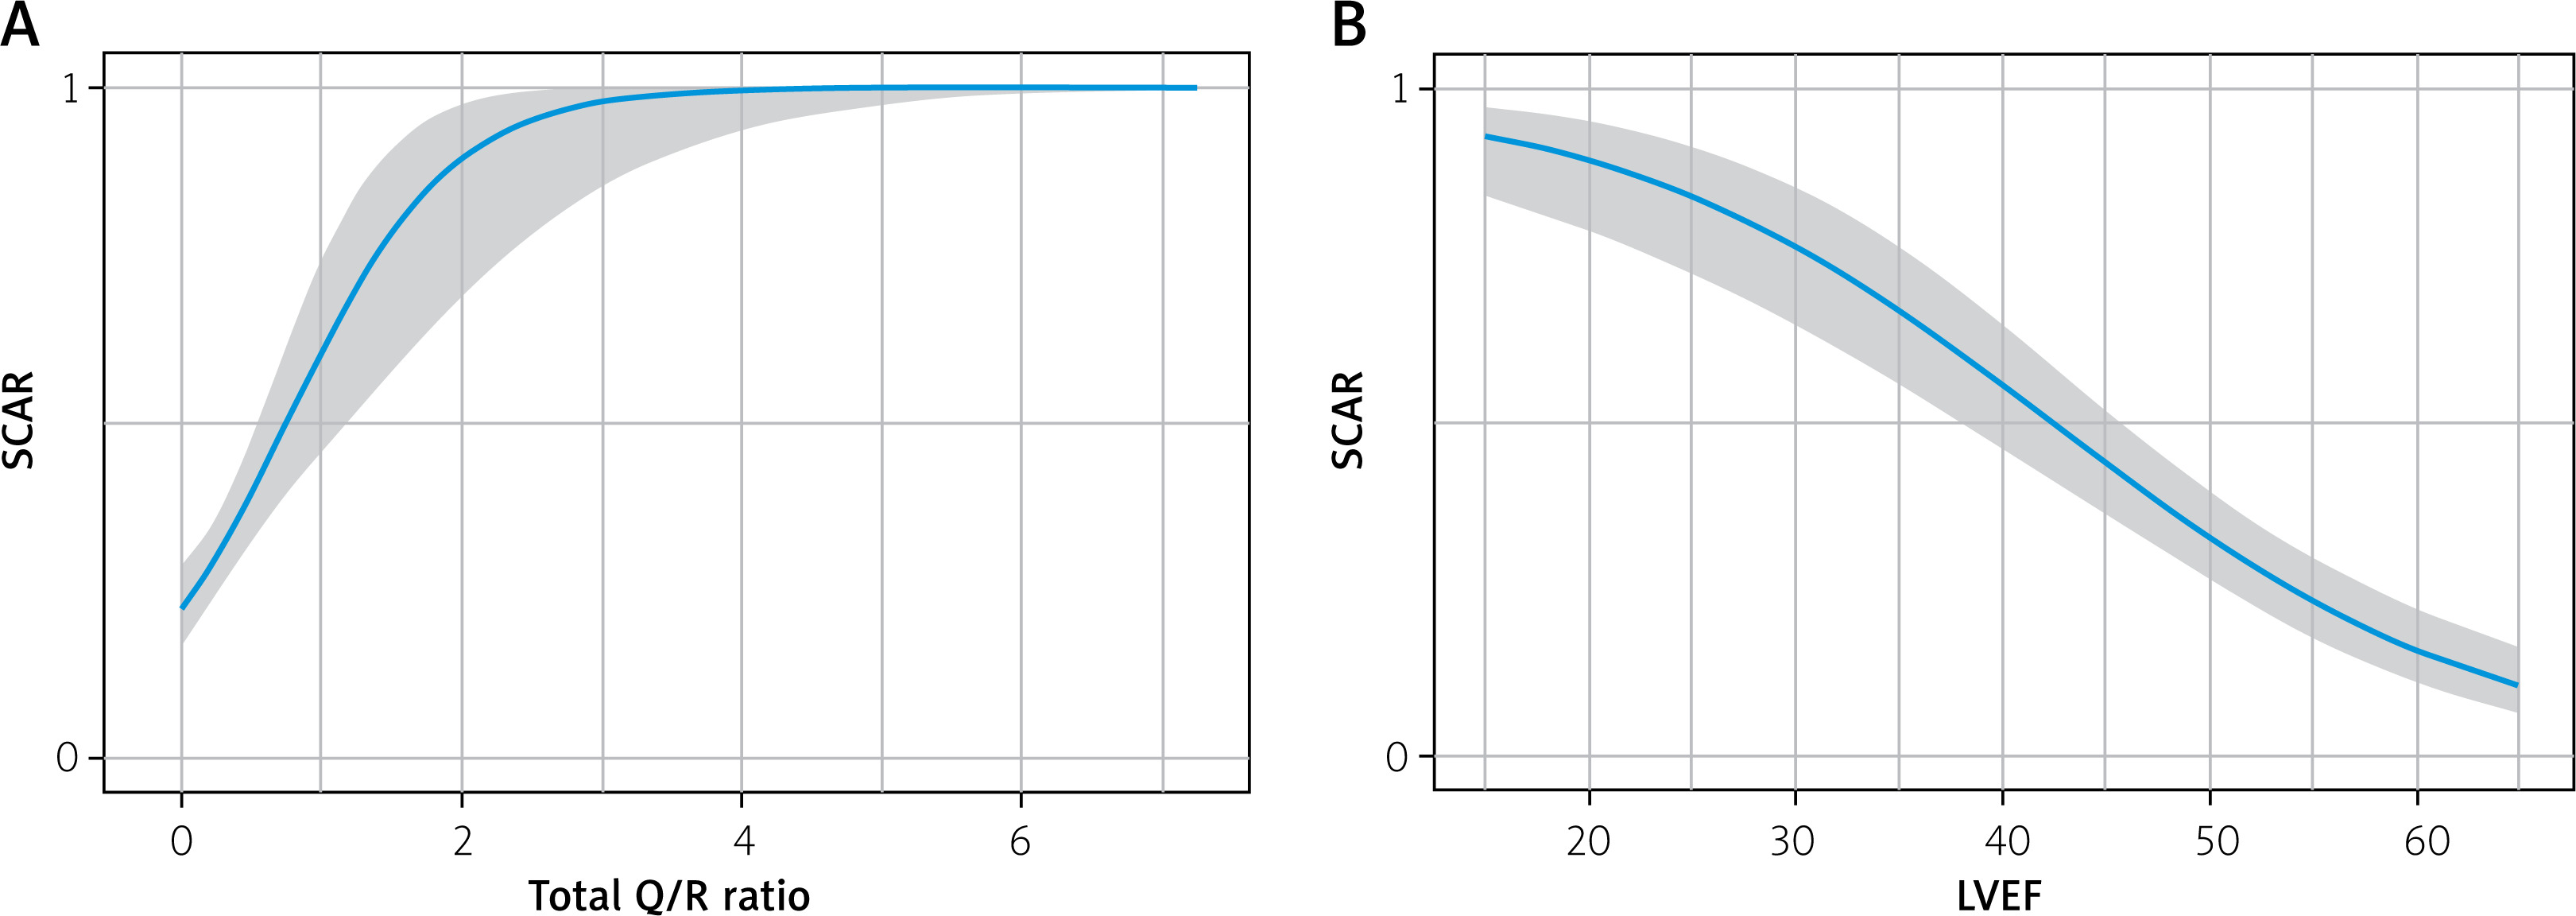
Figure 3
ROC curves showing the discriminative performance of total Q/R ratio and LVEF for identifying MPS-defined myocardial scar
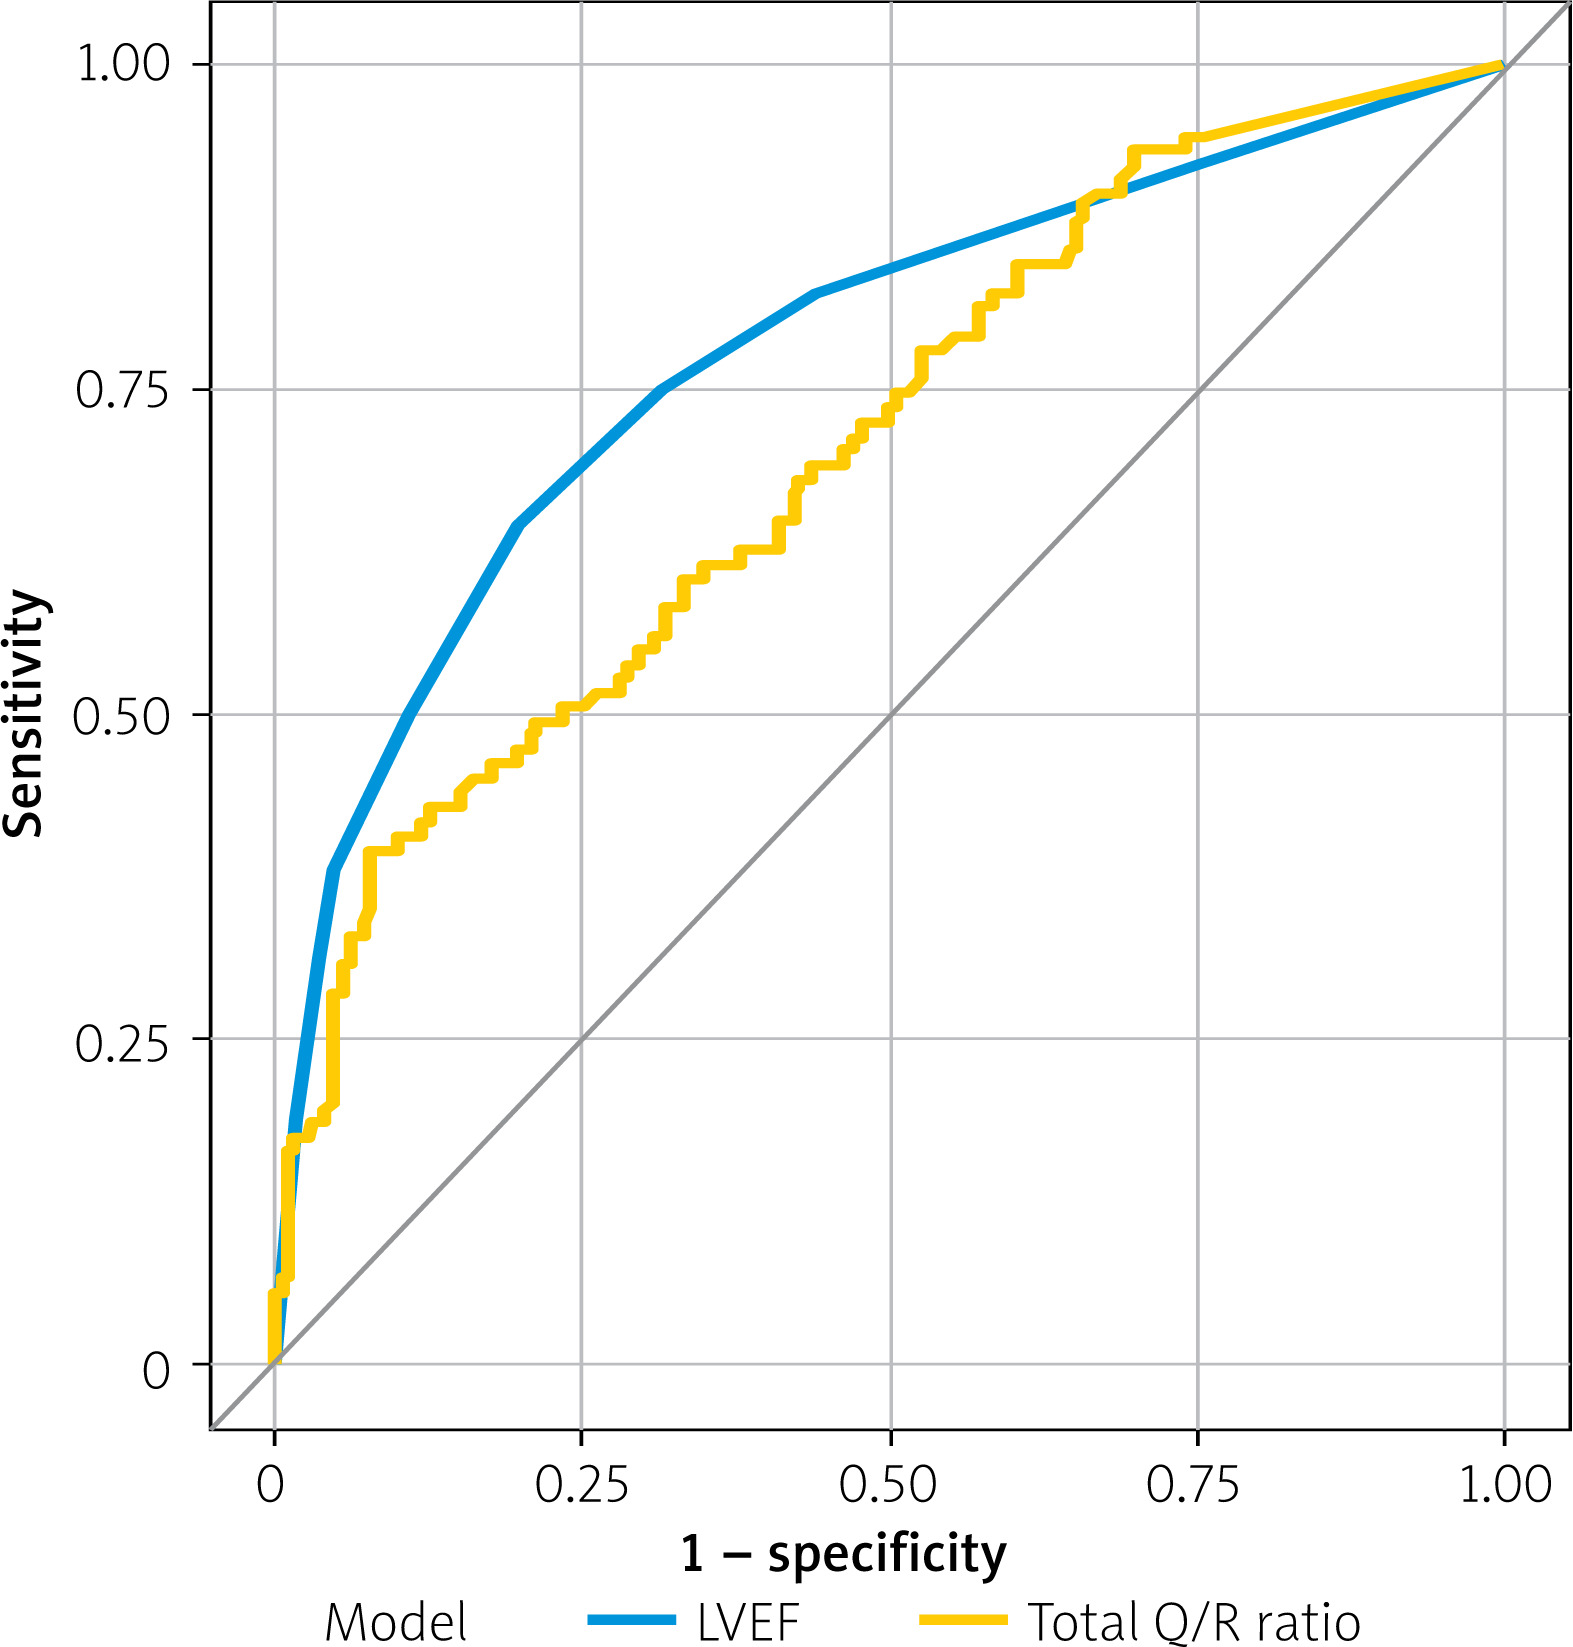
Figure 4
Likelihood ratio analysis demonstrating the relative contribution of predictors of myocardial scar, including LVEF, total Q/R ratio, age, QRS duration, and LVESD
Intraobserver and interobserver reproducibility analyses demonstrated excellent agreement. Intraobserver reliability was high (ICC = 0.948, 95% CI: 0.932–0.967, p < 0.001), and interobserver reliability was similarly high (ICC = 0.921, 95% CI: 0.897–0.949, p < 0.001). Bland–Altman analysis revealed no significant systematic bias between observers (mean difference: –0.032, p = 0.24), with 95% limits of agreement ranging from –0.429 to +0.364, indicating good agreement and interchangeability of measurements.
Discussion
This study demonstrated that both total Q/R ratio and LVEF were independent predictors of myocardial scar in CTO patients with documented ischaemia on MPS. Patients with myocardial scar exhibited significantly lower LVEF and higher total Q/R ratio, supporting their potential utility in identifying myocardial scar.
The management of CTO remains both clinically and technically challenging, necessitating a comprehensive and patient-centred evaluation. The presence of myocardial viability and ischaemia plays a pivotal role in decision-making, because revascularisation is recommended only when viable myocardium or inducible ischaemia is present in the area supplied by the occluded artery [1–5]. Variable imaging modalities, including dobutamine stress echocardiography, SPECT, PET, FFR-CT, and CMR, are available to assess myocardial viability and differentiate ischaemia from scar [5]. A proposed workflow integrating non-invasive imaging techniques (TTE, MPS, PET and CMR) highlights their complementary role in patient selection and procedural planning, emphasising their ability to localise and quantify ischaemia [23]. In the present study, MPS was used to assess both myocardial ischaemia and scar in CTO patients.
The standard 12-lead ECG represents a readily available, inexpensive, rapid, and safe non-invasive tool that may provide valuable insights into myocardial viability. Pathological Q waves are the most studied and well-known markers of myocardial scar [9, 22, 24]. In line with prior CMR-based studies demonstrating an association between Q-wave area and non-viable myocardium [25], we also showed that total Q-wave amplitude was significantly higher in patients with scar. Conversely, R-wave amplitude exhibits a biphasic response to ischaemia, initially increasing during early ischaemia and subsequently decreasing with prolonged ischaemia [10]. Consistent with this pattern, total R-wave amplitude was significantly lower in the scar group.
Building on these observations, the Q/R ratio integrates both Q-wave augmentation and R-wave attenuation, thereby reflecting the cumulative electrophysiological consequences of prolonged ischaemia. Previous studies have suggested its prognostic value in acute myocardial infarction [26]. In our study, the total Q/R ratio was significantly higher in patients with myocardial scar and remained independently associated with scar in the multivariate analysis. This finding was further supported by likelihood ratio analysis, suggesting that the Q/R ratio may provide complementary information to conventional parameters.
Other ECG markers have also been explored in the context of myocardial scar. A meta-analysis reported that fragmented QRS has higher sensitivity but lower specificity compared with Q-waves, with improved specificity when combined [27]. Additionally, in certain populations, LV diffuse fibrosis and myocardial scar have been associated with lower QRS voltage, shorter QRS duration, and prolonged QT interval, regardless of QRS morphology [28]. In our study, QT and QTc intervals did not differ between groups. Although QRS duration was longer in patients with scar, it demonstrated limited predictive value.
Finally, our findings regarding LVEF are consistent with prior CMR-based studies demonstrating an association between myocardial scar and impaired LVEF, while collateral circulation appears to have a limited relationship with scar burden [29]. Similarly, we observed no significant difference in well-developed collateral circulation between groups. LVEF was significantly reduced in patients with myocardial scar and emerged as an independent predictor in the multivariate analysis. Notably, likelihood ratio analysis identified LVEF as the most dominant predictor, underscoring its association with myocardial viability in this patient population.
This retrospective study was a single-centre study with a relatively small sample size. Myocardial ischaemia and scar were evaluated using MPS, because CMR or myocardial PET were not available at our centre. Although 99mTc-sestamibi imaging has long been used for viability assessment, it may underestimate myocardial viability, particularly in patients with severe LV dysfunction. The ECG amplitudes and intervals were manually measured; automated or computer-based analysis was not performed. Although ROC analyses were performed to assess discriminative performance, formal calibration and internal validation analyses were not conducted, and therefore the predictive performance should be interpreted with caution. Model construction was partially based on univariate screening, which may introduce bias despite consideration of clinical relevance. Finally, although we minimised confounding by restricting analyses to CTO-related territories and excluding multivessel CTO, residual confounding cannot be entirely excluded.
Conclusions
The total Q/R ratio was significantly associated with myocardial scar in patients with CTO and ischaemia on MPS. As an easily obtainable electrocardiographic parameter, the total Q/R ratio may provide clinically relevant and complementary information for identifying myocardial scar as assessed by MPS.