
Introduction
Metabolic dysfunction-associated steatotic liver disease (MASLD) is now the most common chronic liver disease worldwide, tracking the rise of obesity and type 2 diabetes [1-3]. While its clinical spectrum ranges from steatosis to steatohepatitis and fibrosis, the stage of fibrosis remains the dominant predictor of liver-related outcomes and mortality [4, 5]. Chronological age is a key risk factor, as older adults with MASLD are significantly more likely to present with advanced fibrosis and cirrhosis [6-8], portending a growing public health burden as populations age [9]. However, chronological age is an incomplete indicator of biological vulnerability, as individuals of the same age exhibit substantial differences in health and physiological resilience [10-12].
These limitations have driven interest in biological ageing, conceptualized as cumulative multisystem damage arising from processes such as genomic instability, epigenetic alterations, loss of proteostasis, mitochondrial dysfunction, and cellular senescence [11, 12]. Biomarker algorithms including Phenotypic Age (PhenoAge) and the Klemera-Doubal Method (KDM) capture biological age (BA) acceleration and consistently predict morbidity and mortality across populations [13-16]. In the liver, ageing biology manifests as the accumulation of senescent cells, impaired autophagy, and profibrotic signaling [7, 17, 18]. Population studies link accelerated biological ageing to steatotic liver disease [19-23], particularly to advanced fibrosis rather than steatosis alone [24], suggesting that MASLD may be a manifestation of accelerated systemic ageing.
Metabolic dysfunction-associated steatotic liver disease is a cardiometabolic, multisystem condition in which extrahepatic diseases, particularly cardiovascular disease, metabolic syndrome, and certain cancers, drive a large share of adverse outcomes [25-28]. Apart from hepatic complications, much of the morbidity and mortality in MASLD arises from shared pathophysiologic pathways such as insulin resistance, chronic low-grade inflammation, adipose and endothelial dysfunction, and altered immune signaling [29-31]. It therefore follows that BA, which is operationalized from clinical biomarkers, may align with the clustering of chronic conditions that characterize multimorbidity in MASLD [32-34].
While BA acceleration has been linked to multimorbidity and mortality in the general population [35, 36], its association with the burden of extrahepatic conditions among individuals with MASLD has not been explored. We therefore leveraged the National Health and Nutrition Examination Survey (NHANES) to examine whether biological age acceleration, measured by PhenoAge Acceleration, KDM Acceleration, and Homeostatic Dysregulation, is associated with extrahepatic multimorbidity burden in US adults with MASLD. We aimed to determine whether BA measures provide an integrative measure of systemic health that could, in future, be evaluated for its ability to improve risk stratification and guide multidisciplinary care.
Material and methods
Study population and data source
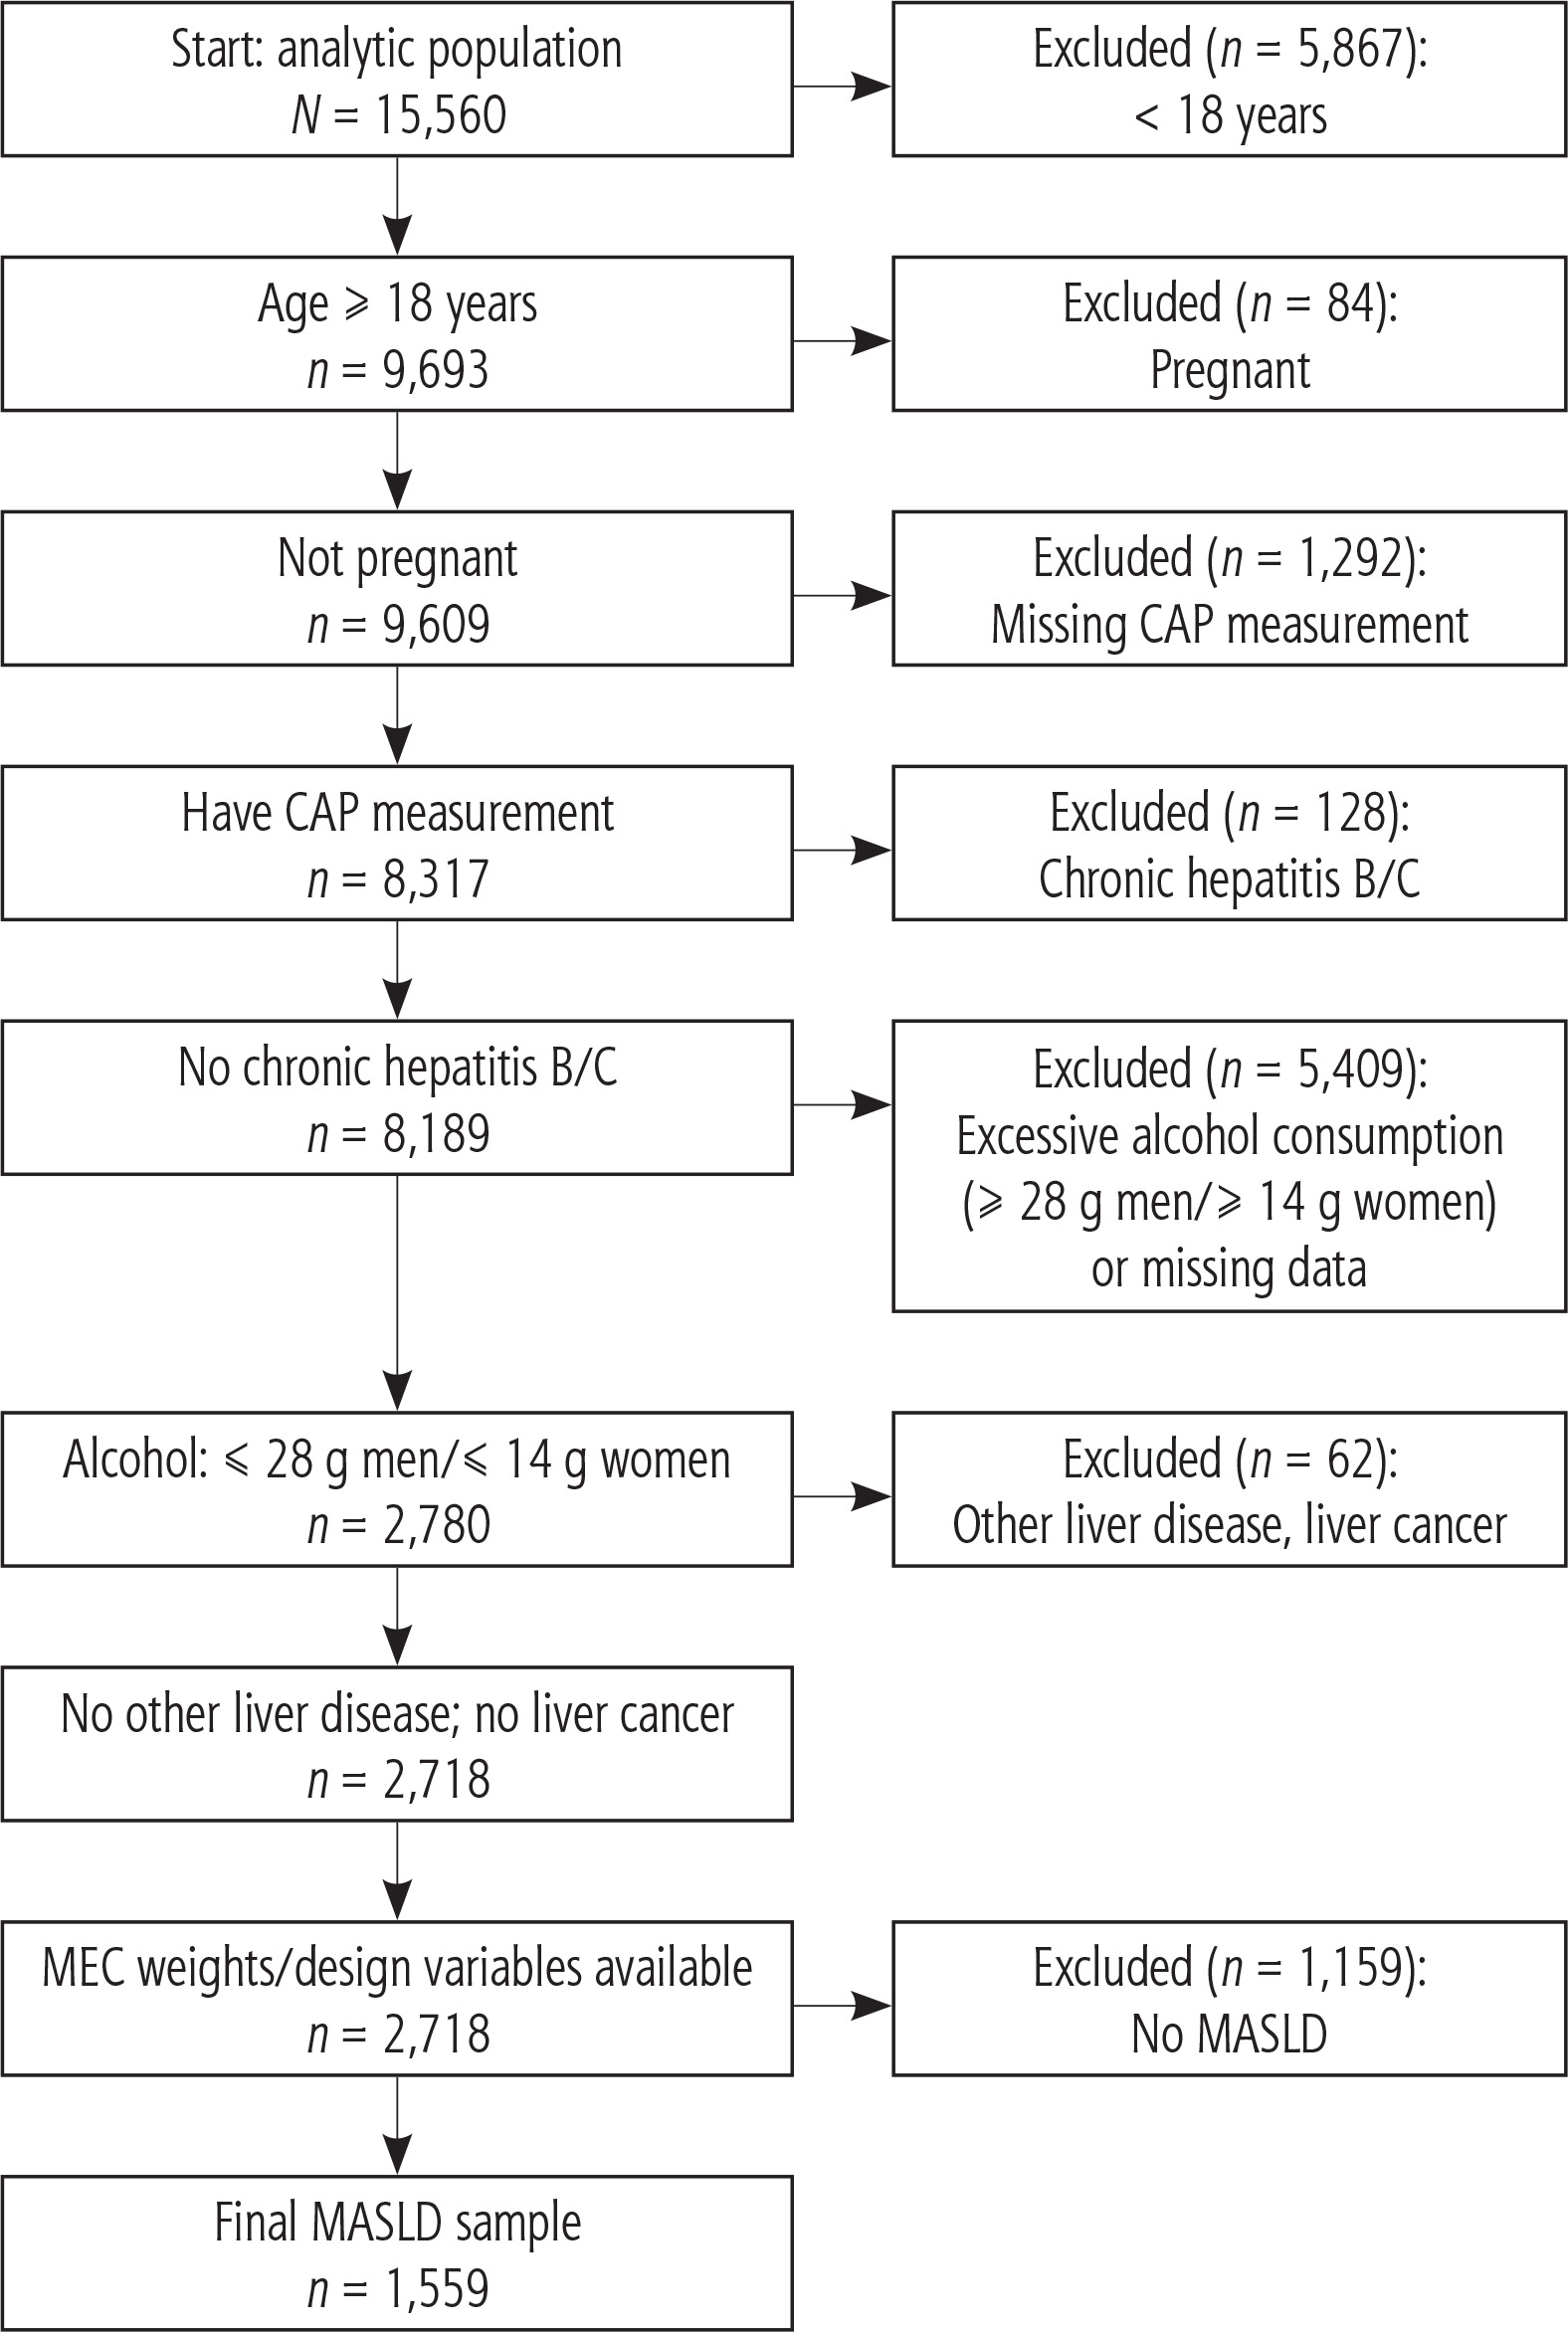
We conducted a cross-sectional analysis using data from the National Health and Nutrition Examination Survey (NHANES) 2017-2020 pre-pandemic data, which constitute a nationally representative, stratified, multistage probability sample of the non-institutionalized civilian US population [37]. NHANES is approved by the National Center for Health Statistics (NCHS) Research Ethics Review Board, and all participants provided written informed consent. Our initial analytical sample included adult participants (aged ≥ 18 years) with complete vibration-controlled transient elastography (VCTE) examinations. We excluded participants who were pregnant, had excessive alcohol consumption (≥ 28 g/day for men and ≥ 14 g/day for women), or reported chronic hepatitis B or C infection, history of viral hepatitis, autoimmune hepatitis, or liver cirrhosis. Participants with liver cancer were also excluded. After applying these criteria, we identified the subgroup meeting criteria for MASLD. The final analytical sample size for the MASLD group was 1559 (Fig. 1).
Definition of metabolic dysfunction-associated steatotic liver disease
Metabolic dysfunction-associated steatotic liver disease was defined according to consensus criteria of hepatic steatosis and at least one cardiometabolic criterion [38]. Hepatic steatosis was identified by a controlled attenuation parameter (CAP) value of ≥ 248 dB/m [39]. The presence of at least one of five cardiometabolic risk factors was required: 1) body mass index (BMI) ≥ 25 kg/m2 (or ≥ 23 kg/m2 for individuals of Asian race/ethnicity), or waist circumference > 94 cm for men or > 80 cm for women; 2) fasting plasma glucose ≥ 100 mg/dl, glycated hemoglobin (HbA1c) ≥ 5.7%, self-reported diabetes, or use of insulin or oral glucose-lowering medications; 3) blood pressure ≥ 130/85 mmHg or antihypertensive medication use; 4) plasma triglycerides ≥ 150 mg/dl or lipid-lowering medication use (statin use was identified from prescription drug data); or 5) high-density lipoprotein (HDL) cholesterol ≤ 40 mg/dl in men or ≤ 50 mg/dl in women.
Exposure: assessment of biological age acceleration
Biological ageing was quantified using three established biomarker-based algorithms implemented according to their original specifications and the BioAge R package [13, 40, 41]. All clinical biomarkers were harmonized to the required units.
Klemera-Doubal Method (KDM) BA Acceleration (KDM-BA) was computed from a 12-biomarker panel: serum albumin, alkaline phosphatase, log-transformed high-sensitivity C-reactive protein, total cholesterol, serum creatinine, HbA1c, systolic blood pressure (mean of three readings), blood urea nitrogen, uric acid, lymphocyte percentage, mean corpuscular volume, and white blood cell count. Lymphocyte percentage was sourced directly or calculated from absolute counts. KDM-BA Acceleration was calculated as the residuals from a linear regression of KDM-BA on chronological age.
Phenotypic Age (PhenoAge) Acceleration was calculated using the published algorithm based on nine biomarkers – albumin, creatinine, glucose, log-transformed C-reactive protein, lymphocyte percent, mean corpuscular volume, red cell distribution width, alkaline phosphatase, and white blood cell count – in conjunction with chronological age [13, 14]. Like KDM-BA, PhenoAge is expressed in years. PhenoAge Acceleration was calculated as the residuals from a linear regression of PhenoAge on chronological age.
Homeostatic Dysregulation (HD) was computed as a multivariate dysregulation index (Mahalanobis distance) from the same 12-biomarker set used for KDM, referenced to NHANES III training data [41]. The index was log-transformed to improve normality and then standardized within sex to a z-score, with higher values indicating greater physiological dysregulation. Unlike KDM-BA and PhenoAge, which are in years, HD is defined on this standardized z-score scale.
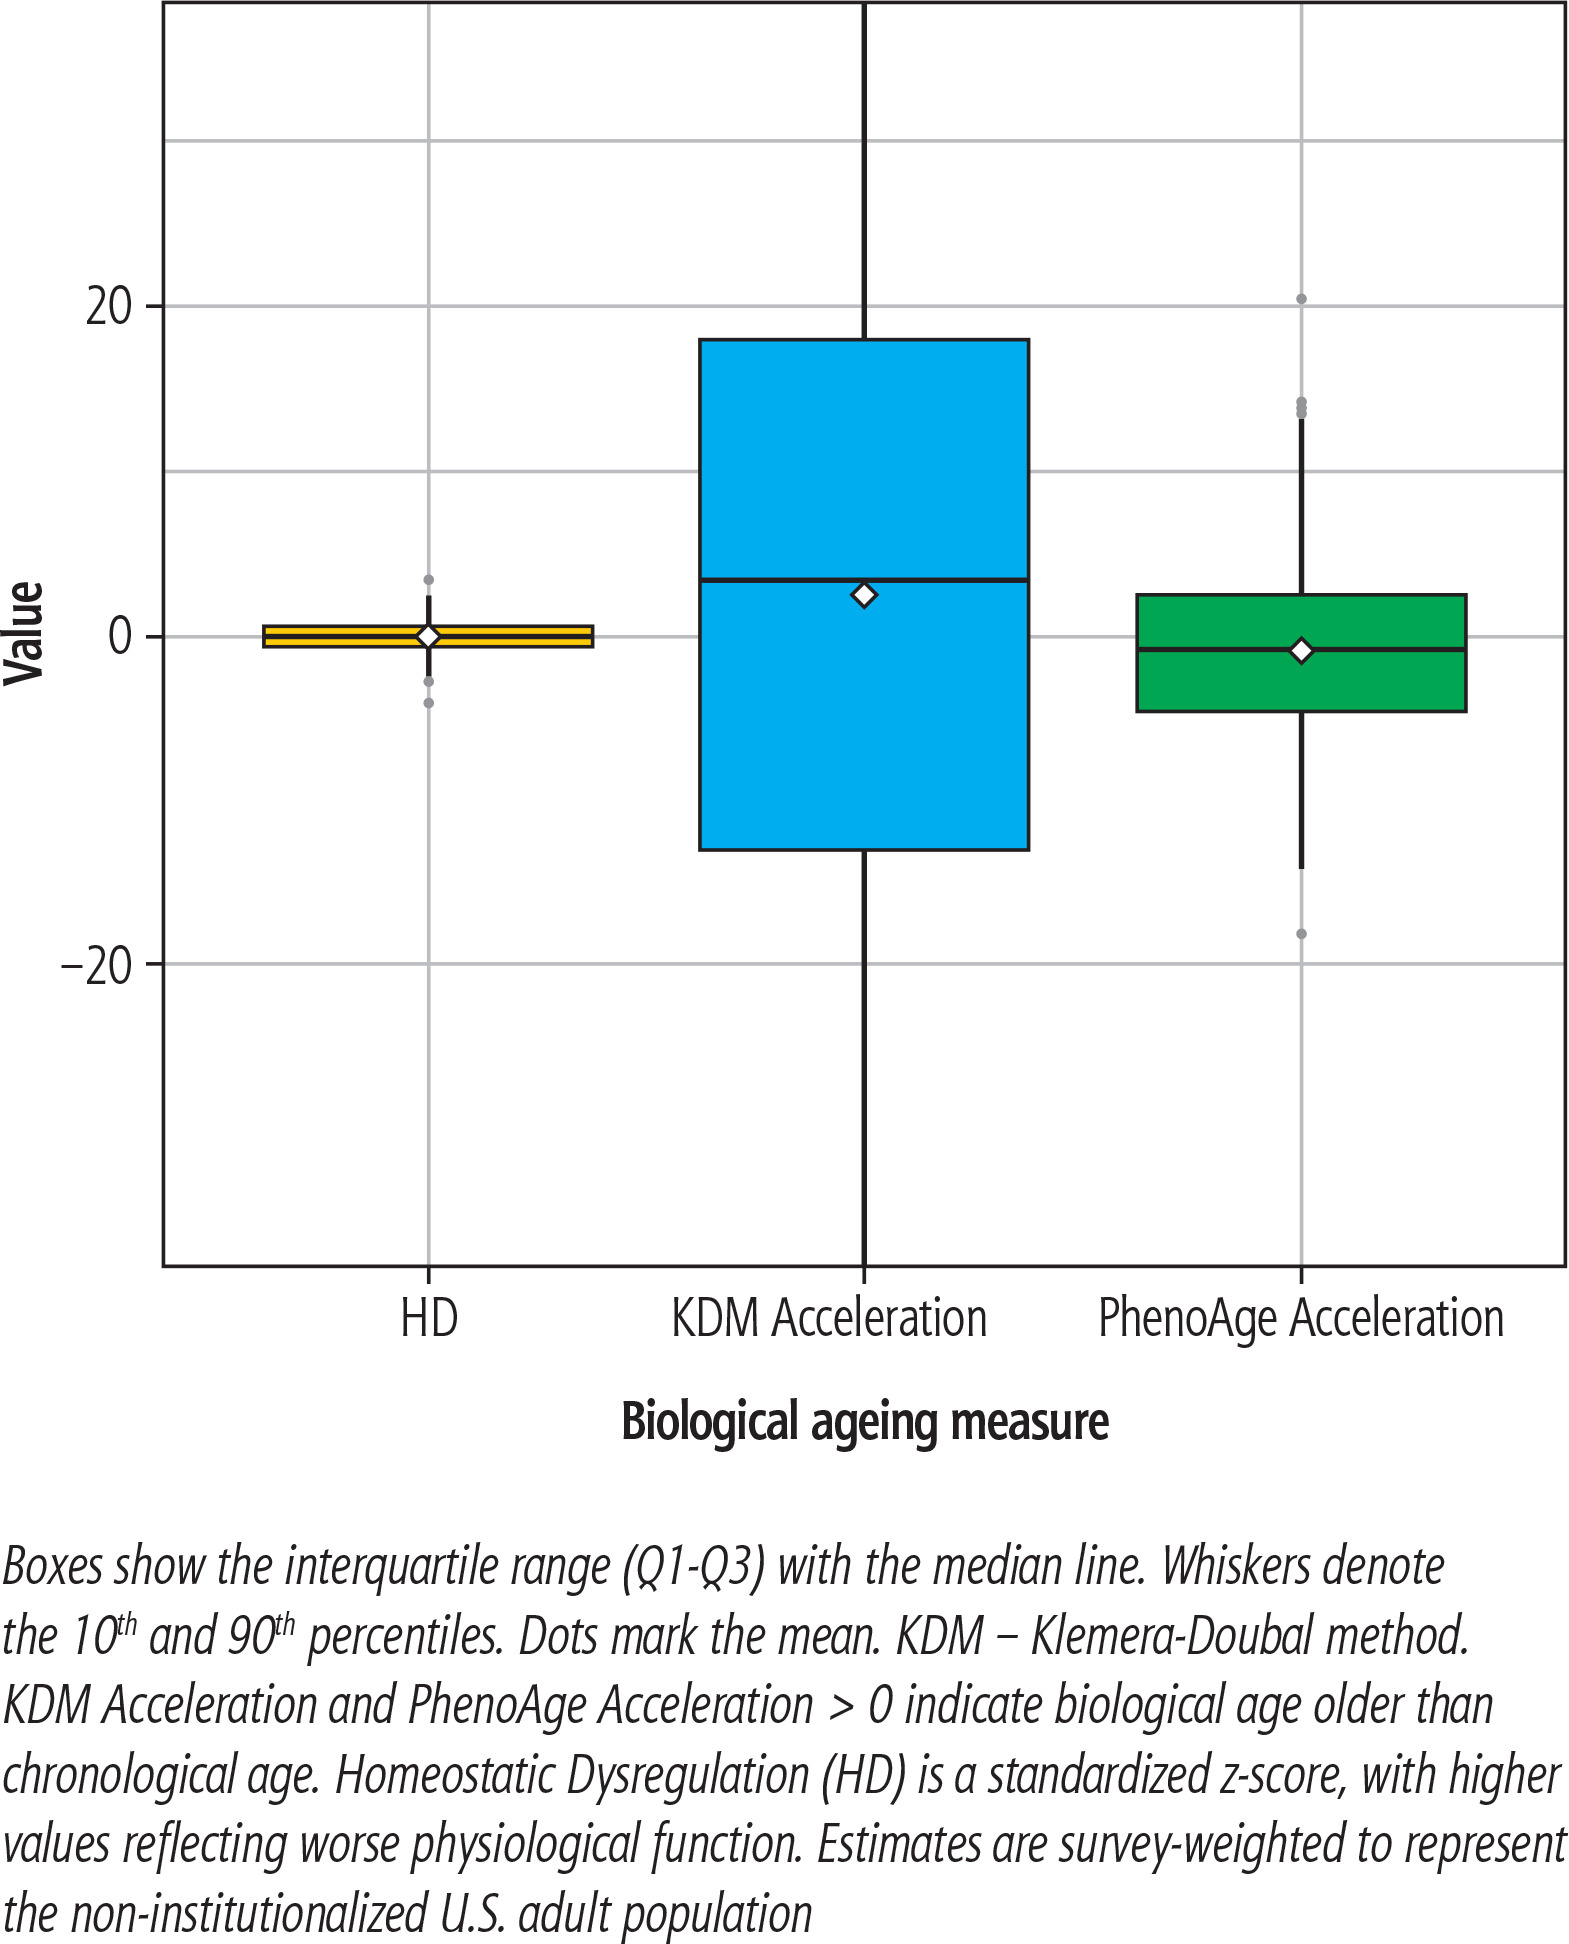
For comparability, all three biological ageing measures (KDM, PhenoAge, and HD) were standardized to survey-weighted z-scores (mean 0, SD 1), and interpreted per 1-SD increase. Homeostatic Dysregulation was log-transformed, standardized, and reverse-coded so that higher values indicate greater dysregulation (worse biological ageing). In descriptive plots, KDM-BA and PhenoAge are displayed on their native biological age (years) scale, whereas HD is shown on its native z-score scale, where higher values reflect worse physiological function.
Outcome: extrahepatic multimorbidity
We identified 17 distinct long-term conditions using NHANES questionnaire data, laboratory measurements, physical examinations, and prescription medication records, consistent with other studies that have examined multimorbidity in the NHANES dataset [42, 43]. Conditions were defined as follows: 1. Cardiovascular disease (CVD): Self-reported physician diagnosis; 2. Heart failure: Self-reported physician diagnosis; 3. Stroke: Self-reported physician diagnosis; 4. Chronic kidney disease: Presence of any of the following: estimated GFR < 60 ml/min/1.73 m2 (2021 race-free CKD-EPI creatinine equation), urine albumin-to-creatinine ratio ≥ 30 mg/g, self-reported diagnosis, or current dialysis; 5. Asthma: Self-reported physician diagnosis; 6. Chronic obstructive pulmonary disease (COPD): Self-reported history of emphysema, chronic bronchitis, or COPD; 7. Kidney stones: Self-reported ever diagnosis; 8. Urinary incontinence: Self-reported incontinence occurring at least weekly; 9. Thyroid disorder: Self-reported physician diagnosis; 10. Osteoporosis: Physician diagnosis or current use of medication; 11. Fragility fracture: Hip, wrist, or spine fracture occurring at age ≥ 50 years with a low/moderate trauma mechanism; high-energy mechanisms were excluded; 12. Arthritis: Self-reported physician diagnosis; 13. Cancer: Any physician-diagnosed cancer, excluding non-melanoma skin cancer where identifiable; 14. Hearing impairment: Self-reported hearing trouble of moderate or worse severity; 15. Sleep disorder: Physician diagnosis of a sleep problem; 16. Depression: Probable major depression, defined as a Patient Health Questionnaire-9 (PHQ-9) score ≥ 10; 17. Anemia: Hemoglobin < 13 g/dl (men) or < 12 g/dl (women), or current anemia treatment.
Cardiometabolic risk factors that are part of the MASLD diagnostic criteria such as overweight/obesity, dysglycemia/diabetes, hypertension, and dyslipidemia were intentionally not counted as separate conditions in the multimorbidity outcome. Including these MASLD defining factors as outcome components would introduce definitional circularity and double-count the same cardiometabolic abnormalities used to define the analytic MASLD cohort. Our multimorbidity construct therefore focused on extrahepatic non-MASLD defining chronic conditions. Kidney disease was retained in the count because it represents a downstream end-organ complication with substantial independent prognostic relevance in MASLD.
From these conditions, we constructed three primary outcome variables: a continuous count of conditions present, a binary multimorbidity variable (presence of ≥ 2 conditions), and an ordered three-level variable (0-1, 2-3, and ≥ 4 conditions).
Construct validity of the multimorbidity count was demonstrated prior to its use as an outcome according to other studies [44, 45]. Known-groups validity was supported by a strong, dose-response relationship with age, where each increasing age band was associated with a 72% higher mean condition count (p < 0.001). Convergent validity showed clear gradient with poorer self-rated health (36% increase per worsening category, p < 0.001), and discriminant validity was supported by the absence of an association with a theoretically unrelated variable, such as exam season (Supplementary Table 1).
Confounders
Confounders were selected after a review of the literature and similar studies on the topic [7, 14, 19-22, 24, 35]. Age (years, continuous), sex (male or female), race and ethnicity (Hispanic, Non-Hispanic White, Non-Hispanic Black, and Non-Hispanic Asian), educational attainment (less than high school, high school or GED, and college or higher), income to poverty ratio (continuous), smoking (never, former, current), serum cotinine (in ng/ml, continuous), World Health Organization physical activity categories (low defined as < 600 MET-min/week, moderate defined as 600 to < 3000, and high defined as ≥ 3000). For alcohol intake we used average grams of alcohol per day using 14 g per standard drink, expressed as a continuous variable. We also applied sex-specific thresholds (≤ 2 drink/day for men and ≤ 1 drink/day for women). Body mass index (in in kg/m2, continuous), aspartate transaminase (AST) to alanine transaminase (ALT) ratio (continuous), and health insurance status (yes or no) were included. Liver fibrosis stage was based on liver stiffness measurement (LSM) cut-offs as follows: F0-F1 (< 8.2 kPa), ≥ F2 (≥ 8.2 kPa), ≥ F3 (≥ 9.7 kPa), and F4 (≥ 13.6 kPa).
Statistical analysis
All analyses incorporated the complex, multi-stage sampling design of the NHANES dataset to ensure nationally representative and accurate estimates. We applied the provided examination weights, strata, and primary sampling units from the 2017 to March 2020 pre-pandemic sample. Descriptive statistics were calculated using these survey weights. Continuous variables are summarized as either weighted means with standard deviations or weighted medians with interquartile ranges, while categorical variables are presented as weighted percentages with their standard errors. To evaluate differences across multimorbidity groups, we used design-based Wald tests for continuous variables and Rao-Scott chi-square tests for categorical variables.
The associations between each BA measure and the three multimorbidity outcomes were estimated using distinct regression models, each accounting for the survey design. For the binary multimorbidity outcome, we employed survey-weighted logistic regression. For the ordered categorical outcome, we used a proportional-odds ordinal logistic model. For the count outcome, we used survey-weighted quasi-Poisson regression with a log link. To enhance the interpretability and comparability of effect estimates across all models, each biological ageing measure (KDM Acceleration, PhenoAge Acceleration, and HD z-score) was standardized to one survey-weighted standard deviation (1-SD) increment, regardless of its original unit (years for KDM-BA and PhenoAge; z-score for HD). Primary analyses used BA acceleration scores, which are residuals of BA regressed on chronological age. Because these residuals remove variation explained by chronological age by construction, we did not further adjust for chronological age in these models to avoid reintroducing collinearity. We report odds ratios (OR) for the binary and ordinal outcomes, and incidence rate ratios (IRR) for the count outcome, each per 1-SD increase in BA. Both unadjusted and adjusted models were estimated, and all analyses were conducted on a complete-case basis. To address the issue of multiple comparisons, we controlled the false discovery rate (FDR) using the Benjamini-Hochberg procedure, applied both globally and within each family of outcomes for a given exposure.
We performed three sensitivity analyses to assess the robustness of our primary findings. First, to disentangle the effects of an individual’s biological age level from the pace of ageing, we replaced the age-acceleration metrics with the raw BA values (KDM and PhenoAge, standardized per 1-SD) and included chronological age as a covariate in the adjusted models. Second, we evaluated a more stringent definition of multimorbidity, defined as the presence of three or more conditions. Third, we constructed a reduced multimorbidity count by excluding cardiovascular disease and chronic kidney disease and then repeated our main analyses using this revised count, as well as the corresponding binary and ordered outcomes derived from it.
All data are presented in tables and figures. The statistical analyses were performed using R version 4.5, using the survey and BioAge packages.
Results
Baseline characteristics
The analytic sample included 1,559 participants, representing a weighted study population with a mean age of 52.3 years (SD = 16.1). The cohort was predominantly male (62.3%) and non-Hispanic White (67.5%). The average multimorbidity count was 2.03 (SD = 1.95), and 51.8% (n = 808) of the participants met the criteria for multimorbidity, defined as having two or more long-term conditions (LTCs).
As in Table 1, significant demographic differences were observed when the population was stratified by multimorbidity status. Participants with multimorbidity were, on average, 14.4 years older than those without (59.5 years vs. 45.1 years, p < 0.001). The multimorbid group also had a higher proportion of females (47.0% vs. 28.4%, p < 0.001) and a different racial/ethnic composition (p = 0.005), characterized by a lower proportion of Hispanic participants (10.4% vs. 17.5%). Health insurance coverage was more prevalent among those with multimorbidity (93.6% vs. 87.9%, p = 0.001). No significant differences were found for income-to-poverty ratio or education level.
Table 1
Baseline characteristics of the study population, overall and stratified by multimorbidity status
Regarding health behaviors, the multimorbid group contained a higher proportion of former smokers (36.9% vs. 23.5%) and a lower proportion of never smokers (53.7% vs. 69.3%, p = 0.003), while their mean daily alcohol intake was lower (17.4 g/day vs. 20.0 g/day, p = 0.001). Physical activity levels were also significantly different (p < 0.001), with a smaller proportion of the multimorbid group reporting high activity (22.8% vs. 42.2%). Clinically, the mean BMI was higher in the multimorbid group (33.5 kg/m2 vs. 31.7 kg/m2, p < 0.001). The prevalence of advanced liver fibrosis (F4) was significantly greater among those with multimorbidity (9.4% vs. 5.5%, p = 0.025).
Characteristics by ordinal multimorbidity category
Participant characteristics stratified by ordinal multimorbidity category (0-1, 2-3, and 4+ conditions) are presented in Table 2. The mean age of participants increased across the categories: 45.1 years for 0-1 conditions, 55.5 years for 2-3 conditions, and 64.8 years for 4+ conditions (p < 0.001). The proportion of females was 28.4%, 41.8%, and 53.8% across the increasing categories, respectively (p < 0.001). The distribution of race/ethnicity differed significantly among the groups (p = 0.002), and health insurance coverage was highest in the 4+ conditions category (96.6%, p < 0.001). No significant differences were observed for income-to-poverty ratio or education level.
Table 2
Participant characteristics by ordinal multimorbidity status (weighted)
The proportion of former smokers increased from 23.5% to 40.4%, while the proportion of never smokers decreased from 69.3% to 49.5% across the ascending categories (p = 0.006). Mean daily alcohol intake decreased from 20.0 g/day in the 0-1 conditions category to 16.0 g/day in the 4+ conditions category (p < 0.001). The distribution of physical activity levels was significantly different (p < 0.001), with the highest proportion of high activity in the 0-1 conditions group (42.2%) and the lowest in the 4+ conditions group (16.0%).
Regarding clinical measures, mean BMI values were 31.7 kg/m2, 33.3 kg/m2, and 33.9 kg/m2 across the increasing multimorbidity categories (p < 0.001). The prevalence of advanced liver fibrosis (F4) was 5.5%, 9.6%, and 9.2% across the categories, with a significant overall difference in fibrosis stage distribution (p = 0.038). The mean values for the biological ageing measures – KDM Acceleration, PhenoAge Acceleration, and Homeostatic Dysregulation – are reported in Table 2; the differences across groups for these metrics were not statistically significant (p = 0.131, p = 0.055, p = 0.156, respectively).
Prevalence of chronic conditions
The weighted prevalences of the 17 chronic conditions are presented in Table 3. Musculoskeletal conditions were the most common, with arthritis having the highest prevalence at 33.4% (95% CI: 28.9-38.0), followed by sleep disorders at 32.3% (95% CI: 29.0-35.7).
Table 3
Weighted prevalence of chronic health conditions in the study population
[i] CI – confidence interval, CKD – chronic kidney disease, ESRD – end-stage renal disease, CHD – coronary heart disease, COPD – chronic obstructive pulmonary disease, SE – standard error. Estimates are weighted to be representative of the non-institutionalized U.S. adult population. Prevalence reflects the proportion of participants with non-missing data for each condition
A group of conditions had prevalences between 10% and 20%. This included chronic kidney disease or end-stage renal disease (CKD/ESRD) at 17.4% (95% CI: 14.6-20.3). Asthma (15.6%), a history of any cancer (14.0%), and incontinence (14.0%) had similar prevalences. Thyroid disorder and kidney stones were also in this range, with prevalences of 12.8% and 11.7%, respectively.
Conditions with prevalences below 10% included hearing impairment (10.5%), osteoporosis (9.5%), coronary heart disease (7.6%), anemia (6.7%), COPD (6.7%), and depression (6.3%). The least prevalent conditions were stroke (3.8%), heart failure (2.9%), and fragility fracture (2.7%).
Distribution of biological ageing measures
The weighted distributions of the three biological ageing measures are presented in Table 4. The mean KDM Acceleration was 1.64 (SD = 22.40), with 10th, 50th (median), and 90th percentiles of –24.59, 0.16, and 28.32, respectively. For PhenoAge Acceleration, the mean was –0.61 (SD = 5.33), with percentiles of –7.13, –0.81, and 6.22. The distribution of HD, expressed as a z-score, had a mean of –0.10 (SD = 1.00). The 10th, 50th (median), and 90th percentiles for this measure were –1.24, –0.22, and 1.34, respectively.
Table 4
Weighted distribution of biological ageing measures
[i] KDM – Klemera-Doubal method, SD – standard deviation, Q – quantile. All estimates are weighted to be representative of the non-institutionalized U.S. adult population. A positive value for KDM or PhenoAge Acceleration indicates that an individual’s biological age is older than their chronological age. The z-score for Homeostatic Dysregulation is scaled such that higher values indicate worse physiological function
Associations between biological ageing and multimorbidity
Table 5 summarizes the associations between the three biological ageing measures and each multimorbidity outcome. In models adjusted for sociodemographic and lifestyle factors, all three metrics were positively associated with a higher multimorbidity burden, with PhenoAge Acceleration showing the largest and most consistent effects.
Table 5
Weighted distribution of biological ageing measures
| Exposure (per 1-SD) | Outcome model | Unadjusted effect (95% CI) | p-value | Adjusted effect* (95% CI) | p-value |
|---|---|---|---|---|---|
| KDM Acceleration | Binary (≥ 2 vs. < 2) | 1.14 (0.96, 1.34) | 0.112 | 1.17 (0.97, 1.40) | 0.086 |
| Ordinal (0-1, 2-3, 4+) | 1.19 (1.01, 1.43) | 0.04 | 1.25 (1.03, 1.52) | 0.025 | |
| Count | 1.13 (1.05, 1.22) | 0.002 | 1.16 (1.08, 1.24) | < 0.001 | |
| PhenoAge Acceleration | Binary (≥ 2 vs. < 2) | 1.22 (1.02, 1.45) | 0.024 | 1.31 (1.07, 1.62) | 0.013 |
| Ordinal (0-1, 2-3, 4+) | 1.27 (1.05, 1.52) | 0.009 | 1.40 (1.16, 1.68) | < 0.001 | |
| Count | 1.16 (1.07, 1.25) | < 0.001 | 1.20 (1.11, 1.29) | < 0.001 | |
| Homeostatic Dysregulation† | Binary (≥ 2 vs. < 2) | 1.25 (1.03, 1.52) | 0.025 | 1.29 (1.05, 1.57) | 0.011 |
| Ordinal (0-1, 2-3, 4+) | 1.25 (1.02, 1.53) | 0.031 | 1.26 (1.04, 1.54) | 0.024 | |
| Count | 1.11 (1.00, 1.24) | 0.065 | 1.10 (1.01, 1.20) | 0.032 |
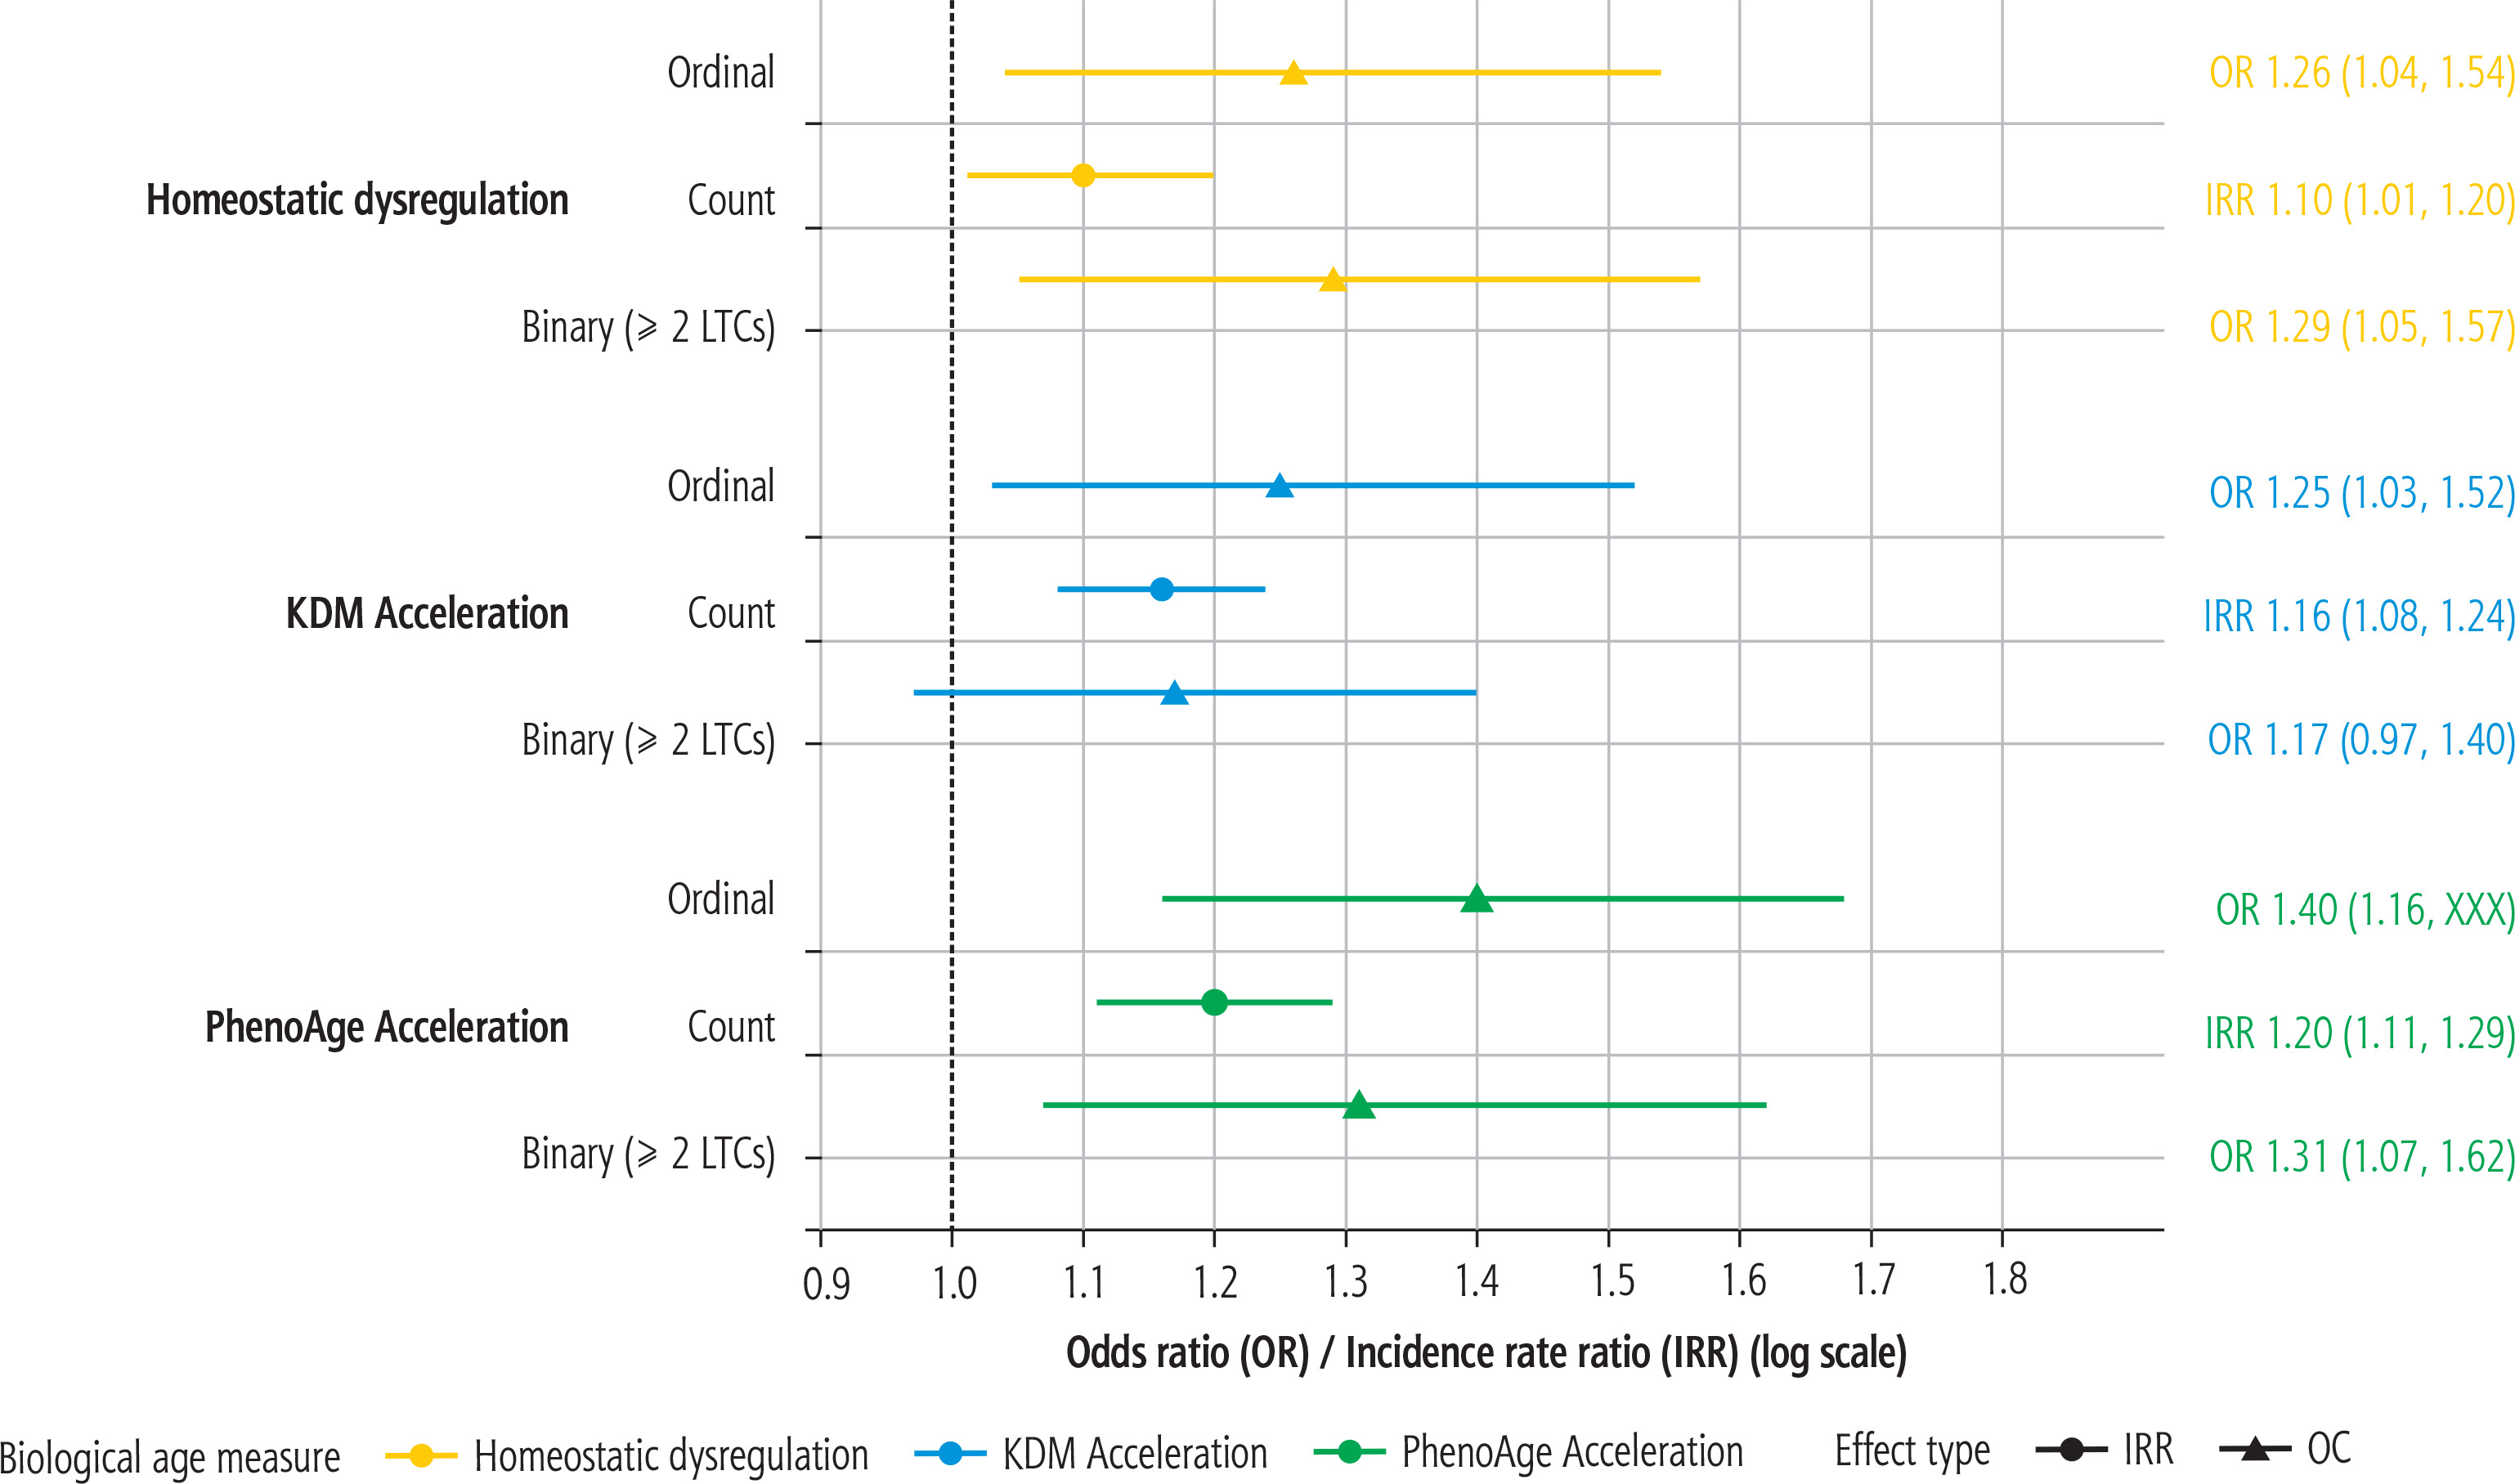
For KDM Acceleration, a one-standard deviation (SD) increase was not associated with odds of having ≥ 2 long-term conditions (OR = 1.17, 95% CI: 0.97-1.40, p = 0.086). Each 1-SD increase in KDM Acceleration was associated with higher odds of being in a more severe multimorbidity category on the ordinal scale (OR = 1.25, 95% CI: 1.03-1.52, p = 0.025) and a higher incidence rate for the condition count (IRR = 1.16, 95% CI: 1.08-1.24, p < 0.001).
PhenoAge Acceleration showed stronger associations across all three endpoints. Per 1-SD increase, PhenoAge Acceleration was associated with 31% higher odds of having ≥ 2 conditions (OR = 1.31, 95% CI: 1.07-1.62, p = 0.013), 40% higher odds of being in a more severe ordinal multimorbidity category (OR = 1.40, 95% CI: 1.16-1.68, p < 0.001), and a 20% higher incidence rate for the multimorbidity count (IRR = 1.20, 95% CI: 1.11-1.29, p < 0.001).
For Homeostatic Dysregulation, a 1-SD increase was associated with 29% higher odds of binary multimorbidity (OR = 1.29, 95% CI: 1.05-1.57, p = 0.011) and 26% higher odds of being in a higher ordinal category (OR = 1.26, 95% CI: 1.04-1.54, p = 0.024). The association with the multimorbidity count was smaller but still statistically significant (IRR = 1.10, 95% CI: 1.01-1.20, p = 0.032).
After applying the Benjamini-Hochberg false discovery rate correction (Supplementary Table 1), all three PhenoAge Acceleration associations remained statistically significant across binary, ordinal, and count outcomes. For KDM Acceleration, only the association with the count outcome remained significant after FDR correction. None of the HD associations met the FDR-adjusted significance threshold.
Sensitivity analyses
We conducted three sensitivity analyses to assess the robustness of our primary findings, the results of which are detailed in Supplementary Tables 2-4. In the first analysis, we replaced age-acceleration metrics with their corresponding raw biological age values, adjusted for chronological age. As shown in Supplementary Table 2, strong associations were observed in unadjusted models. For instance, a one-SD increase in raw KDM Biological Age was associated with over twice the odds of binary multimorbidity (OR = 2.17, 95% CI: 1.80-2.61). After adjustment for chronological age and other covariates, these associations were substantially attenuated but remained statistically significant for both KDM and PhenoAge across all multimorbidity outcomes (Fig. 2).
The second analysis defined a stricter outcome of severe multimorbidity (≥ 3 conditions), which had a weighted prevalence of 31.9% (SE 2.0). As presented in Supplementary Table 3, the associations between BA measures and this severe outcome were pronounced. In fully adjusted models, a one-SD increase in KDM Acceleration was associated with 32% higher odds of severe multimorbidity (OR = 1.32, 95% CI: 1.07-1.62). PhenoAge Acceleration demonstrated a stronger association (OR = 1.50, 95% CI: 1.29-1.75), as did Homeostatic Dysregulation (OR = 1.32, 95% CI: 1.03-1.68) (Fig. 3).
The third analysis examined multimorbidity after excluding cardiovascular disease and chronic kidney disease from the condition count. The prevalence of this modified multimorbidity (≥2 conditions) was 45.1% (SE 2.0), with a mean count of 1.71 (SE 0.07) conditions. As shown in Supplementary Table 4, the associations between BA measures and this reduced multimorbidity definition were attenuated and no longer statistically significant in adjusted models, with confidence intervals including the null value (KDM Acceleration OR = 1.09, 95% CI: 0.89-1.33; PhenoAge Acceleration OR = 1.20, 95% CI: 0.98-1.46; Homeostatic Dysregulation OR = 1.17, 95% CI: 0.94-1.45).
Discussion
In this nationally representative sample of U.S. adults with metabolic dysfunction-associated steatotic liver disease (MASLD), we found a consistent association between higher levels of biological ageing and increased multimorbidity burdens across three distinct BA measures, namely KDM Acceleration, PhenoAge Acceleration, and Homeostatic Dysregulation. Our primary finding suggests that accelerated BA correlates positively with an increased multimorbidity burden, suggesting that multisystem physiological decline captures health risk that extends far beyond the liver. This aligns with existing literature that links biological ageing acceleration to chronic diseases, multimorbidity, and mortality risk in broader populations [19, 22, 33, 36, 46-48]. Conceptually, we did not treat biological ageing as purely upstream or MASLD as purely downstream. Instead, we view MASLD and accelerated biological ageing as mutually reinforcing processes. The metabolic and inflammatory milieu that leads to MASLD may accelerate systemic biological ageing, while a more advanced biological age state may in turn predispose individuals to accumulate MASLD-related comorbidities.
Several noteworthy aspects of these results warrant emphasis. First, the effect sizes were consistent across binary, ordinal, and count outcomes, suggesting that the observed relationships are not an artifact of how multimorbidity was operationalized. Effect estimates were notably most stable when using the count model, which preserves granular information about the number of comorbidities, reinforcing the notion that biological ageing relates not only to the presence of diseases but also more strongly to the progression to a higher burden of disease [49]. The predominance of arthritis as the most common condition in our multimorbidity count aligns with national multimorbidity patterns and likely reflects the age and metabolic risk profile of the MASLD population rather than a selection artifact [50]. Moreover, our findings support gerontological theories depicting ageing as a significant driver of multimorbidity, indicating that accumulated physiological wear over time contributes to the development of multiple chronic conditions [46-49]. Most of the associations persisted after controlling key sociodemographic and lifestyle confounder variables chosen a priori to minimize confounding, without adjusting for potential mediators in the biological ageing–disease pathway. Third, the multiple comparison test indicated that the central conclusions, particularly for PhenoAge Acceleration, are unlikely to be false positives even after accounting for the correlated testing structure.
The sensitivity analysis provided additional insights, revealing that while associations were somewhat attenuated when controlling for chronological age, the association between BA and multimorbidity remained significant. This is expected because raw biological age is strongly correlated with chronological age, whereas acceleration scores remove the part explained by age [14, 40, 41]. Therefore, the accelerated pace of biological ageing, not just time lived, is a salient correlate of multimorbidity. Further, a stricter multimorbidity definition based on three conditions exhibited an even stronger association with biological ageing and argues against a spurious association.
Interestingly, when cardiovascular and kidney diseases were excluded from the multimorbidity list, the association between biological ageing and multimorbidity was substantially attenuated and no longer statistically significant. Rather than undermining the main findings, this pattern suggests that the link between BA and systemic disease burden in MASLD is concentrated in cardio-renal pathways. This is biologically plausible: cardiovascular and renal systems are among the most age-sensitive organ systems and account for a large share of morbidity and mortality in both MASLD and the general population [34, 47, 51, 52]. Moreover, the PhenoAge and KDM algorithms explicitly incorporate markers such as blood pressure, creatinine, inflammatory markers, and cell-based indices that reflect cardiometabolic and renal stress [13, 14, 40, 41]. Therefore, removing outcomes that sit on the same pathophysiologic axis as these biomarkers is expected to weaken the association. We interpret this not as evidence that BA is uninformative, but as indicating that BA in MASLD preferentially captures the cardio-renal multimorbidity cluster that drives much of the excess risk in this population, rather than musculoskeletal or sensory conditions alone.
PhenoAge Acceleration showed the strongest and most consistent association with multimorbidity in MASLD. This pattern makes biological sense. MASLD is a systemic, immunometabolic condition, and PhenoAge is built from routine clinical markers that track inflammation, renal function, and tissue turnover [13, 14]. PhenoAge was developed against mortality risk and validated across cohorts, so it tends to capture broad physiologic decline rather than liver injury alone [13, 14]. Head-to-head and large cohort analyses also report that PhenoAge often outperforms or at least matches KDM for multimorbidity and cardiometabolic outcomes, while Homeostatic Dysregulation is a more general imbalance index without the same cardio-renal signal [36, 47, 53, 54]. Taken together, the stronger performance of PhenoAge here likely reflects the specific domains it measures, particularly inflammation and renal biochemistry, which sit at the center of MASLD’s extrahepatic burden [55, 56].
Clinically and for public health, these findings have several implications, while also underscoring that BA measures are not a replacement for standard cardiometabolic risk assessment. First, BA measures can support risk stratification in MASLD by flagging individuals who, despite already meeting MASLD criteria, appear biologically older and carry a heavier burden of extrahepatic disease, particularly cardiovascular and renal conditions, which are the leading causes of death in this population. In this sense, BA integrates information across multiple organ systems into a single metric that complements, rather than duplicates, hepatic indicators/scores and traditional risk factors. Second, several trials and quasi-experimental studies suggest that biological age is modifiable with lifestyle and pharmacologic interventions [57-60], supporting its potential use as an intermediate endpoint in MASLD to test whether interventions that slow BA also attenuate the accumulation of extrahepatic multimorbidity. Third, BA measures may be especially useful in research settings for trial enrichment (identifying high-risk MASLD subgroups for intensive cardiometabolic management) and for monitoring systemic effects of emerging therapies. Routine screening for cardiometabolic disease and lifestyle modification will remain cornerstones of MASLD care, but our findings suggest that BA can help quantify the broader systemic burden that these strategies aim to prevent.
This study has several notable strengths, including the use of transient elastography for MASLD ascertainment within a large, nationally representative sample of US adults, the application of three complementary biological ageing algorithms, and a multimorbidity framework that captures systemic disease burden. Our analytical approach used complex survey design, multiple comparison corrections, and several sensitivity analyses, which strengthens the results of our conclusions. However, the cross-sectional design remains a fundamental limitation, precluding causal inference about whether accelerated biological ageing drives multimorbidity accumulation or is a consequence of it. Second, our analysis was restricted to individuals with MASLD. By design, we did not include a non-MASLD comparison group, so we cannot determine whether MASLD itself is associated with higher levels of biological ageing relative to those without MASLD, nor can we establish directionality between MASLD, multimorbidity, and BA acceleration. Our aim was to examine variation in multimorbidity burden according to BA acceleration within the MASLD population, rather than to treat MASLD as an exposure. Accordingly, our analyses do not address whether MASLD itself accelerates biological ageing compared with individuals without MASLD. Instead, they show that among people who already meet MASLD criteria, those with higher BA acceleration bear a disproportionately higher burden of extrahepatic disease burden. Moreover, while we adjusted for key sociodemographic and lifestyle confounders, residual confounding cannot be ruled out. Furthermore, the reliance on single-timepoint biomarker measurements may not fully capture an individual’s long-term physiological state. Finally, the use of self-reported conditions, though common in epidemiological studies, introduces potential for misclassification.
Building on these findings, several critical research directions emerge. First, prospective cohort studies are essential to establish the temporal sequence between BA acceleration and the onset of multimorbidity in MASLD. Such studies should also aim to quantify the extent to which cardiometabolic pathways mediate this relationship. Second, head-to-head comparisons are needed to determine the incremental value of adding BA measures to existing clinical predictors, such as FIB-4, NAFLD scores, and genetic risk profiles, for forecasting hard endpoints like disability and hospitalization. Finally, more interventional trials should investigate whether therapies targeting biological ageing such as structured lifestyle programs or pharmacological approaches can delay the progression of multimorbidity in this high-risk population, using BA measures as dynamic, patient-centered endpoints.
Taken together, these findings make several novel contributions. First, to our knowledge this is the first study to apply three complementary biological ageing algorithms (KDM, PhenoAge, and Homeostatic Dysregulation) exclusively within a nationally representative MASLD population, with multimorbidity as the primary outcome rather than liver specific endpoints. Second, by defining multimorbidity using extrahepatic conditions that deliberately exclude MASLD defining cardiometabolic risk factors, we show that BA captures systemic disease burden over and above the diagnostic criteria for MASLD itself. Third, our sensitivity analyses demonstrate that the BA-multimorbidity association in MASLD is largely concentrated in cardiovascular and renal conditions, refining the mechanistic hypothesis that MASLD is embedded in a broader cardio-renal ageing phenotype. Finally, we provide a provide framework for integrating BA measures into multimorbidity research in liver disease, which can be used in future longitudinal and interventional studies to test whether slowing biological ageing translates into fewer extrahepatic complications.
In summary, this study demonstrates that accelerated biological ageing as measured by the PhenoAge algorithm is associated with a greater burden of extrahepatic multimorbidity in adults with MASLD. These findings underscore that MASLD is not merely a liver-specific condition but a marker of accelerated systemic physiological decline. Thus, biological ageing metrics provide a valuable supplement to fibrosis-focused risk stratification by reflecting the systemic health impacts associated with MASLD. Future longitudinal and interventional research should aim to validate these measures as tools for predicting and potentially preventing the clinical outcomes associated with this common metabolic liver disease.







