
Introduction
Recent years have brought us great advances in medical diagnostics in the form of technologies such as next-generation sequencing and gene expression assays. This technological progress contributed to the increased involvement of personal medicine in many clinical areas, including anti-cancer therapies. Identification of the mutation predisposing the patient to the particular treatment option is a key factor impacting the result of the therapy. Therefore, molecular oncological diagnostics is one of the fastest growing areas of laboratory medicine.
The critical step of every diagnostic procedure is the preparation and isolation of high quality starting material [1]. This requires optimization of both sample collection and preservation methods. As there is no gold standard method for tissue sample fixation, heterogeneity of techniques used for sample preservation impedes the following preparative and diagnostic procedures [2]. Moreover, most diagnostic laboratories analyse material from different clinical centres and even small variations in standard fixation protocols may result in large differences in quality and quantity of extracted DNA.
The most frequently used method of tissue sample preservation for medical applications is formaldehyde fixation followed by paraffin embedding. On the one hand it allows one to preserve tissue architecture, cell shape and the components of the cell (proteins, carbohydrates, etc.). On the other hand, prolonged formalin fixation causes the crosslinking of proteins and nucleic acids and random breakages in nucleotide sequences [3–6].
In the present study we compared three kits for formalin-fixed, paraffin-embedded (FFPE) DNA extraction. Two of them use a method based on binding of DNA to either a silica membrane (QIAamp DNA FFPE Tissue Kit) or a glass fibre filter insert (Cobas DNA Sample Preparation Kit, Roche). The third one, automated Maxwell 16 FFPE Plus LEV DNA Purification Kit (Promega), utilizes silica-clad paramagnetic particles (PMPs) for transfer of genetic material through/purifying reagents in the cartridge into the elution buffer (nuclease-free water). To the best of our knowledge, this is the first direct comparison of these methods.
Material and methods
Sample preparation
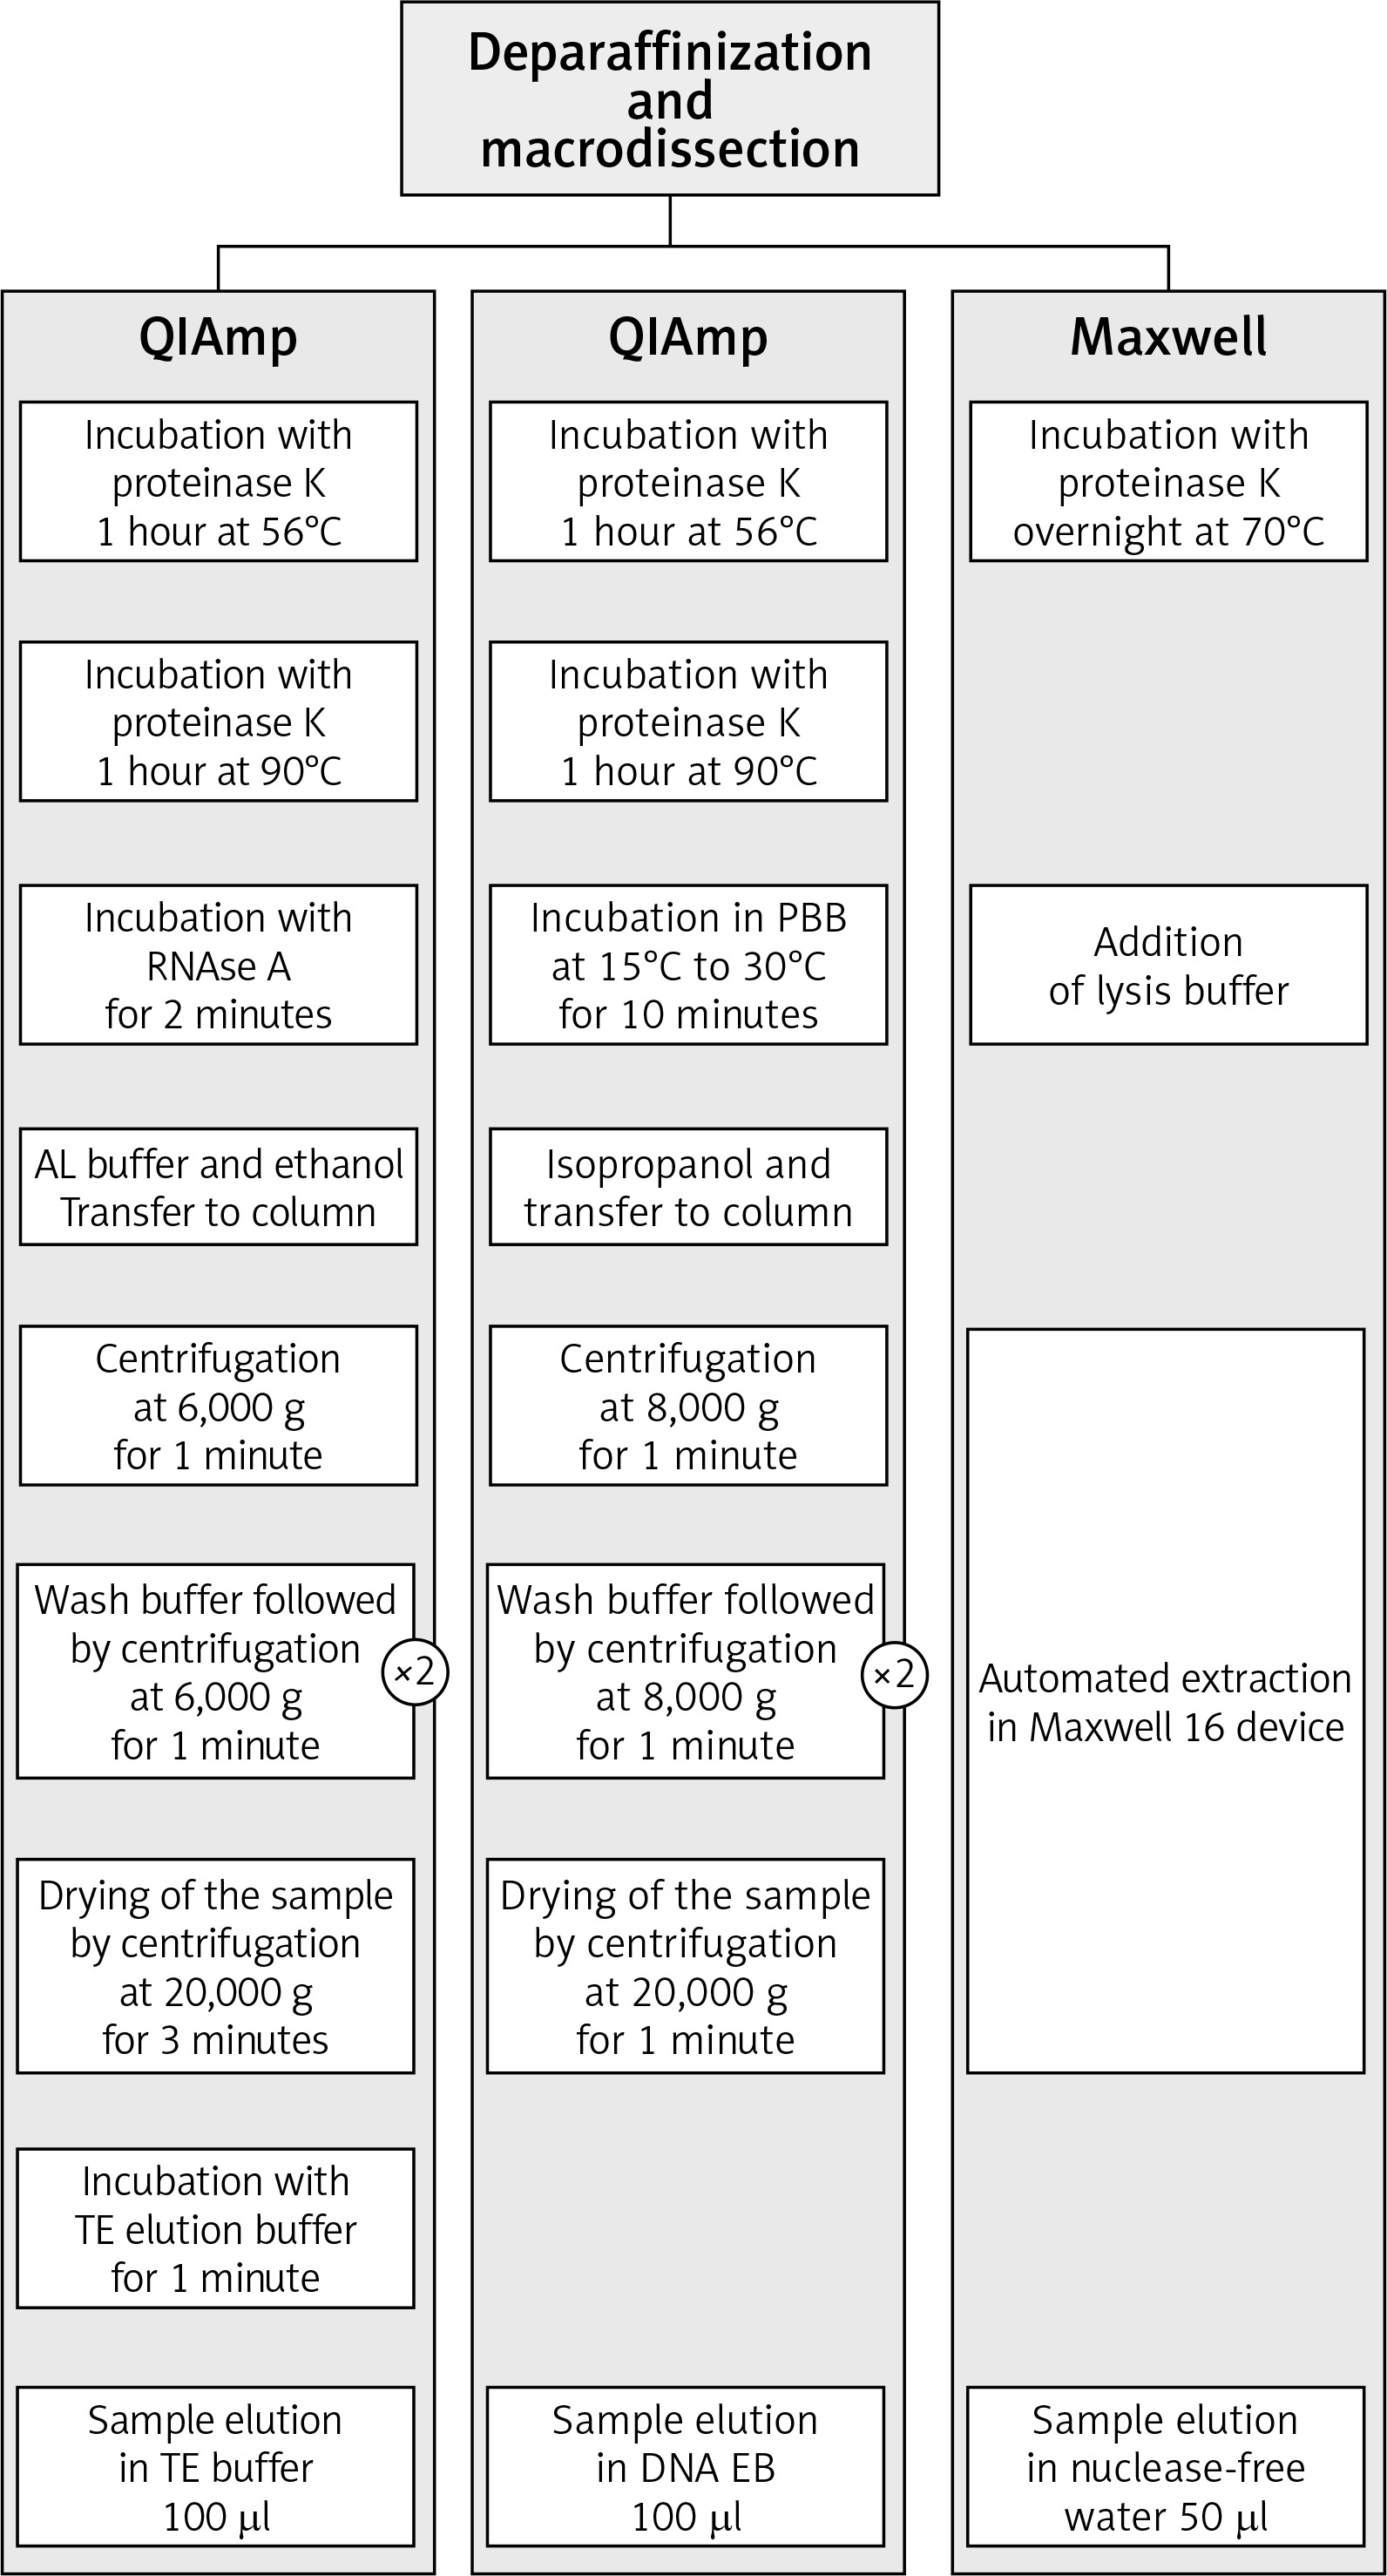
Archived tissue samples included in the present study were submitted by different pathology laboratories to Oncogene Diagnostics for the evaluation of mutational status. All analysed samples were obtained during routine diagnostic procedures. All patients’ personal data were anonymized, and no information on the identity of any individual was available. A total of 42 FFPE tissues (including melanomas, colon cancer and lung adenocarcinomas) were dewaxed/deparaffinized (the procedure included 3 washes in xylene for 3 minutes followed by 3 washes in 99.8% ethanol for 3 minutes) and sliced into 5 μm tissue sections. Tumour-rich regions of interest were identified and marked on the H&E stained slides and confirmed by a pathologist to decrease the risk of false negative results. Tissue material was macrodissected from unstained slides using H&E as a guide. Equal amounts (the same number of paraffin sections and area on the slides) of sections were macrodissected and subjected to each of the extraction procedures. The scheme summarizing extraction protocols can be found in Figure 1.
Prior to the implementation of a specific procedure all samples were treated equally. Furthermore, to avoid the variation associated with the different interpretation of the selected tissue fragments, all slides were macrodissected by one person.
DNA extraction
All procedures were carried out according to the manufacturer’s instructions. RNase was only used with the QIAamp DNA FFPE Tissue Kit (Fig. 1). In the case of two methods we used an additional incubation of samples at 90°C to reverse cross-linkages caused by formalin fixation (mentioned methods are indicated in Figure 1 with asterisks). The Maxwell method was the only one with a lower volume of the DNA extraction buffer.
DNA quantification
The concentration of DNA in all obtained samples was evaluated using two methods: spectrophotometric measurement of absorbance at 260 nm wavelength (NanoDrop 2000, Thermo Scientific, Wilmington, DE) and the fluorometric method based on binding of double-stranded DNA (dsDNA)-selective fluorescent dyes (dsDNA) (Qubit 3.0 Fluorometer/Life Technologies, Invitrogen).
Evaluation of quantity and quality of extracted DNA
The quality of extracted DNA was evaluated using an absorbance ratio of 260 nm to 280 nm (A260/A280). Samples with the A260/A280 ratio falling within the range of 1.8–2.0 were considered to be of good quality. Subsequent Qubit analysis allowed the assessment of the dsDNA content in the isolated samples.
Statistics
Statistical analysis was performed with the R software (release 3.3.2) [7], corrplot [8] and PerformanceAnalytics libraries [9] for visualizations and the doBy library [10] for descriptive statistics. The differences in the quantity and purity between extracted DNA samples were evaluated with the Kruskal-Wallis one-way ANOVA test by ranks. Dunn test with the Holm-Sidak adjustment from the Dunn test library [11] was used as a post-hoc test. Statistica 12.5 was used for data visualisation.
Results
We compared the quantity and purity of samples extracted with three different DNA isolation methods: Cobas, Maxwell, and QIAamp. The results of spectrophotometric and fluorimetric analysis of nucleic acid content in extracted samples are shown in Figure 2. A summary of the statistical analysis is presented in Table 1.
Table 1
Results of qualitative and quantitative analysis of DNA samples isolated using Cobas (C), Maxwell (M) and QIAamp (Q) FFPE DNA extraction kits
Fig. 2
Quantitative analysis of DNA concentration in samples isolated from FFPE specimens. A) Spectrophotometric analysis with NanoDrop. B) Fluorimetric analysis with Qubit method. Results are presented as median and interquartile range (IQR) *p < 0.05; **p < 0.01; ***p < 0.001; ****p < 0.0001
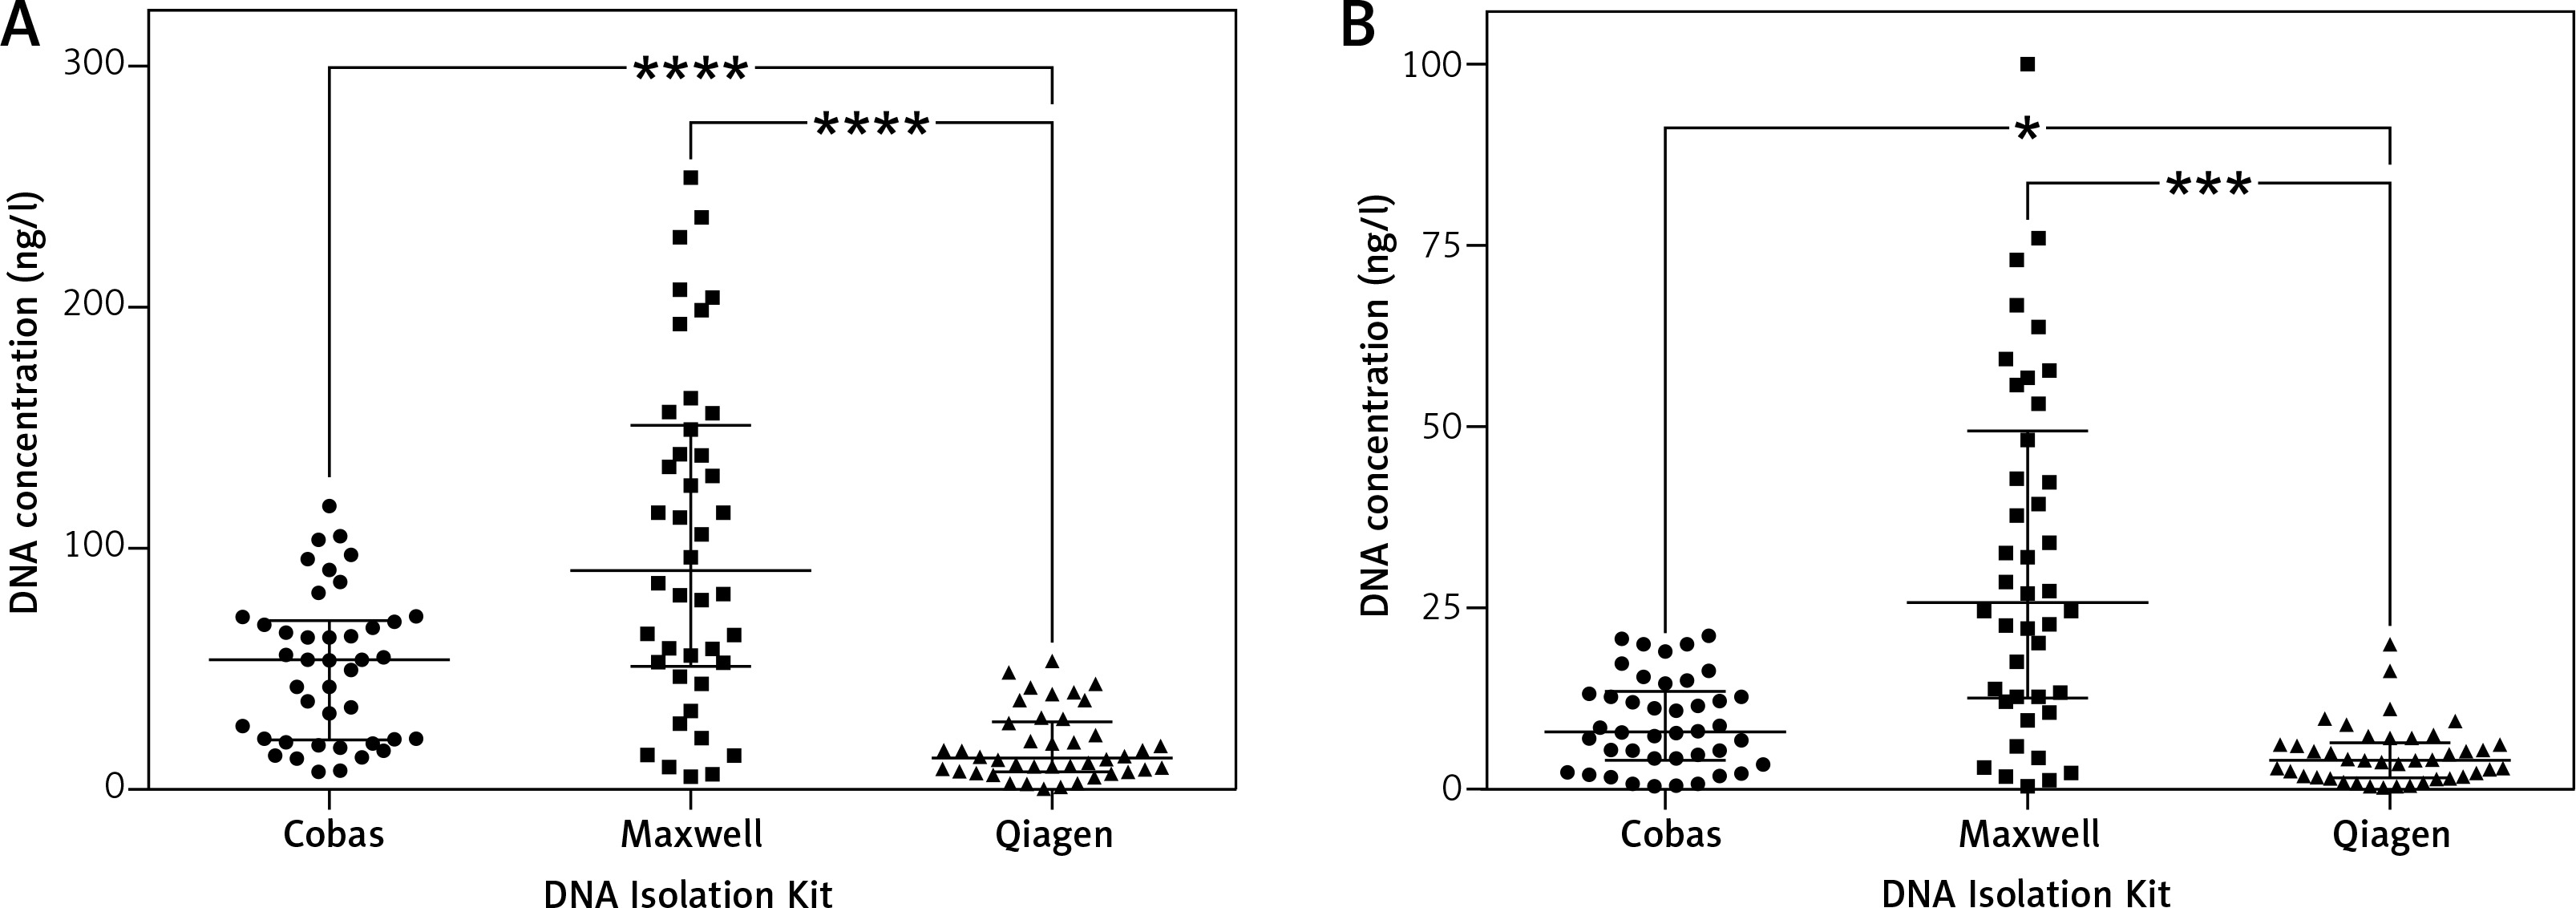
Maxwell and Cobas turned out to be the most efficient methods in terms of DNA concentration in the extracted samples. The analysis with the NanoDrop spectrophotometer showed average concentration of nucleic acids of 50.60 ng/μl for Cobas and 102.72 ng/μl for the Maxwell method (p > 0.05). The average concentration of nucleic acids in samples extracted with QIAamp was 60% lower in comparison to Cobas and over 80% lower in comparison to Maxwell (p < 0.0001).
Fluorimetric analysis of samples with the Qubit method showed similar differences in the outcomes of the investigated DNA isolation techniques. However, the average concentrations obtained with this method were much lower, i.e. 9.15 ng/μl, 31.28 ng/μl and 4.79 ng/μl for the Cobas, Maxwell and QIAamp method respectively.
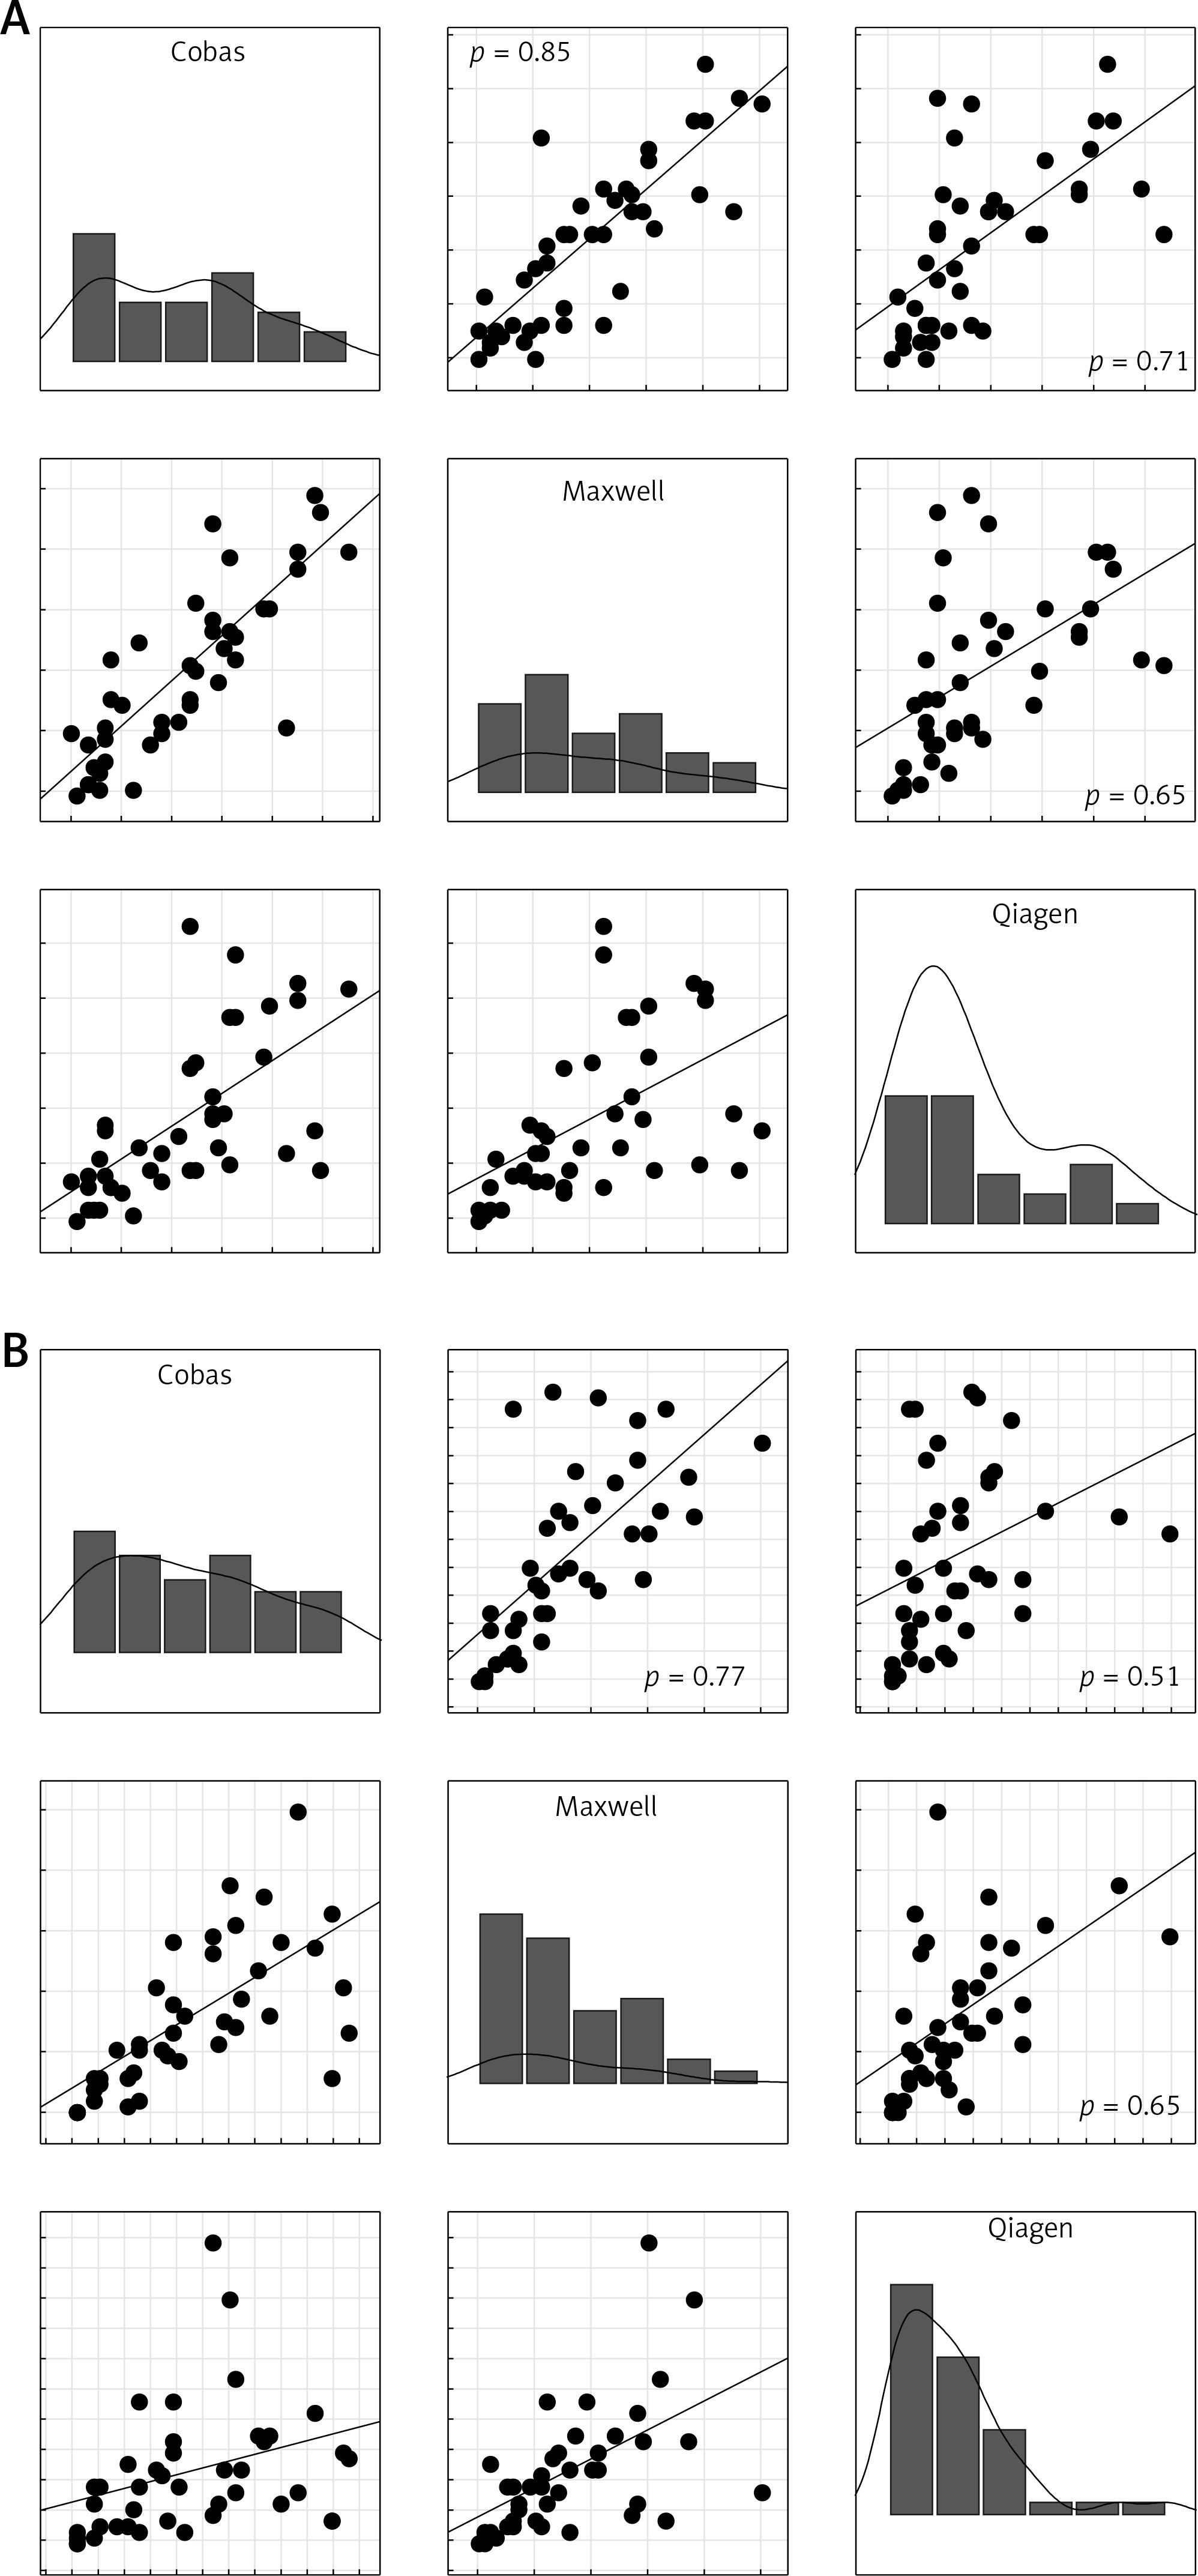
Both spectrophotometric and fluorometric measurements showed significant similarities in the DNA concentration in the samples obtained with the Maxwell and Cobas kits (Fig. 3), with Spearman correlation coefficient of 0.85 and 0.77 for the NanoDrop and Qubit instrument respectively. The results of QIAamp extraction correlated with the results of Maxwell and Cobas procedures, but the relationship was weaker.
Fig. 3
Correlation of the concentration of DNA samples obtained with Cobas, Maxwell and QIAamp techniques. A) Spectrophotometric analysis with NanoDrop. B) Fluorimetric analysis with Qubit method. Correlations with Spearman coefficient in the range 0.4–0.7 were considered as moderate and with Spearman coefficient greater than 0.7 were regarded as strong. All correlations were statistically significant with p < 0.0001
As mentioned before, extraction of DNA from FFPE samples using the Maxwell method resulted in the highest concentration of DNA in the solutions. However, due to a lower final volume of the samples obtained with the Maxwell method (50 μl) as compared to the other two methods (100 μl), the total yield of DNA isolated with the Cobas and Maxwell methods was comparable and in both cases much higher than for the QIAamp technique.
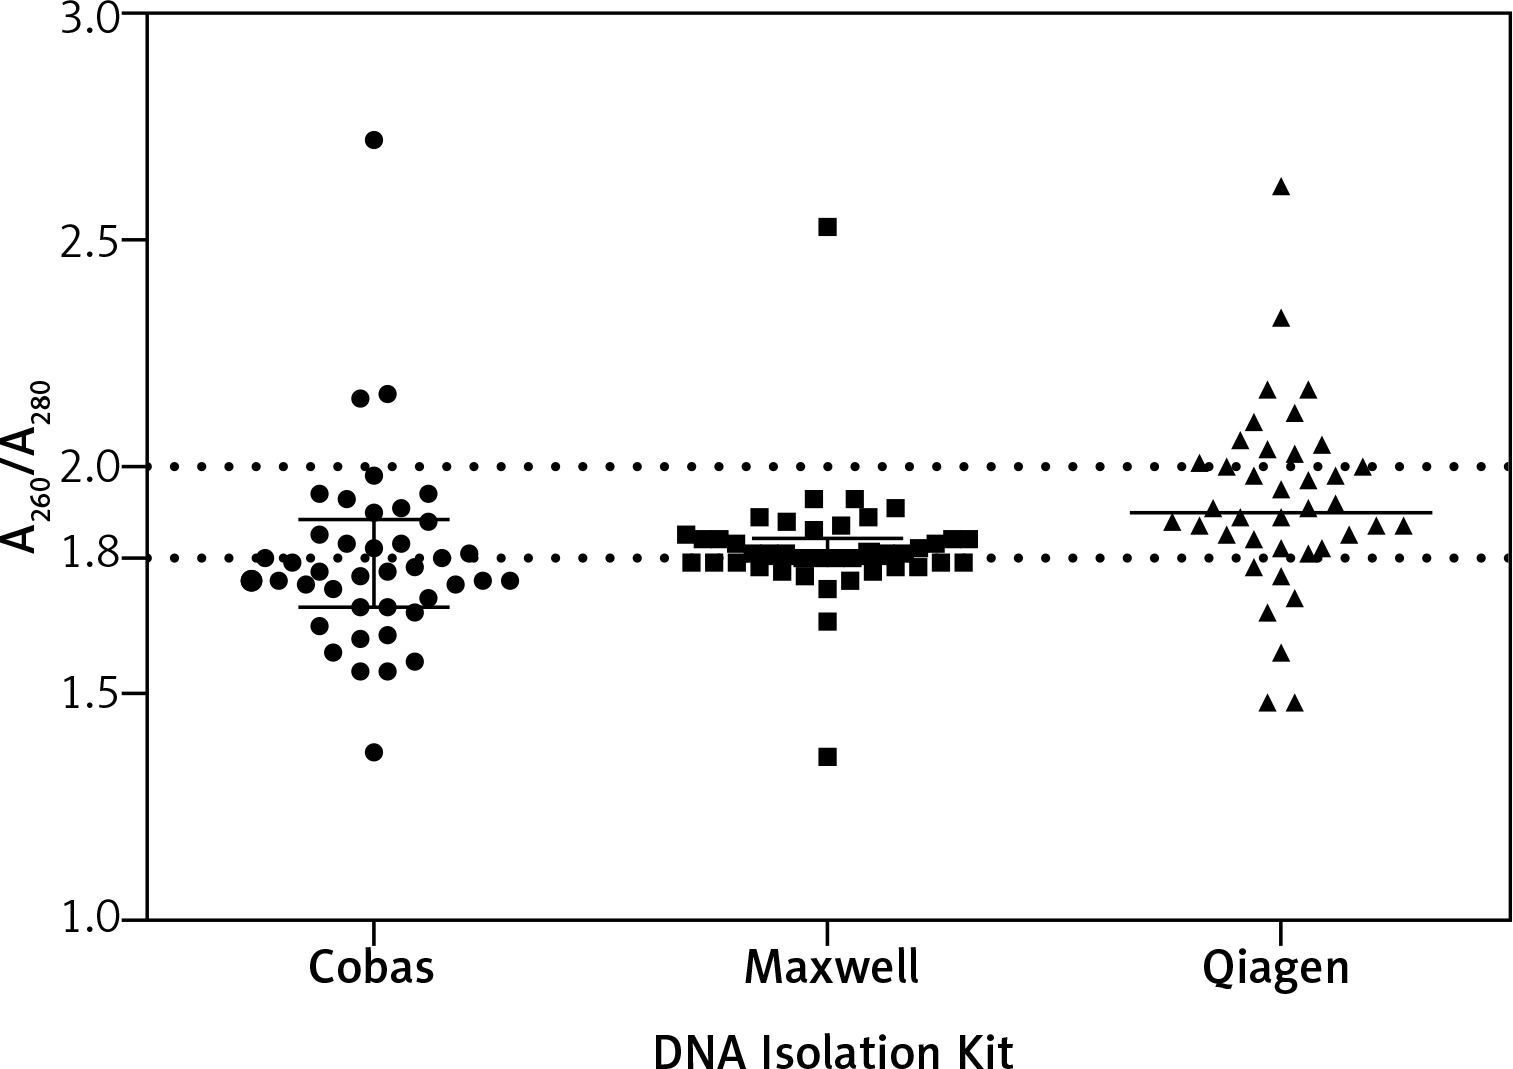
The quality of the extracted DNA samples was assessed spectrophotometrically using the ratio of absorbance at 260 nm and 280 nm (Table 1). The Maxwell DNA Purification Kit showed the best performance in terms of quality (Table 2). Twenty-six of 42 analysed samples (62%) fulfilled the purity criterion, which was A260/A280 ratio within the range of 1.8–2.0. Other methods had a lower success rate: 50 and 33% of samples could be considered of good quality for the QIAamp and Cobas methods respectively. Moreover, the Maxwell method showed the highest aggregation of similar quality data (purity 1.8–2.0 criterion) of all three methods, which can be seen in the graph (Fig. 4).
Table 2
Sample distribution frequency according to purity level criterion
| A260/A230 | 1.8–2.0 | < 1.8 | > 2.0 |
|---|---|---|---|
| Cobas | 14 | 24 | 4 |
| Maxwell | 26 | 15 | 1 |
| QIAamp | 21 | 9 | 12 |
Fig. 4
Spectrophotometric assessment of extracted DNA quality expressed as an absorbance ratio of 260 nm to 280 nm (A260/A230). Median is shown with vertical solid lines. Error bars represent IQR. Dashed lines enclose high quality DNA samples with A260/A230 ratio falling within the range 1.8–2.0. Y-axis scale was narrowed to the range 1.0–3.0 to make the graph more transparent; therefore, four outlier points are not visible on the graph
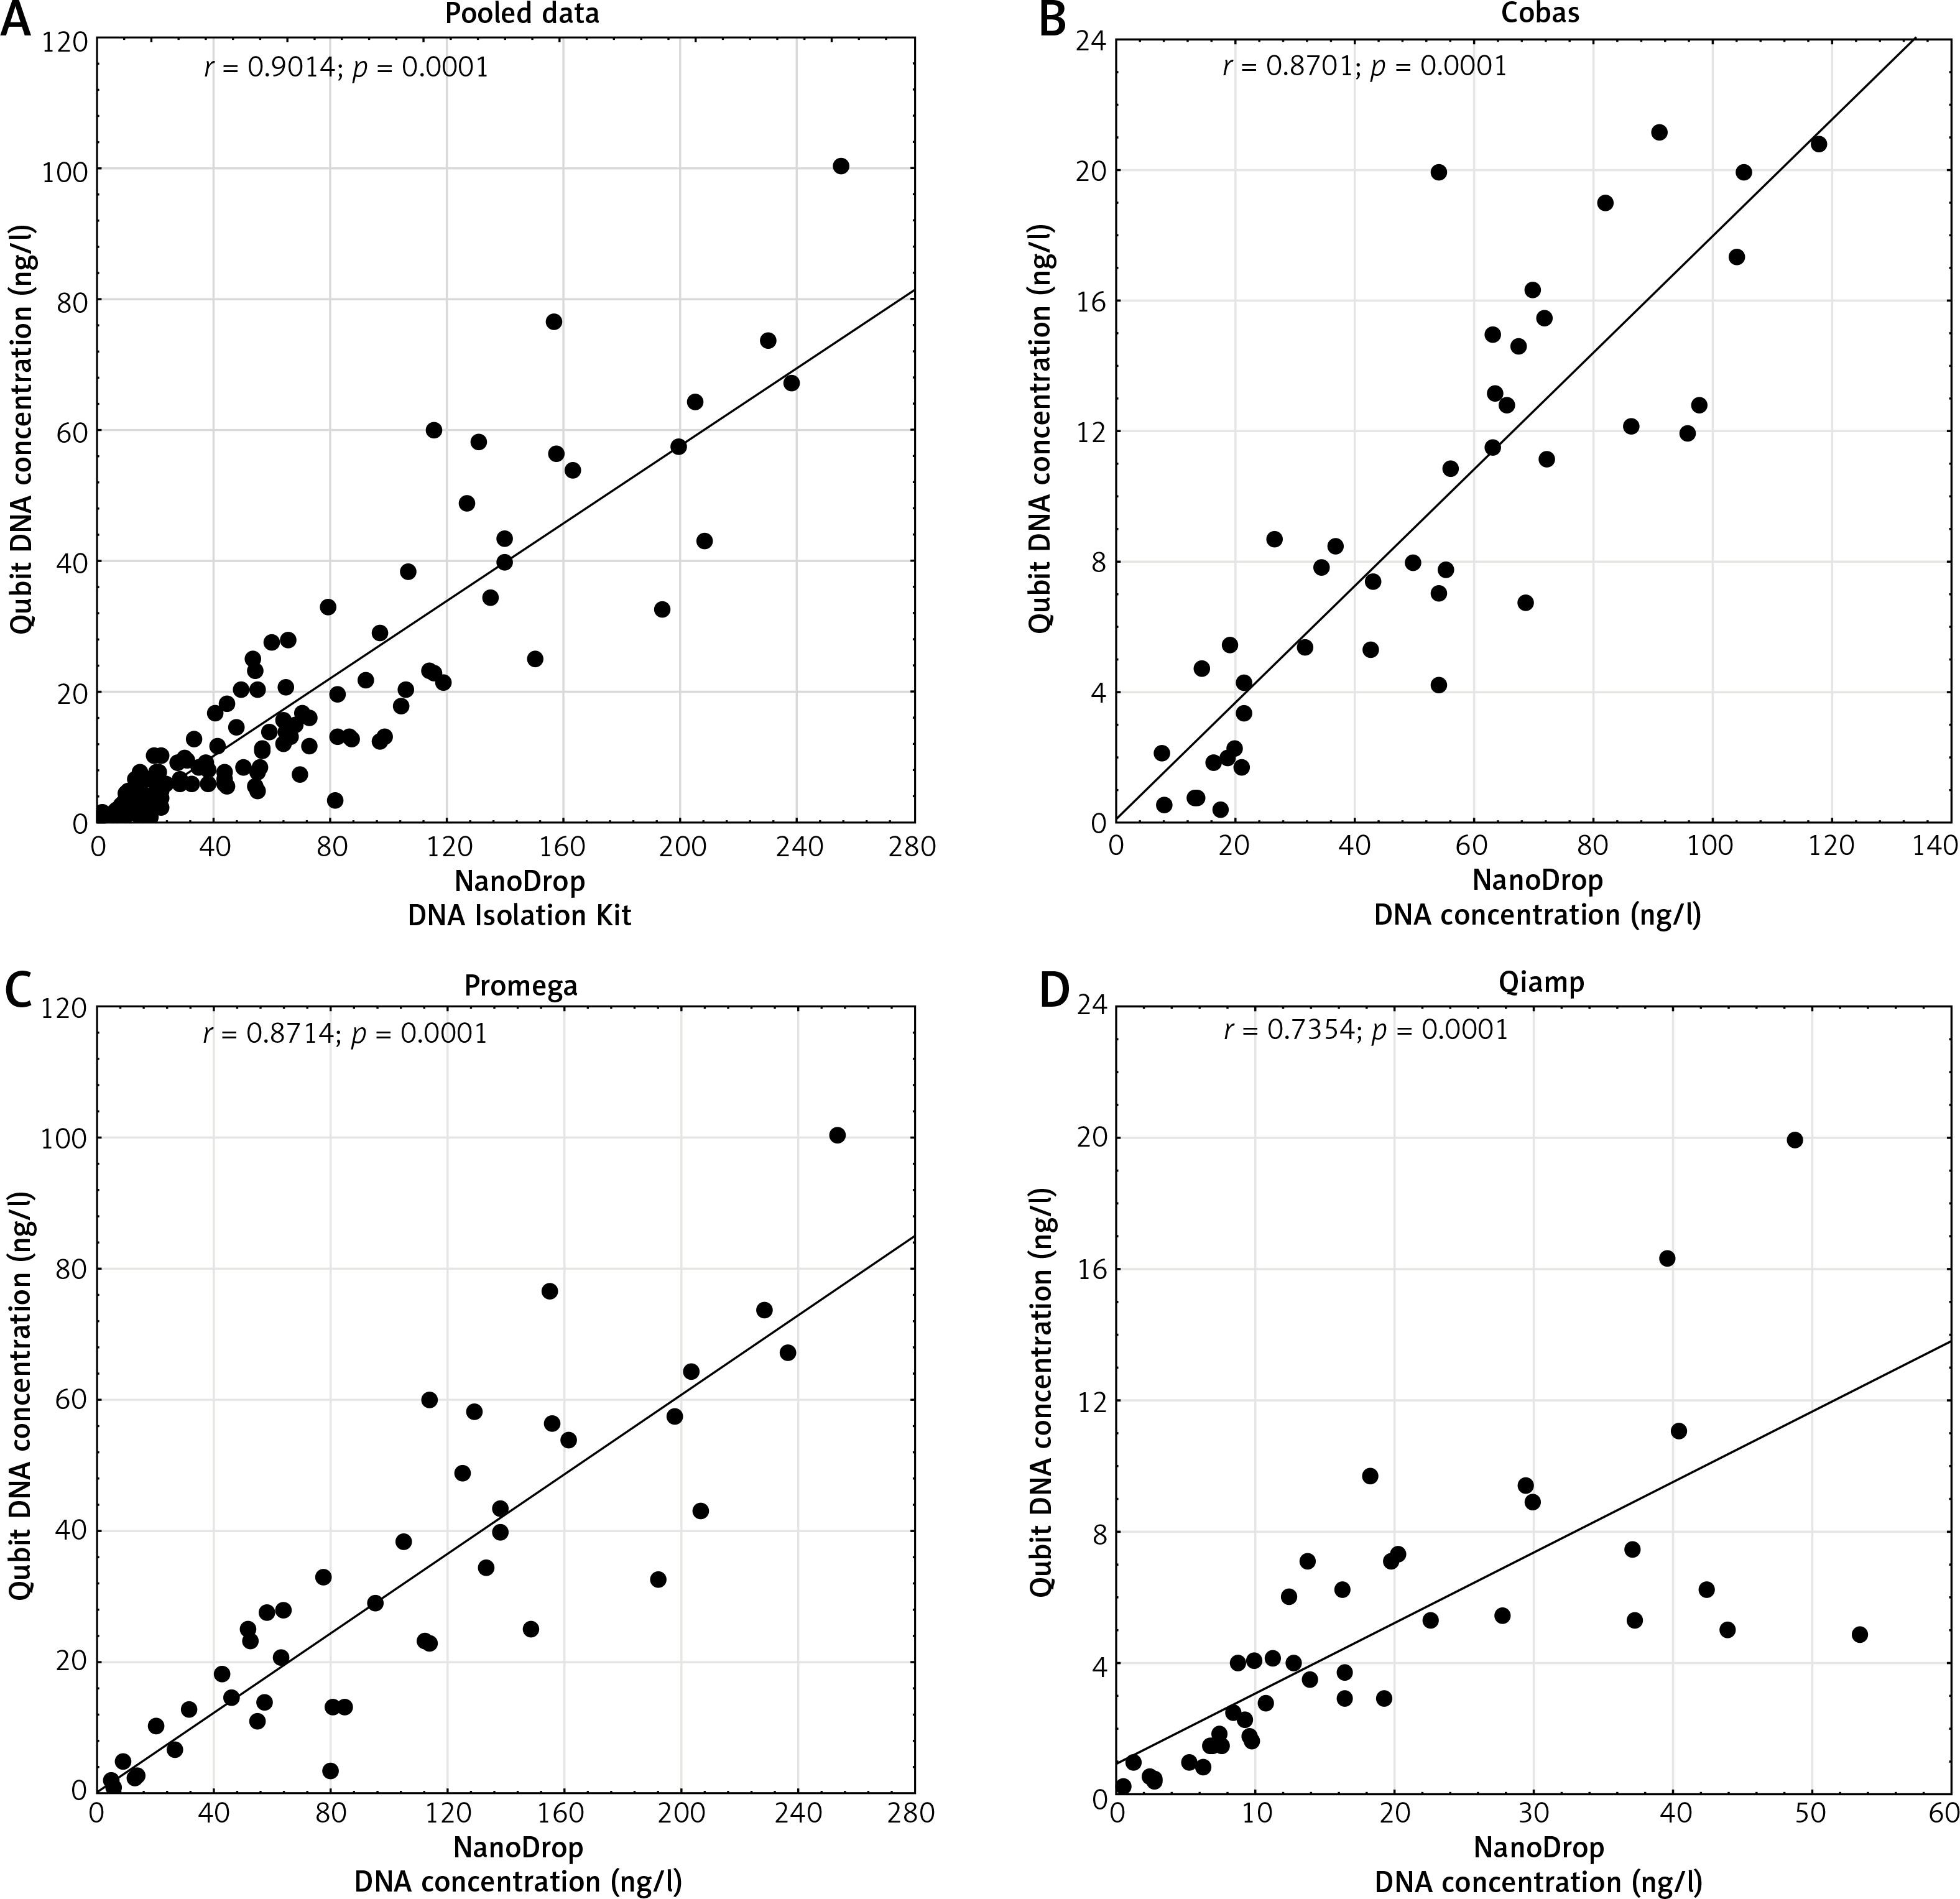
We also compared the results of DNA quantitative analysis of two implemented methods: NanoDrop and Qubit. The correlation was very strong, with the Spearman correlation coefficient exceeding 0.9 for pooled data (Fig. 5). However, the NanoDrop method gave higher readings of DNA concentration in all analysed samples, as compared to Qubit.
Discussion
In the present study, the Maxwell method of DNA extraction demonstrated the greatest performance of all compared techniques. The concentration of DNA in samples obtained in the Maxwell isolation was the highest as compared to Cobas and QIAamp, though taking differences in elution volume into account, total yield of extracted DNA was comparable to that obtained using the Cobas method. The QIAamp method was the least efficient in terms of quantity of the extracted DNA. Moreover, the isolation of DNA with the Maxwell kit resulted in the greatest number of samples that fulfilled the purity criterion (A260/A280 ratio within a range of 1.8–2.0). The Maxwell method was previously reported by Heydt et al. to be the most efficient of five tested automated methods [12]. Furthermore, fluorometric Qubit analysis showed RNA contamination in only one sample obtained with the Maxwell extraction kit. The isolates acquired with the QIAamp method turned out to be highly contaminated with RNA. The DNA samples obtained with the Cobas method showed less RNA contamination as compared to QIAamp, despite the fact that the QIAamp method implements an RNAseA incubation step. Similar findings had previously been reported by Malthora et al. [13]. High efficiency of DNA extraction and high quality of isolated samples designate the Maxwell technique as the first-choice method for DNA extraction from FFPE tissues, especially for laboratories with high throughput of samples analysed.
Although the Cobas method did not excel in the extraction of DNA from FFPE tissue samples, it proved to be indispensable for isolating DNA from small tissue materials (fine-needle biopsies, etc.). In our experience, DNA isolated from this problematic material using Cobas can be easily amplified. In contrast, the isolates obtained by the Maxwell or QIAamp methods are frequently of poor quality and unsuitable for subsequent analysis (data unpublished). Similar observations were described in the paper of Hu et al. comparing QIAamp and Cobas DNA extraction methods for studies of the EGFR gene mutations in biopsy specimens [14].
The measurement of nucleic acid concentration in the extracted samples is a very important step in diagnostics. The spectrophotometric evaluation is often used because it is easy and inexpensive. Moreover, spectrophotometric measurements provide additional information on the possible contaminants in the analysed sample. On the other hand, there is no possibility to distinguish different nucleic acid species on the basis of sample absorbance alone. The fluorometric methods, based on fluorescent dyes, such as Hoechst 33258 and PicoGreen, are more sensitive and selective. These dyes allow one to detect 10 and 25 pg of double stranded nucleic acid in 1 μl of eluate, respectively. Furthermore, the measurement is not influenced by proteins or other contaminants. The main drawbacks are the limitation to the quantitative information only and the higher costs of implementation [15].
In the present study, the DNA concentration measured with the spectrophotometric method (NanoDrop) was 0.98 to 16.60 times higher than concentrations calculated from the fluorometric measurements (2.94 to 16.60 times higher for the Cobas method, 2.05 to 6.72 times higher for the Maxwell method and 0.98 to 10.94 times higher for the QIAamp method). Higher readings of the nucleic acid concentration in the spectrophotometric method (NanoDrop) may arise from the presence of RNA in the isolates or from other impurities absorbing light at 260 nm. Therefore, the fluorometric Qubit method seems to be more accurate due to utilization of dsDNA specific dyes. A note of caution is due here. Although PicoGreen dye is not affected by contaminants, the compromised DNA integrity may impede the measurements [15–17]. There are many factors which may impair DNA in the FFPE tissue specimen. Each step of sample preparation, from collection (cold and warm ischemia, method of decalcification and size of the specimen), through fixation (buffered formalin, time, temperature) to embedding and storage (paraffin reagents, time of storage, humidity), may affect DNA quality, impeding analysis at the further stages of diagnostics [18–24]. Interestingly, quantitative analyses of DNA samples extracted from non-FFPE sources revealed concordance between spectrophotometric and fluorometric methods [25, 26]. Therefore, we conclude that the observed discrepancies between concentrations of DNA samples determined using the Nano Drop and Qubit instruments may be a result of tissue processing during FFPE core preparation. We believe that formalin fragmentation and incomplete deparaffinization are the key factors interfering in the quantitative evaluation of the extracted DNA samples. Moreover, incubation of the tissue specimens at lower temperatures (e.g. 56°C) may result in less efficient reversion of nucleic acid-protein cross-links, manifesting in DNA yield differences between distinct isolation methods [27]. In our experience, fluorometric analysis provides more reliable data for more sensitive molecular methods such as microsatellite instability (MSI) testing or next generation sequencing (NGS) (data unpublished). The NanoDrop measurements tend to be less accurate due to frequent RNA contamination of samples [25].
Conclusions
The purpose of the current research was to assess and compare the performance of three commonly used FFPE DNA extraction methods. The study is limited by the lack of information on the result of the subsequent molecular analyses, although it does offer an important insight into the influence of preanalytical processing of the archival tissue specimens. We are aware that the mixed origin of the tested FFPE samples may have increased the variance of results. Different pathology laboratories have their own fixing protocols. Moreover, the method of collection and preservation of the tissue may differ between hospitals. Nevertheless, analysis of tissue specimens obtained from different sources makes our study less prone to bias resulting from laboratory-specific deviation from common protocols. Furthermore, the mixed origin of the samples allows more general conclusions to be drawn.
The results of our present study have proved that the Maxwell method provides an advantage in terms of both yield and quality of DNA isolated from FFPE tissue specimens. However, further tests on a larger number of samples are needed to confirm its superior performance. Moreover, additional methods should be included in the design of future studies to confirm suitability of the extracted DNA samples for subsequent molecular diagnostics.


