Summary
This study investigated early changes in electrocardiographic depolarization and repolarization parameters after radiofrequency catheter ablation in patients with ventricular tachycardia due to ischemic cardiomyopathy. Ninety-six patients were retrospectively analyzed using ECG recordings obtained before and 72 h after ablation. Significant reductions were observed in QT interval, QTc interval, Tp–Te interval, Tp–Te/QT ratio and QRS–T angle, while the PR interval and QRS duration remained unchanged. These findings suggest early electrical remodeling following successful VT ablation.
Introduction
Ventricular tachycardia (VT) is a malignant ventricular arrhythmia and one of the leading causes of sudden cardiac death [1, 2]. Thus, predicting VT development in patients at risk for sudden death, such as those with ischemic cardiomyopathy, is of vital importance. In ischemic cardiomyopathy, the most important predictors of ventricular arrhythmias and sudden cardiac death are left ventricular ejection fraction (LVEF) and NYHA classification. In addition, several electrocardiographic (ECG) parameters related to ventricular depolarization and repolarization have been reported to be associated with VT in ischemic cardiomyopathy patients [1, 3–12]. These parameters include the QT interval and corrected QT interval (QTc) [6], fragmented QRS (fQRS) [7], early repolarization (ER) [8], ventricular late potentials (VLP) [9], QT dispersion (QTd) [10], QRS–T angle [11], heart rate variability (HRV) [12], T-wave alternans (TWA) [4], T-peak to T-end interval (Tp–Te), and Tp–Te/QT ratio [5, 6].
In patients with ischemic cardiomyopathy who experience recurrent VT despite ICD therapy and are refractory to medical treatment, radiofrequency ablation (RFA) is recommended [1]. During RFA therapy, multiple RF lesions, long RF lines, scar homogenization, late potential elimination, and epicardial ablation may be performed using various strategies. In all these RFA procedures, necrosis is induced not only in pathological tissue but also in viable myocardial areas. We therefore hypothesized that changes in certain myocardial regions following RFA might have effects on ventricular depolarization and repolarization parameters. To the best of our knowledge, no data exist in the literature on the effects of RFA therapy applied for VT on ventricular depolarization and repolarization parameters.
Aim
The aim of our study was to evaluate changes in measurable ventricular depolarization and repolarization parameters following RFA in patients with VT secondary to ischemic cardiomyopathy.
Material and methods
Study population
This was a retrospective paired pre-post observational study. Patients who underwent ICD implantation due to ischemic cardiomyopathy and experienced recurrent shocks caused by symptomatic VT refractory to medical therapy – and therefore underwent RFA – at Adana City Training and Research Hospital Arrhythmia Clinic between August 2018 and June 2025 were screened. A total of 112 patients with no VT recurrence during the first 3 months after VT ablation were identified. Based on prior studies and outcomes, a power analysis (80% power, p < 0.05) was conducted to determine the required sample size, which indicated that approximately 50 patients would be sufficient. Of the 112 patients who underwent successful RFA, 96 patients with ischemic cardiomyopathy-related VT were included after applying exclusion criteria. Exclusion criteria included: age ≤ 18 years, unsuccessful RFA, VT recurrence within 3 months, atrial fibrillation or flutter, severe valvular heart disease, congenital heart disease, significant renal or hepatic disease, electrolyte abnormalities, thyroid dysfunction, pregnancy or postpartum period < 3 months, chronic inflammatory disease, and active malignancy.
After inclusion, patients’ medical history, physical examination findings, and demographic characteristics were recorded. The presence of hypertension (HT), diabetes mellitus (DM), smoking, and hyperlipidemia was noted. Systolic and diastolic blood pressure, heart rate, and laboratory parameters were documented before ablation in all cases. Laboratory measurements including complete blood count, serum blood urea nitrogen, creatinine, total cholesterol, low-density lipoprotein cholesterol, high-density lipoprotein cholesterol, and triglycerides were performed using automated analyzers (Abbott Aeroset, MN, USA) with validated Abbott kits. LVEF was measured for all patients using the EPIQ 7 device (Philips Healthcare, Andover, MA, USA) based on Simpson’s method [13].
Twelve-lead electrocardiographic evaluation
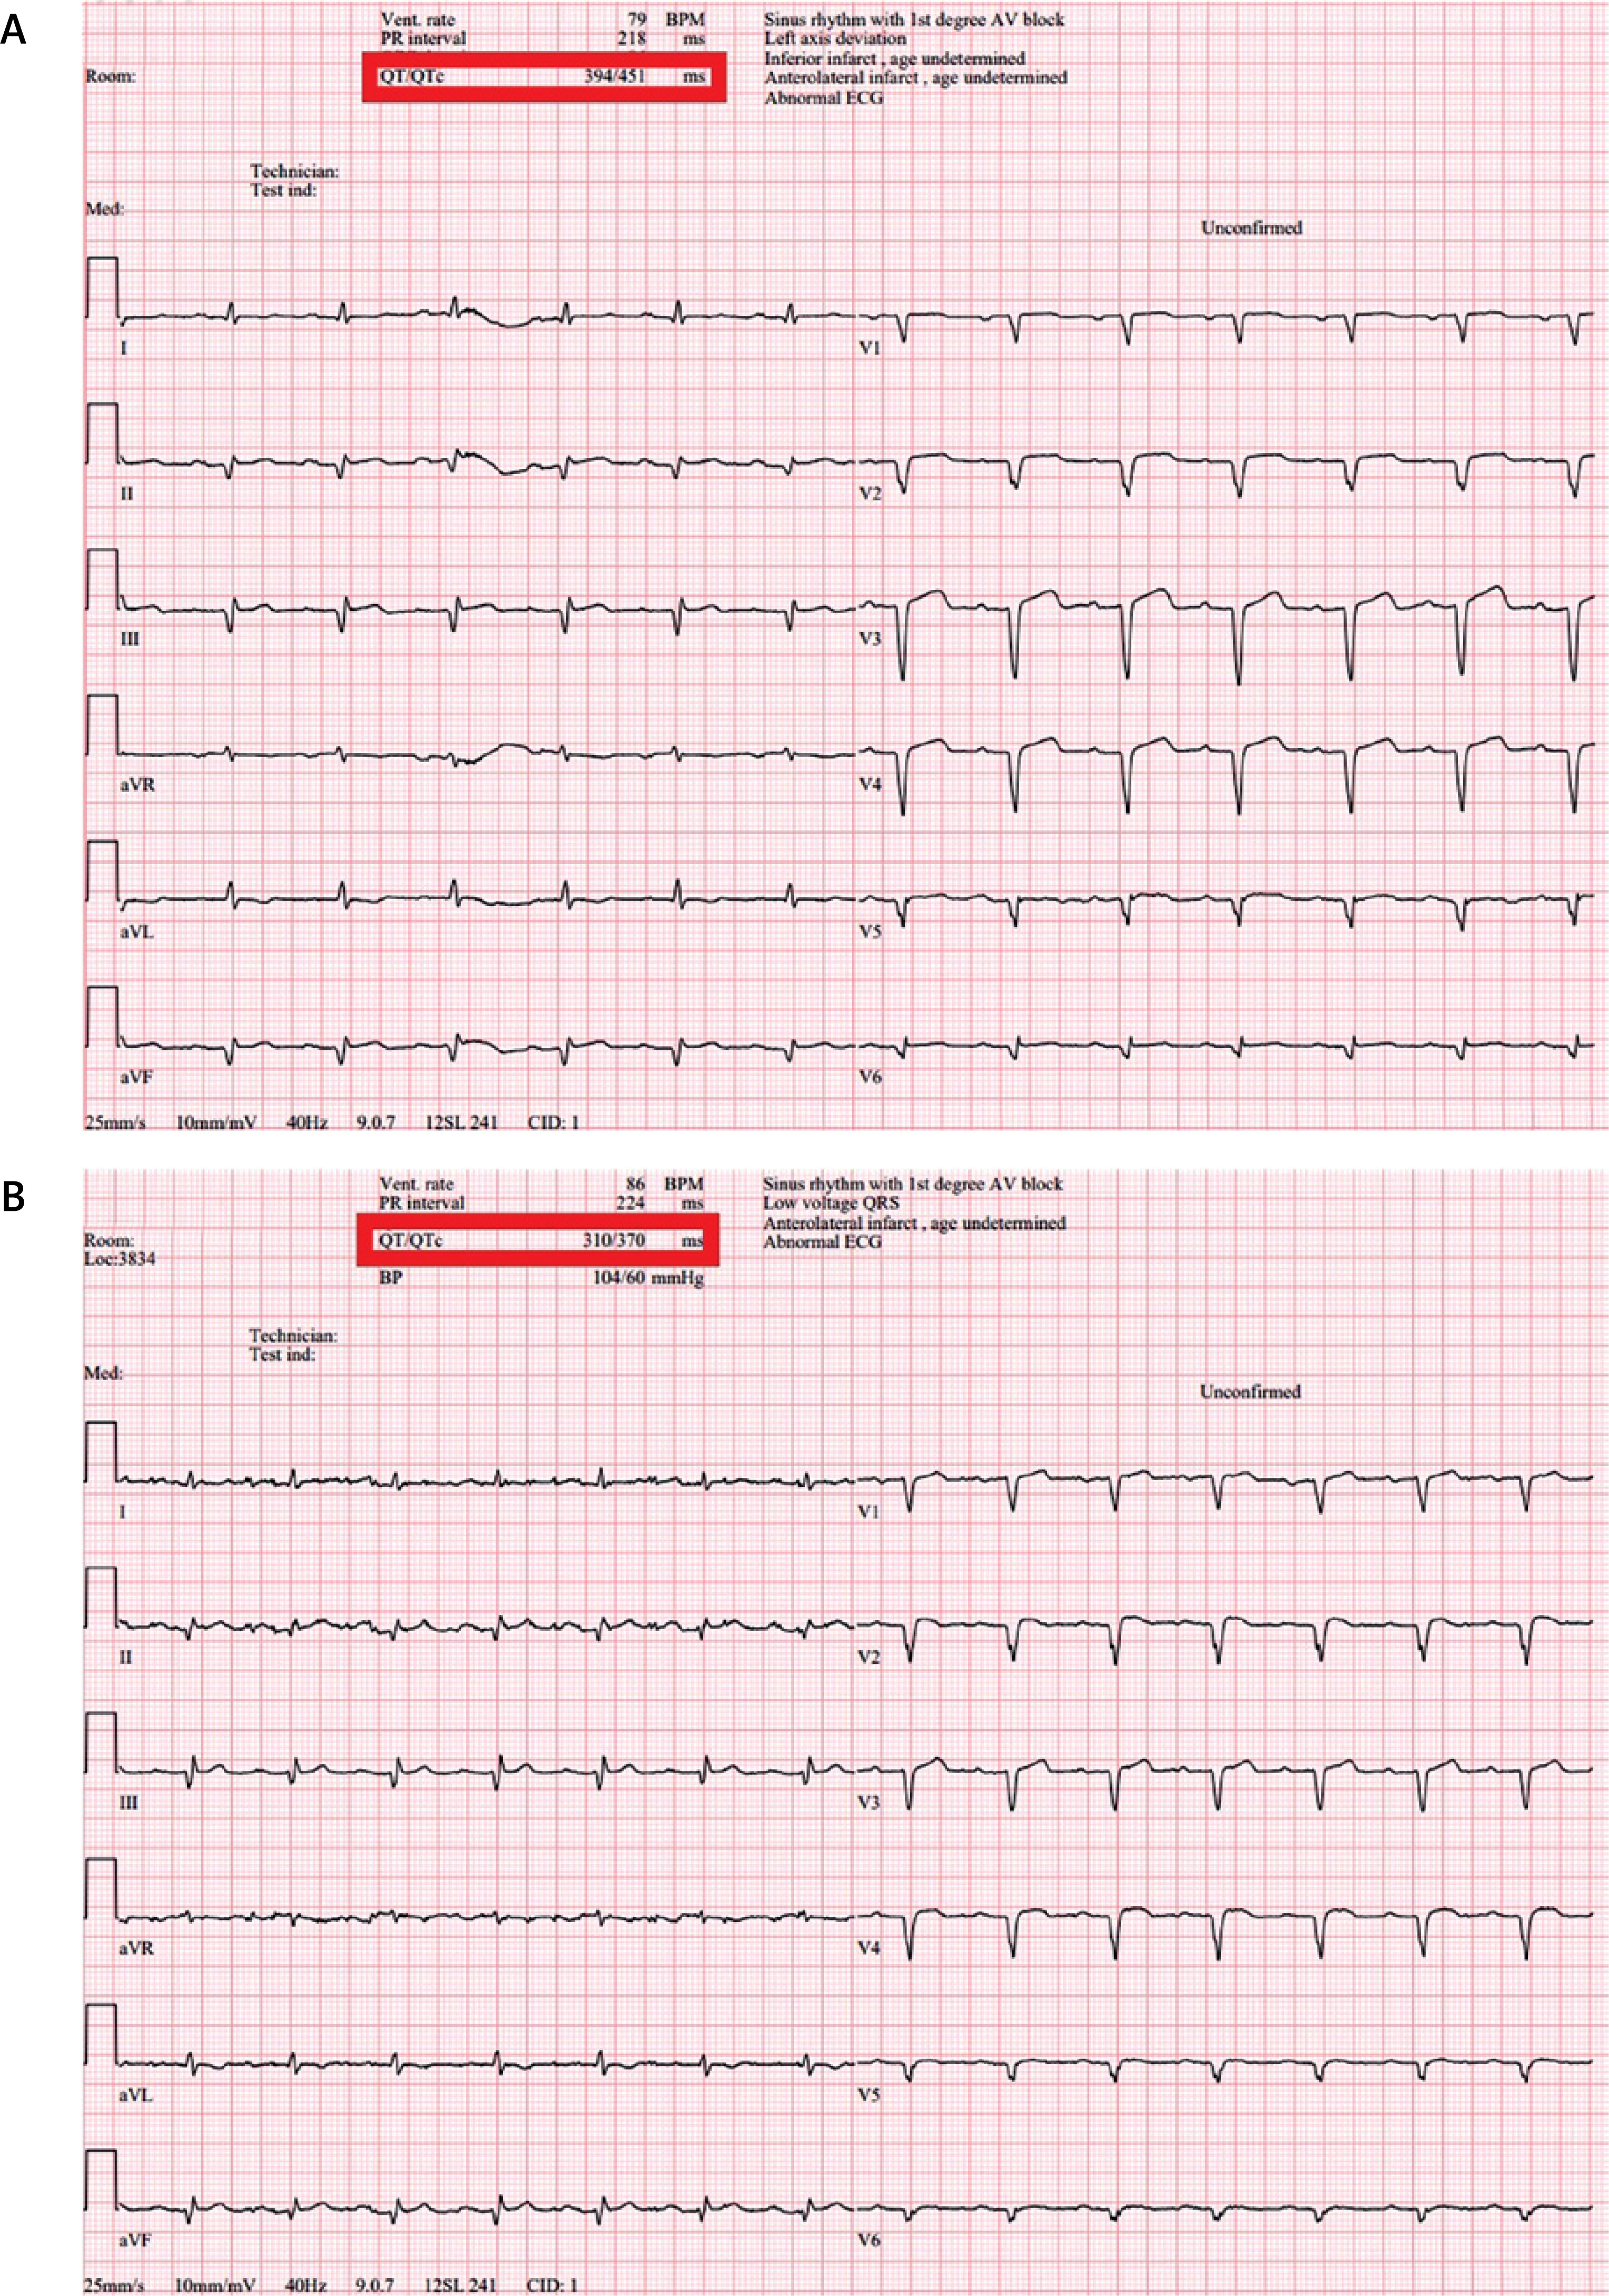
Initially, ECG recordings prior to RF ablation and 72 h after successful RF ablation were obtained from patient records. All ECGs were performed while patients were in sinus rhythm using a MAC 2000 ECG machine (GE Medical Systems Information Technologies, Inc., WI, USA) at a standard calibration of 25 mm/s speed and 1 mV/10 mm amplitude. In all patients, PR and QRS durations, QT, QTc, Tp–Te intervals, Tp–Te/QT ratio, and QRS–T angle were measured (Figure 1 A). The QT interval was measured from the beginning of the QRS complex to the point where the T wave returned to the isoelectric line. QTc was calculated using Bazett’s formula (QTc = QT/√RR). Tp–Te was defined as the interval from the peak of the T wave to the end of the T wave where it merges with the isoelectric line. Measurements were primarily performed using lead V5; if V5 was not suitable (amplitude < 1.5 mm), V4 or V6 was used. The Tp–Te/QT ratio was then calculated based on these values. The frontal QRS–T angle, which is the projection of the spatial QRS–T angle onto the frontal plane, was calculated as the absolute difference between the QRS and T wave axes. All aforementioned ECG parameters were remeasured on the 12-lead ECG obtained 72 h after ablation (Figure 1 B). All ECG analyses in sinus rhythm were evaluated in a blinded manner by two experienced electrophysiologists (FK and AEC), each with over 10 years of experience and evaluating ≥ 2000 arrhythmia patients annually. In the event of discrepancy between the two electrophysiologists, a third and senior electrophysiology expert (MK) was consulted for consensus.
Figure 1
A – Measurement of electrocardiographic parameters before radiofrequency ablation (RFA) procedure (increased ventricular depolarization and repolarization parameters). B – Measurement of electrocardiographic parameters after RFA procedures (normalized ventricular depolarization and repolarization parameters)
Electrophysiological study and radiofrequency ablation protocol for VT
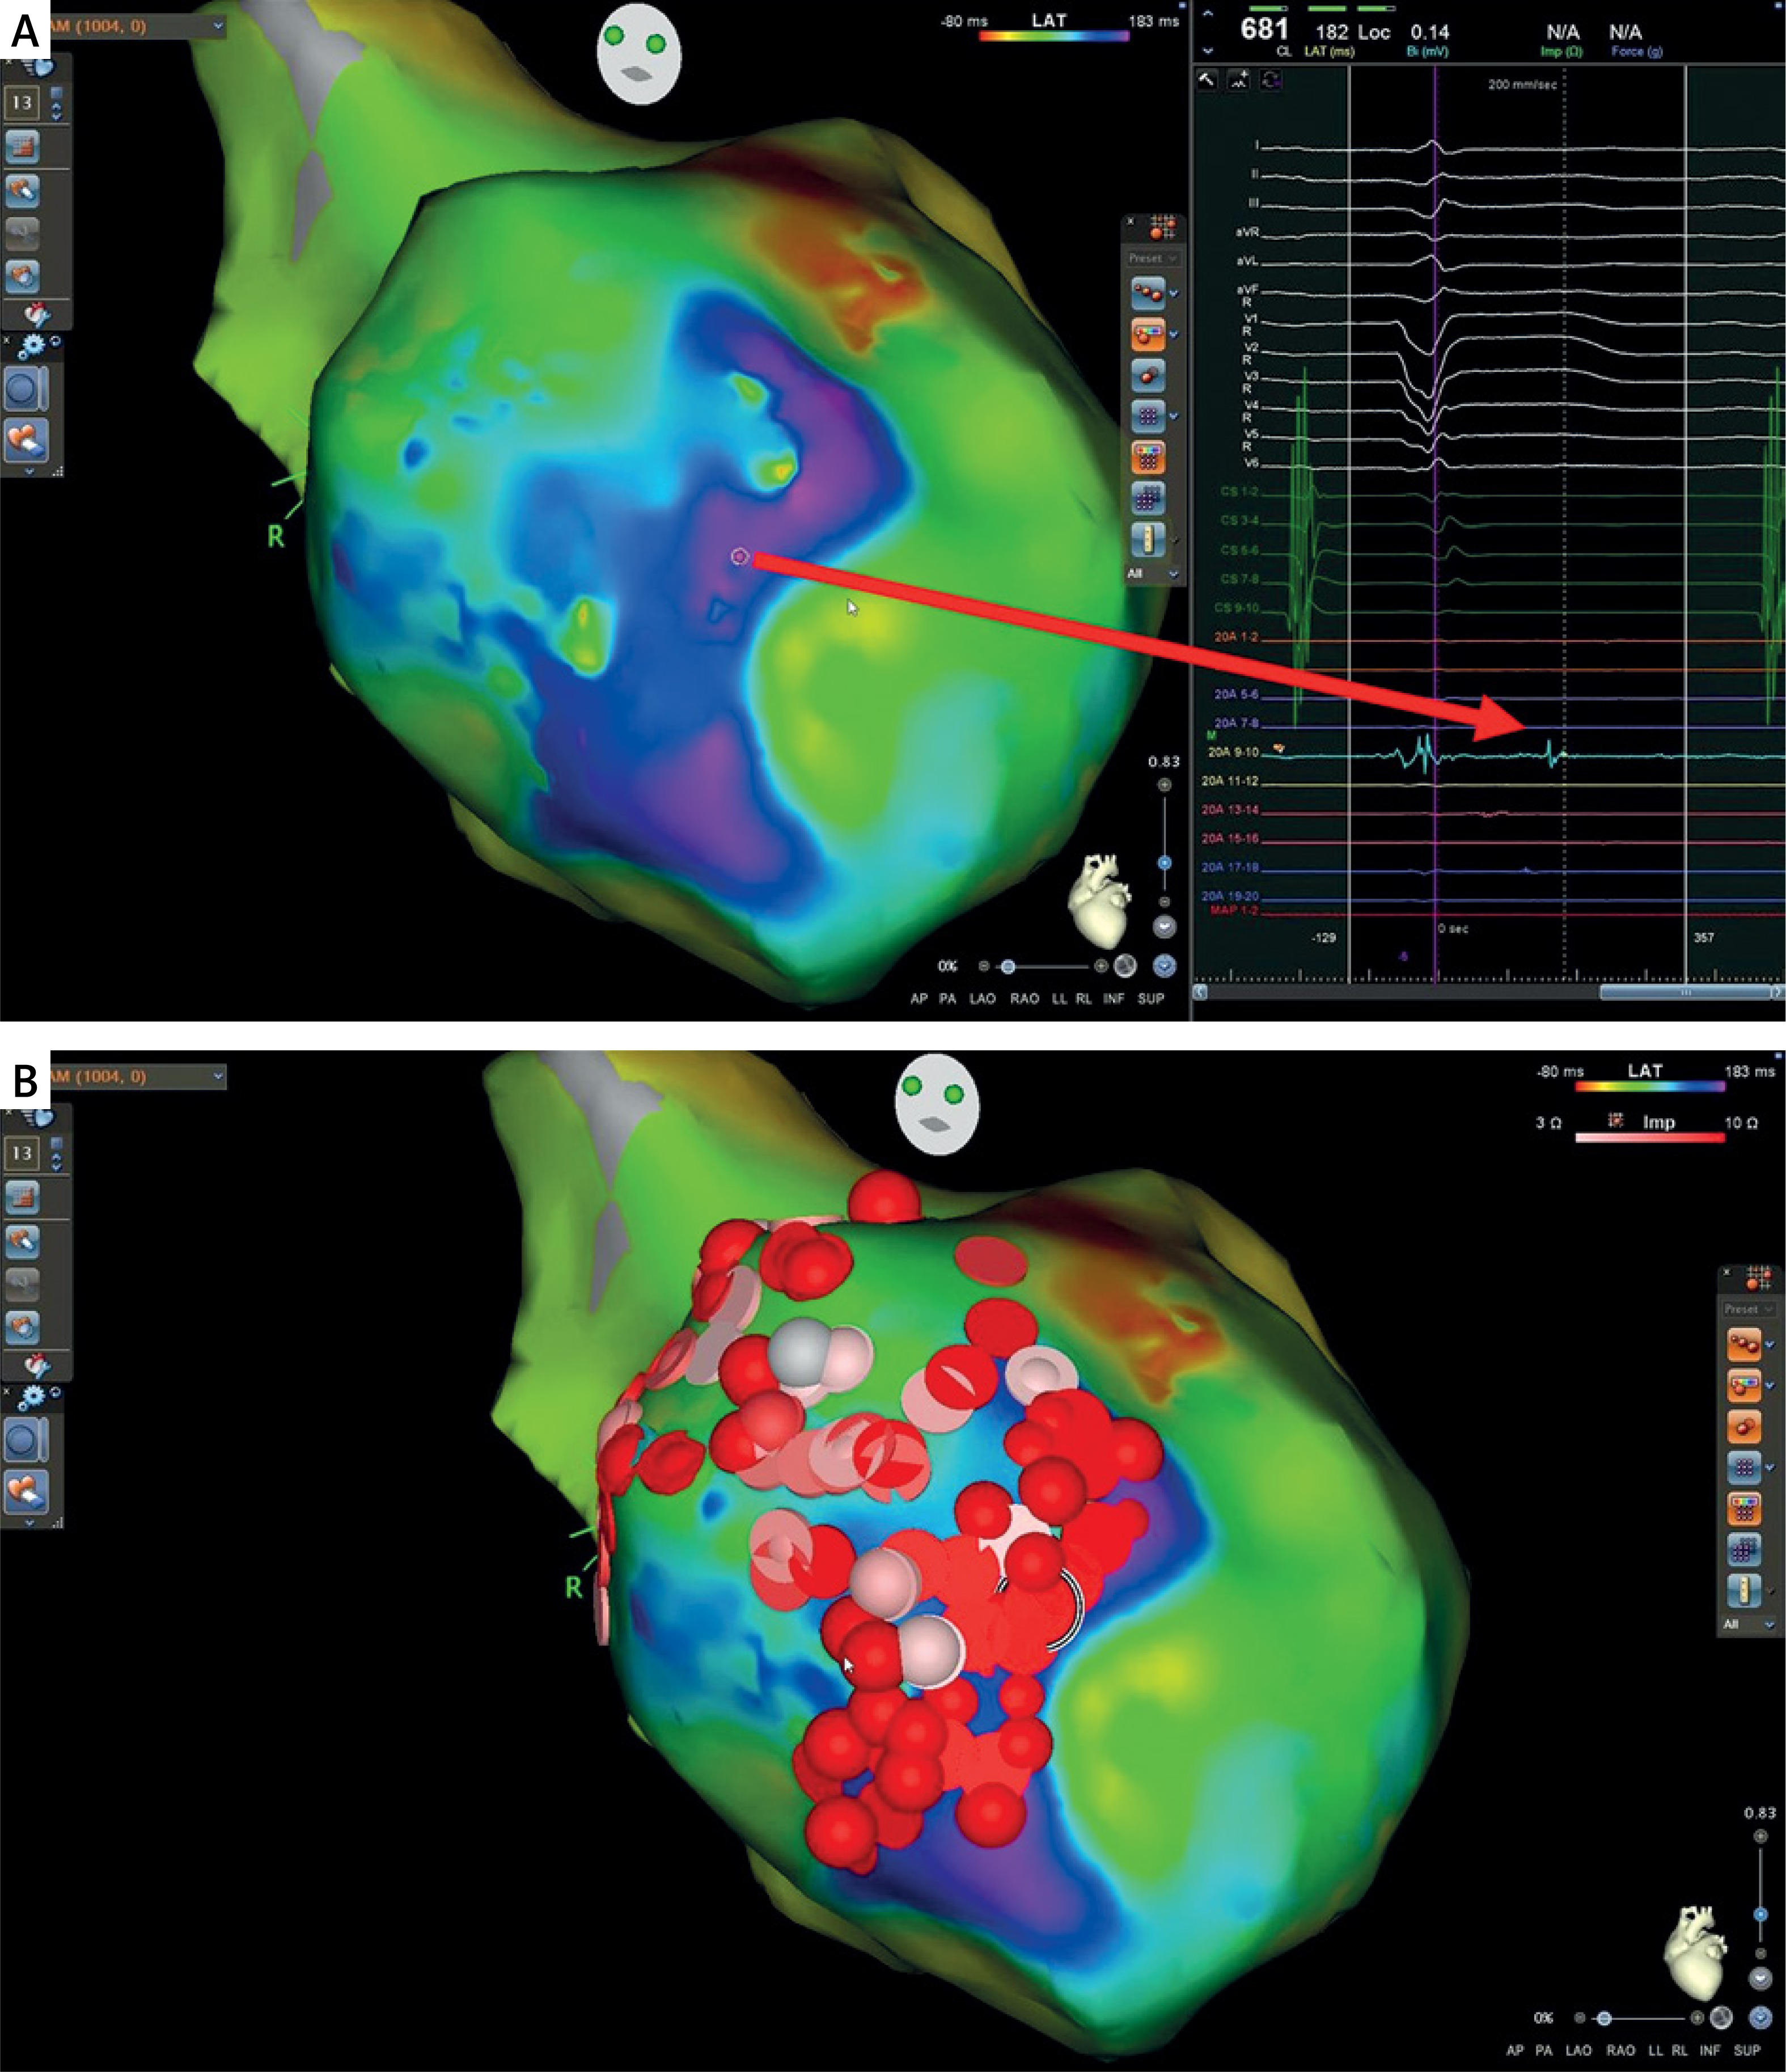
All patients underwent EPS after a washout period of at least 5 half-lives of antiarrhythmic medications. VT ablation procedures were performed under general anesthesia. All procedures were conducted using the WorkMate Claris system (St. Jude Medical, St. Paul, Minnesota). Bilateral inguinal regions were prepared for the EPS procedure. Two diagnostic catheters (quadripolar and decapolar) were placed via the left femoral vein – one into the high right atrium–right ventricle and the other into the coronary sinus. Via the right femoral vein, transseptal access to the left atrium was obtained, and a steerable sheath (Agilis NxT 8.5F, St. Jude Medical, St. Paul, MN) was inserted. A non-steerable long sheath (PREFACE 8F, Biosense Webster, CA, USA) was inserted into the femoral artery to allow retrograde transaortic access to the left ventricle (LV). Both anatomical and electrical mapping of the LV were performed using high-resolution mapping catheters (PentaRay, Biosense Webster, CA, USA and Advisor HD Grid, Abbott, Abbott Park, IL, USA) via both transaortic and transseptal routes. For VT ablation, irrigated RF catheters such as ThermoCool SmartTouch SF/ThermoCool SF (Biosense Webster, Diamond Bar, CA, USA) or TactiCath (Abbott, Abbott Park, IL, USA) were used. Heparin (50–100 IU/kg) was administered to all patients based on body weight, and the activated clotting time was maintained between 300 and 500 s throughout the procedure. If VT could not be induced, intravenous isoproterenol (1–5 μg/min) was infused. VT mapping was performed using 3D mapping systems (CARTO 3, Biosense Webster, Diamond Bar, CA and EnSite X, Abbott, Abbott Park, IL, USA). In all patients, voltage and ILAM mapping was performed during sinus rhythm (Figure 2 A). If VT was inducible and hemodynamically tolerated, activation mapping was also conducted. Critical isthmus areas responsible for VT were then identified. Ablation was delivered using irrigated RF catheters to the targeted tissue based on the characteristics of the substrate and the proximity of surrounding cardiac structures (Figure 2 B). Energy was applied at 30 to 50 W for more than 3 min until PVCs disappeared or VT was terminated and local impedance dropped to < 10 Ω. Following ablation, isoproterenol infusion and programmed stimulation maneuvers were used to assess for VT recurrence. If epicardial origin of VT was suspected, epicardial ablation was performed. Epicardial puncture was performed using the Sosa technique, and a steerable sheath (Agilis EPI 8.5F, St. Jude Medical, St. Paul, MN) was inserted into the pericardial space for mapping and ablation.
Statistical analysis
All statistical analyses were performed using SPSS Statistics for Windows, version 23.0 (IBM Corp., Armonk, NY, USA). Continuous variables were expressed as mean ± standard deviation, and categorical variables were presented as frequencies and percentages. The Kolmogorov–Smirnov test was used to assess the normality of continuous variables. For comparison of pre- and post-RFA measurable ECG and LVEF parameters, the paired t-test was used for normally distributed variables, and the Wilcoxon signed-rank test was used for non-normally distributed variables. A p-value < 0.05 was considered statistically significant for all comparisons.
Results
A total of 96 patients (16 female, 80 male; mean age: 65.8 ±10.6 years) who underwent VT ablation due to ischemic cardiomyopathy were included in this study. All patients underwent 12-lead ECG and echocardiographic LVEF measurements immediately before VT ablation. The ECG parameters measured included PR and QRS durations, QT and QTc intervals, Tp–Te interval, Tp–Te/QT ratio, and QRS–T angle.
Demographic, clinical, and laboratory characteristics of the study population are presented in Table I. Among the patients screened for the study, 16 met the exclusion criteria. Of these, 10 had atrial fibrillation or flutter, 1 had severe aortic stenosis, 2 had advanced chronic kidney disease, 1 had electrolyte abnormalities, 1 had active malignancy, and 1 had thyroid dysfunction. The majority of the study population was male (80 male and 16 female). The prevalence of cardiovascular risk factors was 86% for hypertension, 40% for diabetes mellitus, 23% for smoking, and 66% for hyperlipidemia. There was no significant change in LVEF before and after RFA (33.6 ±9.8 vs. 34.1 ±8.5, Z = –1.356, p = 0.195).
Table I
Demographic, clinical, and laboratory characteristics of the study population
Comparison of PR and QRS durations, QT and QTc intervals, Tp–Te interval, Tp–Te/QT ratio, and QRS–T angle before and after RFA is provided in Table II. PR and QRS durations were similar before and after RFA. However, significant reductions were observed in QT interval (426 ±33 vs. 409 ±31 ms), QTc interval (441 ±18 vs. 424 ±17 ms), Tp–Te interval (89 ±16 vs. 80 ±16 ms), Tp–Te/QT ratio (0.21 ±0.04 vs. 0.20 ±0.04), and QRS–T angle (93 ±51 vs. 72 ±45°;).
Table II
Comparison of 12lead electrocardiographic measurements before and after radiofrequency ablation
| Variables | Baseline measurements n = 96 | Measurements after RFA n = 96 | t and Z value | P-value |
|---|---|---|---|---|
| PR duration [ms] | 161 ±19 | 167 ±22 | −1.775t | 0.079a |
| QRS duration [ms] | 116 ±28 | 119 ±34 | −1.060Z | 0.292b |
| QT interval [ms] | 426 ±33 | 409 ±31 | 10.734t | < 0.001a |
| QTc interval [ms] | 441 ±18 | 424 ±17 | 15.439t | < 0.001a |
| JT interval [ms] | 310 ±34 | 290 ±33 | 6.128t | < 0.001a |
| Tp–Te interval [ms] | 89 ±16 | 80 ±16 | 17.758t | < 0.001a |
| Tp–Te/QT ratio | 0.21 ±0.04 | 0.20 ±0.04 | 8.268t | < 0.001a |
| QRS–T angle [º] | 93 ±51 | 72 ±45 | 5.916Z | < 0.001b |
Discussion
The most significant finding of our study is the observation that early after RFA therapy in patients with ischemia-induced VT, there is a statistically significant reduction in ventricular depolarization and repolarization parameters including QT, QTc, Tp–Te intervals, Tp–Te/QT ratio, and QRS–T angle. This information is novel and makes an important contribution to the literature regarding the significance of VT ablation.
In patients with ischemic cardiomyopathy, several ventricular depolarization and repolarization parameters have been associated with VT risk. Some of these include the presence of VLP, fQRS, and ER, increases in QT, QTc, QTd, TWA, Tp–Te, Tp–Te/QT ratio, and QRS–T angle, and decreases in HRV [1, 3–12]. These ECG parameters can be classified as morphological (40%) and measurable (60%) [3]. In our study, to demonstrate the effect of RFA objectively, we focused on the majority of measurable parameters (QT, QTc, Tp–Te, Tp–Te/QT, QRS–T angle).
Among these, QT and QTc intervals are indicators of ventricular activation time (depolarization and repolarization). However, these two parameters alone do not reflect ventricular repolarization dispersion. QT and QTc prolongation have been shown to be associated with VT development in patients with ischemic cardiomyopathy and myocardial infarction [14]. Although threshold values for QT and QTc may vary with age and sex, a QTc > 460 ms is generally considered prolonged.
The Tp–Te interval and Tp–Te/QT ratio are associated with transmural dispersion of repolarization (TDR) [15, 16]. The Tp point reflects repolarization of epicardial cells, whereas the Te point indicates the completion of myocardial repolarization [17]. Increased TDR is linked to increased risk of ventricular arrhythmia [18]. A prolonged Tp–Te interval is a significant predictor of VT in patients with prior myocardial infarction and ICDs [5, 18, 19]. Tp–Te interval > 100 ms and Tp–Te/QT ratio ≥ 0.25 are considered abnormal and have been associated with VT [5, 6, 18, 20].
Similarly, the QRS–T angle is related to TDR, such as the Tp–Te interval. The QRS–T angle reflects the relationship between the vectors of ventricular depolarization and repolarization and is calculated as the angle between the QRS axis and T wave axis [21]. Increased QRS–T angle has prognostic importance, especially when associated with abnormal T wave axis, which may reflect malignant ventricular repolarization responsible for fatal arrhythmias [11, 22].
One of the treatment options for VT patients is RFA. The choice and extent of RFA strategy are closely related to the type of VT and the underlying substrate. In patients with ischemic cardiomyopathy, multiple RFA lesions or long ablation lines are often required for a successful outcome. In some cases, scar homogenization and epicardial RFA may also be necessary. However, RFA therapy leads to necrosis and tissue damage in both endocardial and epicardial regions. This has raised concerns that such tissue loss could result in early decline in LVEF in patients who already have reduced LVEF. Nevertheless, prior limited studies have shown that VT ablation does not significantly affect LVEF in patients with ischemic cardiomyopathy [23, 24]. Our study findings are consistent with the literature in this regard.
Pathophysiological changes such as regional transmural tissue injury and elimination of late potentials after RFA may affect cardiac electrical activity and thereby alter ventricular depolarization and repolarization parameters. To the best of our knowledge, the short- and long-term effects of RFA therapy on the abnormal ventricular depolarization and repolarization parameters responsible for VT have not been previously defined. Therefore, our study presents a valuable contribution. Although we observed significant reductions in QT, QTc, Tp–Te intervals, Tp–Te/QT ratio, and QRS–T angle, a precise pathophysiological explanation for these findings cannot be definitively provided.
Changes in ventricular depolarization and repolarization following VT ablation may be explained by several mechanisms. First and foremost, one of the primary targets of VT ablation is the complete elimination of late potentials. The local delayed depolarization and prolonged repolarization observed in regions harboring late potentials may be resolved following successful ablation of these areas. The elimination of these delayed conduction zones may, in turn, be reflected on the surface electrocardiogram. A second important mechanism may involve the homogenization of depolarization, particularly within re-entry circuits targeted during VT ablation. This may facilitate a more uniform, synchronous, and coordinated propagation of electrical activity throughout the myocardial tissue. A third potential mechanism is sympathetic denervation resulting from perivascular sympathetic nerve injury in the ablation regions. This may contribute to shortening of ventricular depolarization and, more prominently, repolarization parameters. A fourth and less common mechanism may include factors such as cardiac memory following VT episodes or acute ischemia, as well as peri-procedural changes in medication or electrolyte status. However, in our study, all medications known to affect ventricular depolarization and repolarization were discontinued at least five half-lives prior to the procedure, and stable electrolyte levels were ensured in all patients. Further prospective studies are warranted to clarify and validate this proposed mechanism.
This study has several important limitations. It was conducted retrospectively at a single center. Patients with atrial fibrillation were excluded, as atrial fibrillation may independently affect ventricular depolarization and repolarization and interfere with certain ECG measurements. However, it is well known that atrial fibrillation is common in patients with heart failure. Only patients with ischemic VT were included in the study; those with non-ischemic VT were not. Therefore, our findings may not be applicable to patients with non-ischemic cardiomyopathy. Another major limitation is that we did not assess the long-term effects of RFA on ventricular depolarization and repolarization. Such an evaluation would have added further value to our findings. In the present study, QTc was calculated using Bazett’s formula. However, given that post-treatment heart rate may differ from baseline values, Bazett’s correction is known to potentially overestimate or underestimate QTc depending on heart rate variability. Therefore, a sensitivity analysis employing alternative correction formulas, such as Fridericia’s formula, would have provided a more methodologically robust assessment.
Conclusions
Our study demonstrated that in patients with VT secondary to ischemic cardiomyopathy, RFA therapy is associated with significant early reductions in ventricular depolarization and repolarization parameters, including QT, QTc, Tp–Te intervals, Tp–Te/QT ratio, and QRS–T angle. Successful VT ablation was associated with early changes in the selected ECG markers in our study; however, these findings are hypothesis-generating in nature and are not yet applicable to routine clinical practice. However, to establish the routine use of these parameters, larger-scale, multicenter, randomized studies are necessary to validate our findings.