
Introduction
Liver failure (LF) is a severe liver dysfunction caused by various etiologies, resulting in significant impairments in synthetic, detoxification, metabolic, and biotransformation functions. Clinical manifestations primarily include jaundice, coagulation dysfunction, hepatorenal syndrome, hepatic encephalopathy, and ascites. LF is characterized by critical conditions with numerous complications. Due to its high mortality rate, poor prognosis, and treatment challenges, it remains a significant focus in clinical research. The Artificial Liver Support System (ALSS) has been widely applied clinically, with multiple studies demonstrating its safety and efficacy in LF treatment [1–3]. Among ALSS modalities, the dual plasma molecule adsorption system combined with partial plasma exchange (DPMAS-PPE) has gained increasing clinical application [4, 5].
In the process of liver disease, the body activates cellular immunity along with a series of immune cells, and secretes pro-inflammatory and anti-inflammatory cytokines. Consequently, a large number of pro-inflammatory factors accumulate in the liver, thereby inducing an inflammatory cascade reaction in the body, causing secondary damage to the liver and leading to liver failure. These cytokines include hypoxia-inducible factor-2α (HIF-2α) [6], granulocyte-colony stimulating factor (G-CSF), interleukin (IL)-6, IL-33, epidermal growth factor (EGF), stromal cell-derived factor-1α (SDF-1α) and stromal cell-derived factor-1β (SDF-1β). Research has shown that HIF-2α is closely related to LF. The stability of HIF-2α in liver macrophages can produce liver protective effects, thereby protecting liver cells from damage [7]. G-CSF is mainly composed of endotoxins and tumor necrosis factor α (TNF-α) and interferon γ (IFN-γ). It can activate monocytes and macrophages, and research suggests that G-CSF has a good therapeutic effect on LF. The production and release of pro-inflammatory mediators such as IL-6 maintain a balance of pro-inflammatory and anti-inflammatory factors. If this mechanism is disrupted, the body will release a large amount of inflammatory factors, which will kill not only viruses (pathogenic microorganisms) but also a large number of normal cells.
Interleukin 6 is closely related to the occurrence of infection and the progression of the disease. In addition, there are endogenous cytokines such as IL-33, which is cleaved into a cytokine functional form and released when liver cells are damaged, acting as a warning signal. IL-33 can also synergistically promote TNF with lipopolysaccharide α (LPS-α), IL-6, IL-1β, amplifying pro-inflammatory activity. In addition, EGF binds to EGFR receptors to promote cell growth, proliferation, and differentiation [8]. After liver injury, extensive accumulation of extracellular matrix components may ultimately lead to cirrhosis and liver failure. SDF-1 is a class of factors that can promote the migration of bone marrow stem cells (BMSCs) to tissues and organs such as the liver, cardiovascular system, and nerves. Also known as chemokine C-X-C motif chemokine ligand 12 (CXCL12), its receptor is CXC chemokine receptor 4 (CXCR 4). There are two main subtypes of SDF-1: SDF-1α and SDF-1β. The ability to fully repair and regenerate after liver injury is a unique phenomenon, with significant expression of related chemokines and growth factors. The sensitivity and specificity of these cytokines in the progression of liver disease are the focus of this study. This research collected data from patients diagnosed with LF at our hospital, including their serum levels of HIF-2α, G-CSF, IL-6, IL-33, EGF, SDF-1α, and SDF-1β. Using these data, along with clinical tests and serum biochemistry results, research assessed the levels of HIF-2α, G-CSF, IL-6, IL-33, EGF, SDF-1α, and SDF-1β in LF patients before and after treatment. We observed and analyzed the changes in these levels to evaluate their relationship with the short-term prognosis of LF patients, thereby better assessing treatment effectiveness and prognosis.
Material and methods
Source of research cases
This research was an observational study. This study selected 150 LF patients who were hospitalized in the Hepatology Department of Ruikang Hospital Affiliated to Guangxi University of Chinese Medicine between January 2018 and June 2022. Liver failure is defined according to the Diagnosis and Treatment Guidelines for Liver Failure (2018 Edition) [9]:
Acute liver failure (ALF): acute onset, no history of underlying liver disease, and liver failure characterized by grade II or above hepatic encephalopathy within 2 weeks;
Subacute liver failure (SALF): acute onset, no history of underlying liver disease, and clinical manifestations of liver failure appear at 2-26 weeks;
Chronic-an-acute liver failure (ACLF): acute liver decompensation and liver failure occurring in the short term on the basis of chronic liver disease;
Chronic liver failure (CLF): chronic liver function decompensation characterized by recurrent ascites and/or hepatic encephalopathy, resulting from progressive decline in liver function on the basis of cirrhosis.
Inclusion criteria
Age between 18 and 80 years, regardless of gender;
Compliance with the 2018 Chinese Medical Association Infectious Disease Branch Liver Failure and Artificial Liver Group, and the Chinese Medical Association Liver Disease Branch Severe Liver Disease and Artificial Liver Group Liver Failure Diagnosis and Treatment Guidelines.
Exclusion criteria
Concurrent multiple organ dysfunction upon admission;
Patients with other serious diseases unsuitable for artificial liver treatment, such as uncontrolled active bleeding or disseminated intravascular coagulation;
Individuals highly allergic to drugs or blood products used in artificial liver treatment, such as plasma or protamine;
Pregnant or lactating women;
Patients with a history of mental illness, poor self-control, and long-term use of antidepressants.
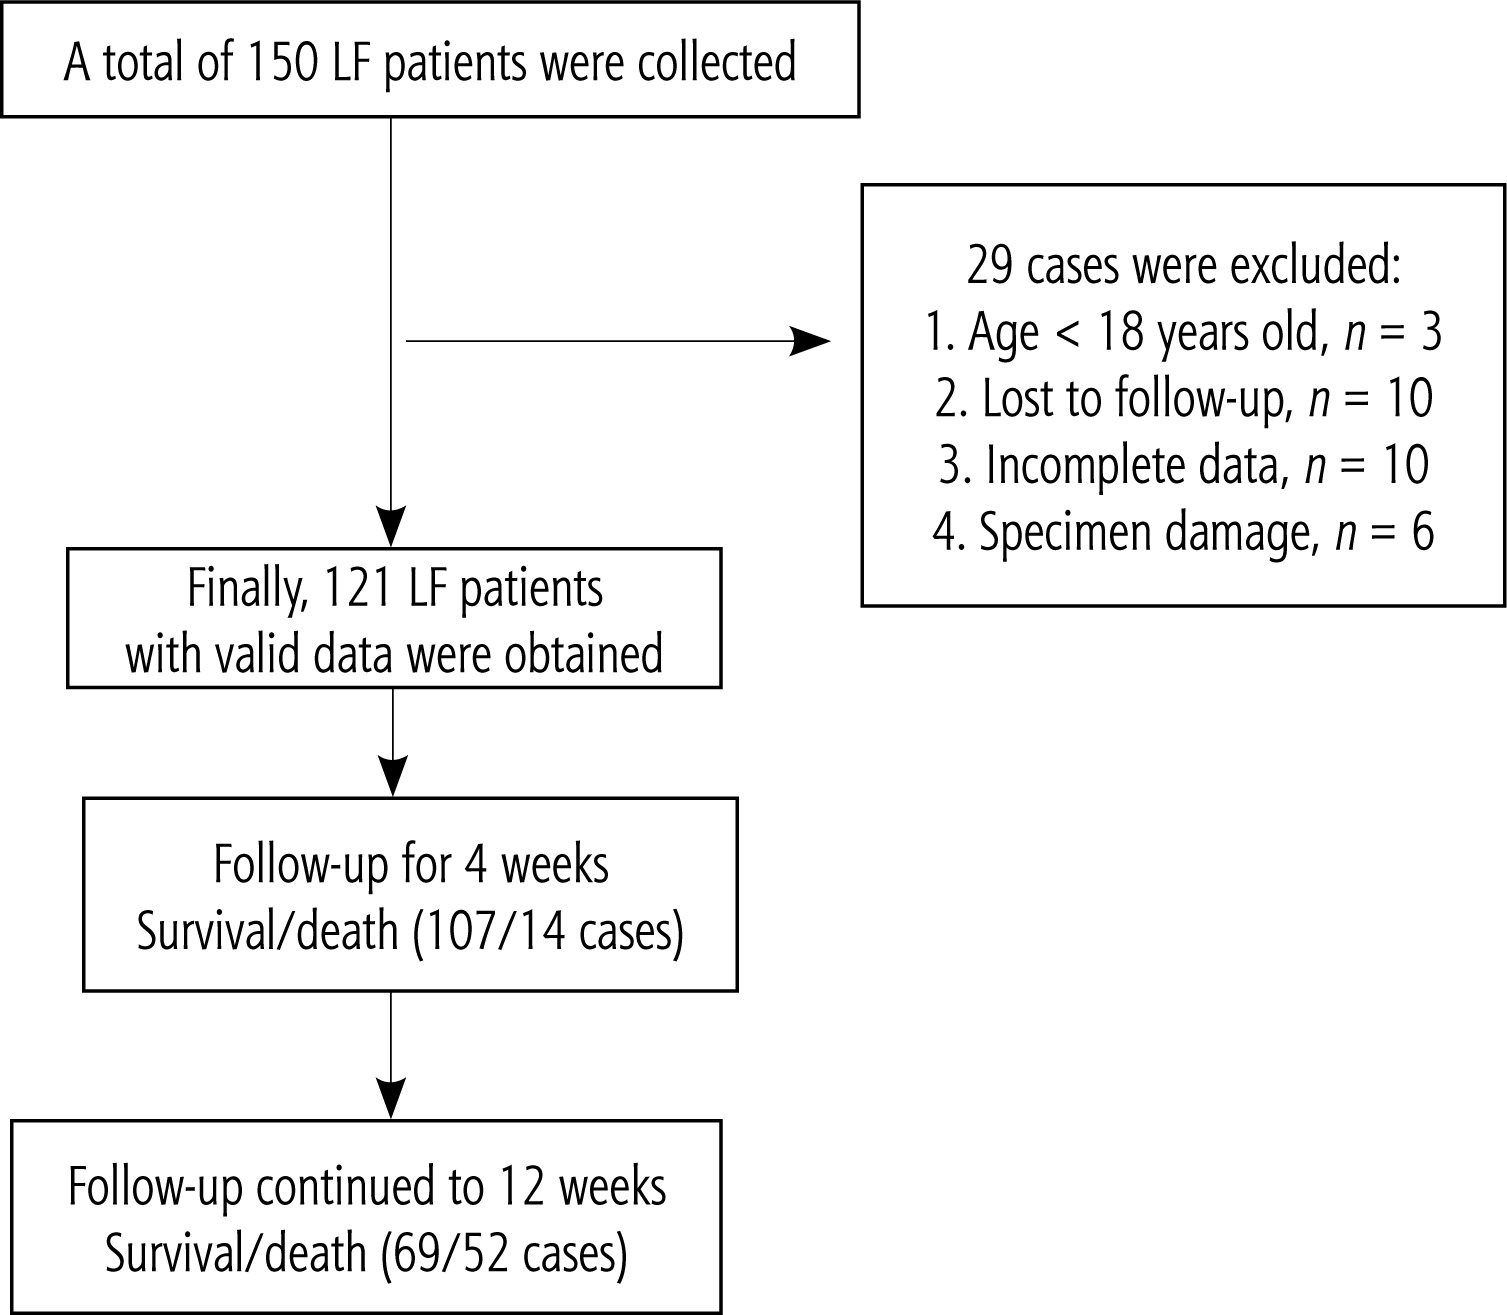
Following the inclusion and exclusion criteria, 29 subjects were excluded (3 under 18 years old, 10 lost to follow-up, 10 with incomplete data, and 6 with damaged specimens), resulting in the inclusion of 121 LF patients. Upon admission, all patients were given bed rest, with close monitoring of vital signs. Symptomatic supportive treatments were provided, including antiviral therapy (for LF patients with hepatitis B virus), alleviation of liver inflammation, jaundice management, maintenance of water and electrolyte balance, albumin supplementation, nutritional support, and active prevention of complications such as infection, hepatic encephalopathy, and hepatorenal syndrome. On this basis, DPMAS-PPE was performed using the Jianfan DX-10 artificial liver. The interval between each artificial liver treatment was determined based on patient tolerance, clinical symptoms, physical signs, and improvements in liver and coagulation functions, typically ranging from 2 to 4 days. Follow-up was conducted via telephone using admission records and contact information to record the survival status of patients at post-treatment weeks 4 and 12 (Fig. 1).
Data collection
Data for all enrolled patients included gender, age, etiology of liver failure, and clinical laboratory testing. Venous blood was collected for testing before and after artificial liver treatment. Specifically, the tests included:
Blood routine: white blood cells (WBC), neutrophil-to-lymphocyte ratio (NLR), red blood cells (RBC), hemoglobin (HGB), platelets (PLT);
Liver function: albumin (ALB), total bilirubin (TBIL), direct bilirubin (DBIL), indirect bilirubin (IBIL), alanine aminotransferase (ALT);
Renal function: creatinine (Cr), blood urea nitrogen (BUN);
Coagulation function: prothrombin time (PT), prothrombin activity (PTA), international normalized ratio (INR);
Blood ions: sodium (Na), calcium (Ca);
Serum cytokines: HIF-2α, G-CSF, IL-6, IL-33, EGF, SDF-1α, SDF-1β.
Ethical statement
This project has been reviewed by the Ethics Committee of Ruikang Hospital Affiliated to Guangxi University of Chinese Medicine (YJS2021-081), and the medical record data used in the study have been approved.
Statistical analysis
Data analysis was performed using SPSS 20.0 statistical software. Normally distributed data were presented as mean ± standard deviation, while non-normally distributed data were expressed as median (25th-75th percentile). Two independent sample t-tests were used for comparing two sets of data; otherwise, independent sample non-parametric tests were used. For comparison of data before and after artificial liver treatment, if the difference conformed to a normal distribution, paired sample t-test was used; otherwise, two related sample non-parametric tests were used. Count data were expressed in terms of rate, and comparison was made using the χ2 test. P < 0.05 indicates a statistically significant difference. ROC analysis was employed to evaluate the prognostic value of serum and routine blood test indicators during treatment and follow-up periods. The multivariate analysis of LF prognosis was conducted using stepwise logistic regression. Spearman rank correlation was used to analyze the relationships between the expression levels of HIF-2α, G-CSF, IL-6, IL-33, EGF, SDF-1α, and SDF-1β and clinical test indicators. RStudio 2023.03.0 was used to integrate clinical test indicators and cytokines for age, gender, disease stage, and classification in LF patients. A column chart was constructed using Cox regression models, and its validity was tested to predict the short-term survival rate of LF patients.
Results
Characteristics of LF patients
During the monitoring period, the number of cases used for effective analysis of LF patients was 121 (Fig. 1). The demographic characteristics of the study population, patient dynamic survival at follow-up, and the etiology, staging, and classification of LF patients are shown in Table 1. The mean (±SD) age of 121 patients was 51.12 years (±12.51 years). Most patients were male (100/121). Among the cases included in the analysis, 81.82% were caused by hepatitis B virus infection, 8.26% were caused by alcoholic hepatitis, 4.13% were caused by hepatitis E virus infection, 3.31% were caused by cholestasis, and 2.48% were caused by drug-induced liver injury. According to the guidelines, liver failure should be classified into stages (11.57%, 36.36%, 23.97%, 28.10%, respectively) and types (1.65%, 6.61%, 80.99%, and 10.74%, respectively, for acute, subacute, chronic, and chronic phases). Within 4 weeks of follow-up, the survival rate was 88.43%, and within 12 weeks of follow-up, the survival rate was 57.02%. Ultimately, both groups of patients received artificial liver treatment 2 to 4 times. The survival group underwent a total of 224 treatments, while the non-survival group received 167 treatments. The difference in the number of artificial liver treatments between the two groups was not statistically significant (p = 0.623).
Table 1
Disease profiles in patients with liver failure
Detection of corresponding blood indices before clinical treatment in both groups of patients
These liver failure patients were followed up or clinically treated for 3 months of treatment and divided into the survival group (n = 69) and death group (n = 52) based on whether they survived (Table 2). There were certain differences in blood routine, liver and kidney function, coagulation function, blood electrolytes, inflammatory cytokines, and other hematological tests before treatment between groups. Compared with the survival group before the treatment, the patients in the death group had significantly higher levels of TBIL (p < 0.01), DBIL (p < 0.05), IBIL (p < 0.05), INR (p < 0.01), NLR (p < 0.01), BUN (p < 0.01), and Cr (p < 0.01). In contrast, the levels of ALB (p < 0.05), HGB (p < 0.01), and Na (p < 0.01) were significantly lower in the death group. These observations reflect increased breakdown of harmful products by the liver and decreased synthesis of beneficial products for the organism in the death group. It can be inferred that before the treatment with DPMAS-PPE was initiated, the patients in the liver failure death group exhibited more severe autoinflammation, electrolyte disturbances, coagulation disorders, and impaired hepatocyte synthesis compared with the survival group. Additionally, no significant differences were observed between pro-inflammatory factors and cytosolic factors prior to treatment.
Table 2
Comparison of serum index levels before treatment between the two groups
[i] The measurement data of two independent samples in the table were analyzed by t test or Mann-Whitney U test. The measurement data in line with a normal distribution were expressed as mean ± standard deviation (x ±S), and the measurement data not following a normal distribution were expressed as median (25%, 75% quartile) [M(P25-P75)]
Detection of corresponding indexes of blood samples during follow-up
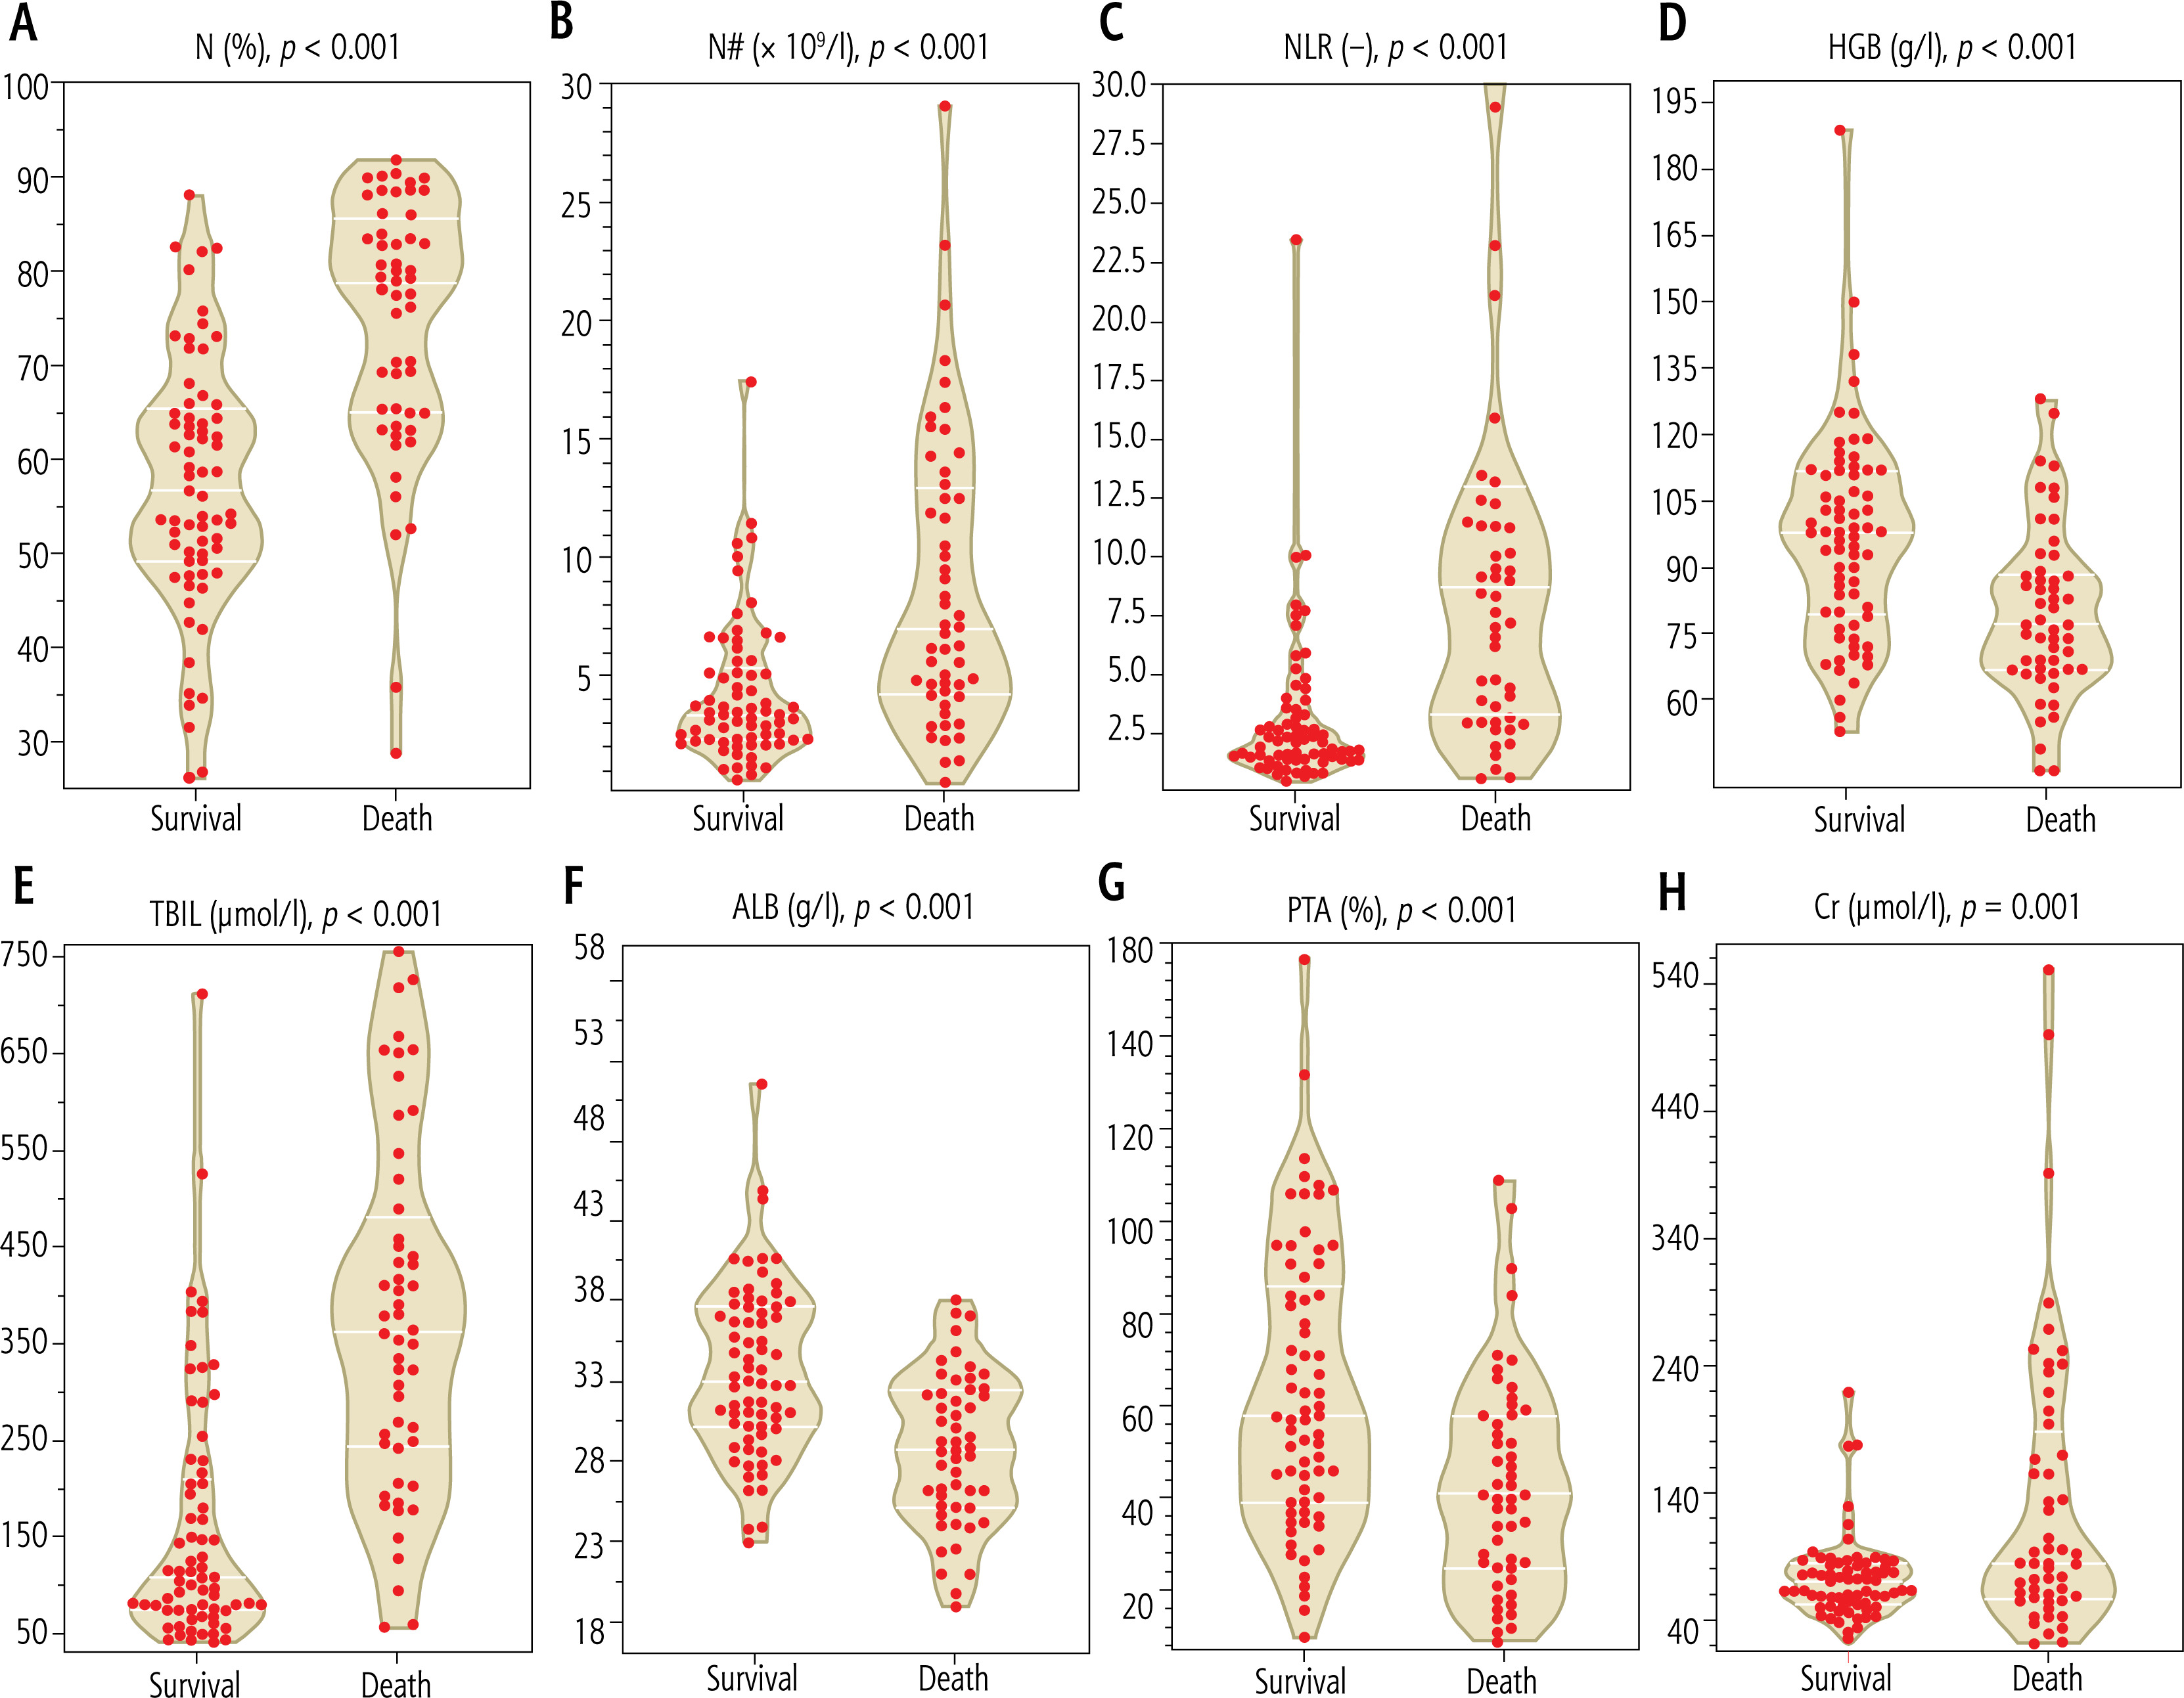
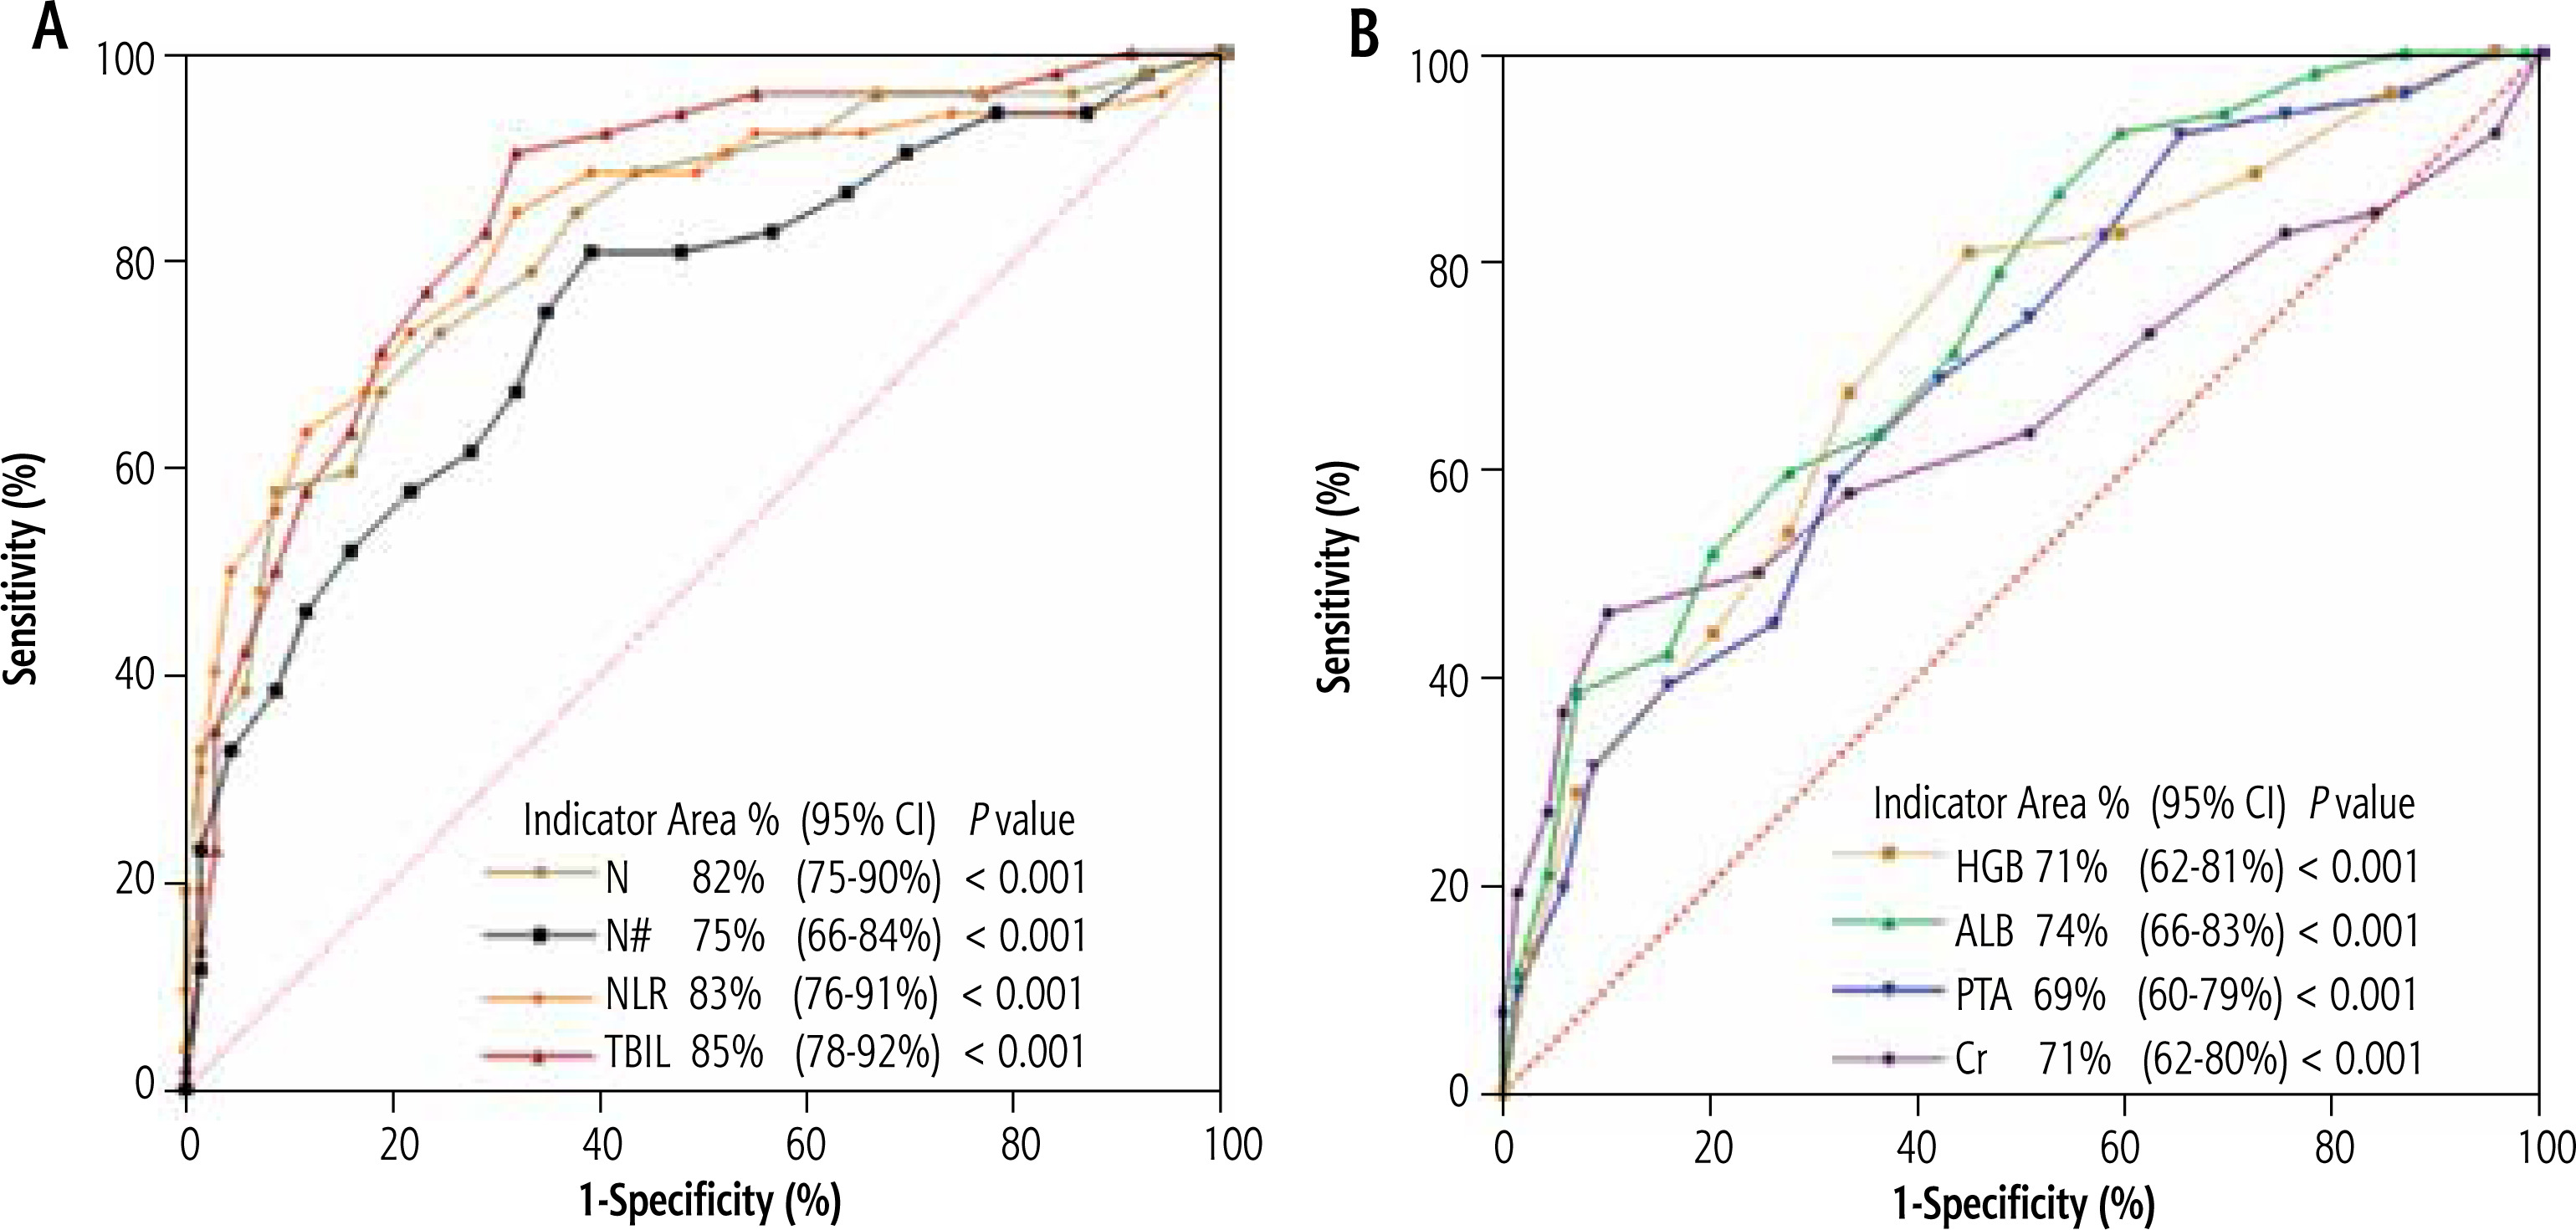
During the follow-up and consultation period, significant differences were identified between the two groups of patients in various blood parameters, including blood routine, biochemistry, coagulation function, electrolytes, and other indices. Specifically, the following indices exhibited significant differences (Fig. 2): N (Fig. 2A), N# (Fig. 2B), NLR (Fig. 2B), HGB level (Fig. 2D), TBIL level (Fig. 2E), ALB level (Fig. 2F), PTA (Fig. 2G), and Cr level (Fig. 2H). These indices collectively reflect the presence of severe liver inflammation, anemia, hypoalbuminemia, coagulation disorders, and renal insufficiency in the mortality group. Subsequently, ROC curve analysis was conducted using these significantly different indices. Among blood inflammation indices (Fig. 3A), the AUC for N, NLR, and TBIL all exceeded 80%. Therefore, these indices can be considered as sensitive short-term prognostic markers in patients with liver failure. In contrast, for the indices of HGB, ALB, PTA, and Cr (Fig. 3B), the AUC was below 80%. Hence, these indices were not considered as sensitive markers for short-term prognosis in patients with liver failure at this stage.
Analysis of changes in fluctuations in cytokine levels in patients before and after treatment
Considering that the focus of our study is on the expression levels of cytokines during the treatment process, we conducted follow-up for 4 and 12 weeks (Table 3). By the fourth week of follow-up, 14 out of 121 patients died. Among the 7 cytokines studied, the expression level of IL-6 was significantly lower in the survival group (n = 107) than in the death group (n = 14) (p < 0.01). At the 12-week follow-up, the number of deaths increased to 52. The difference in G-CSF expression before and after treatment was lower in the survival group than in the death group, while the difference in EGF expression was higher in the survival group than in the death group. These differences were statistically significant (p < 0.05 for G-CSF, p = 0.05 for EGF). From these findings, we can infer that under the same treatment conditions, low expression of IL-6 at week 4 may serve as a valuable observational indicator for monitoring the efficacy of DPMAS-PPE in LF patients. High levels of G-CSF and low levels of EGF at week 12 may serve as valuable observational indicators for the same treatment in LF patients.
Table 3
Comparison of pre- and post-treatment differences between the two groups at various time points
Analysis of the correlation between cytokines and the corresponding indicators of serum and routine blood tests
We found that some cytokine levels changed during DPMAS-PPE treatment, especially during the follow-up period of weeks 4 and 12. According to diagnostic criteria, TBIL, PTA, and INR are the diagnostic core values in the blood of LF patients. Therefore, we used Spearman rank correlation analysis to examine the correlation between various cytokines and clinically sensitive indicators in LF patients. IL-6 was positively correlated with TBIL and DBIL (r = 0.24, p < 0.01; r = 0.25, p < 0.05), EGF was positively correlated with PT and INR (r = 0.22, p < 0.05; r = 0.23, p < 0.05), and negatively correlated with PTA (r = –0.19, p < 0.05). G-CSF was positively correlated with WBC and PLT (r = 0.31, p < 0.05; r = 0.25, p < 0.05) (Table 4).
Table 4
Correlation analysis between cytokines and clinical laboratory indicators
| Cytokine | TBIL | DBIL | IBIL | ALB | ALT | PT | INR | PTA | PLT | WBC |
|---|---|---|---|---|---|---|---|---|---|---|
| IL-6 | 0.24b | 0.25a | 0.11 | 0.08 | 0.08 | 0.00 | 0.02 | –0.04 | – | – |
| IL-33 | –0.07 | –0.11 | 0.03 | –0.1 | 0.01 | –0.05 | –0.05 | 0.02 | – | – |
| EGF | –0.08 | –0.1 | –0.01 | 0.07 | –0.05 | 0.22a | 0.23a | –0.19a | – | – |
| SDF-1α | 0.01 | 0.04 | –0.06 | 0.1 | 0.19a | –0.15 | –0.16 | 0.08 | – | – |
| SDF-1β | –0.14 | –0.12 | –0.11 | –0.09 | –0.07 | 0.05 | 0.05 | –0.09 | – | – |
| G-CSF | 0.05 | 0.01 | 0.1 | 0.07 | 0.02 | –0.12 | –0.12 | 0.07 | 0.25b | 0.31b |
| HIF-2α | 0.09 | 0.06 | 0.13 | 0.13 | 0.05 | 0.14 | 0.15 | –0.14 | 0.03 | 0.18 |
Development of short-term survival prediction models through multivariate regression analysis
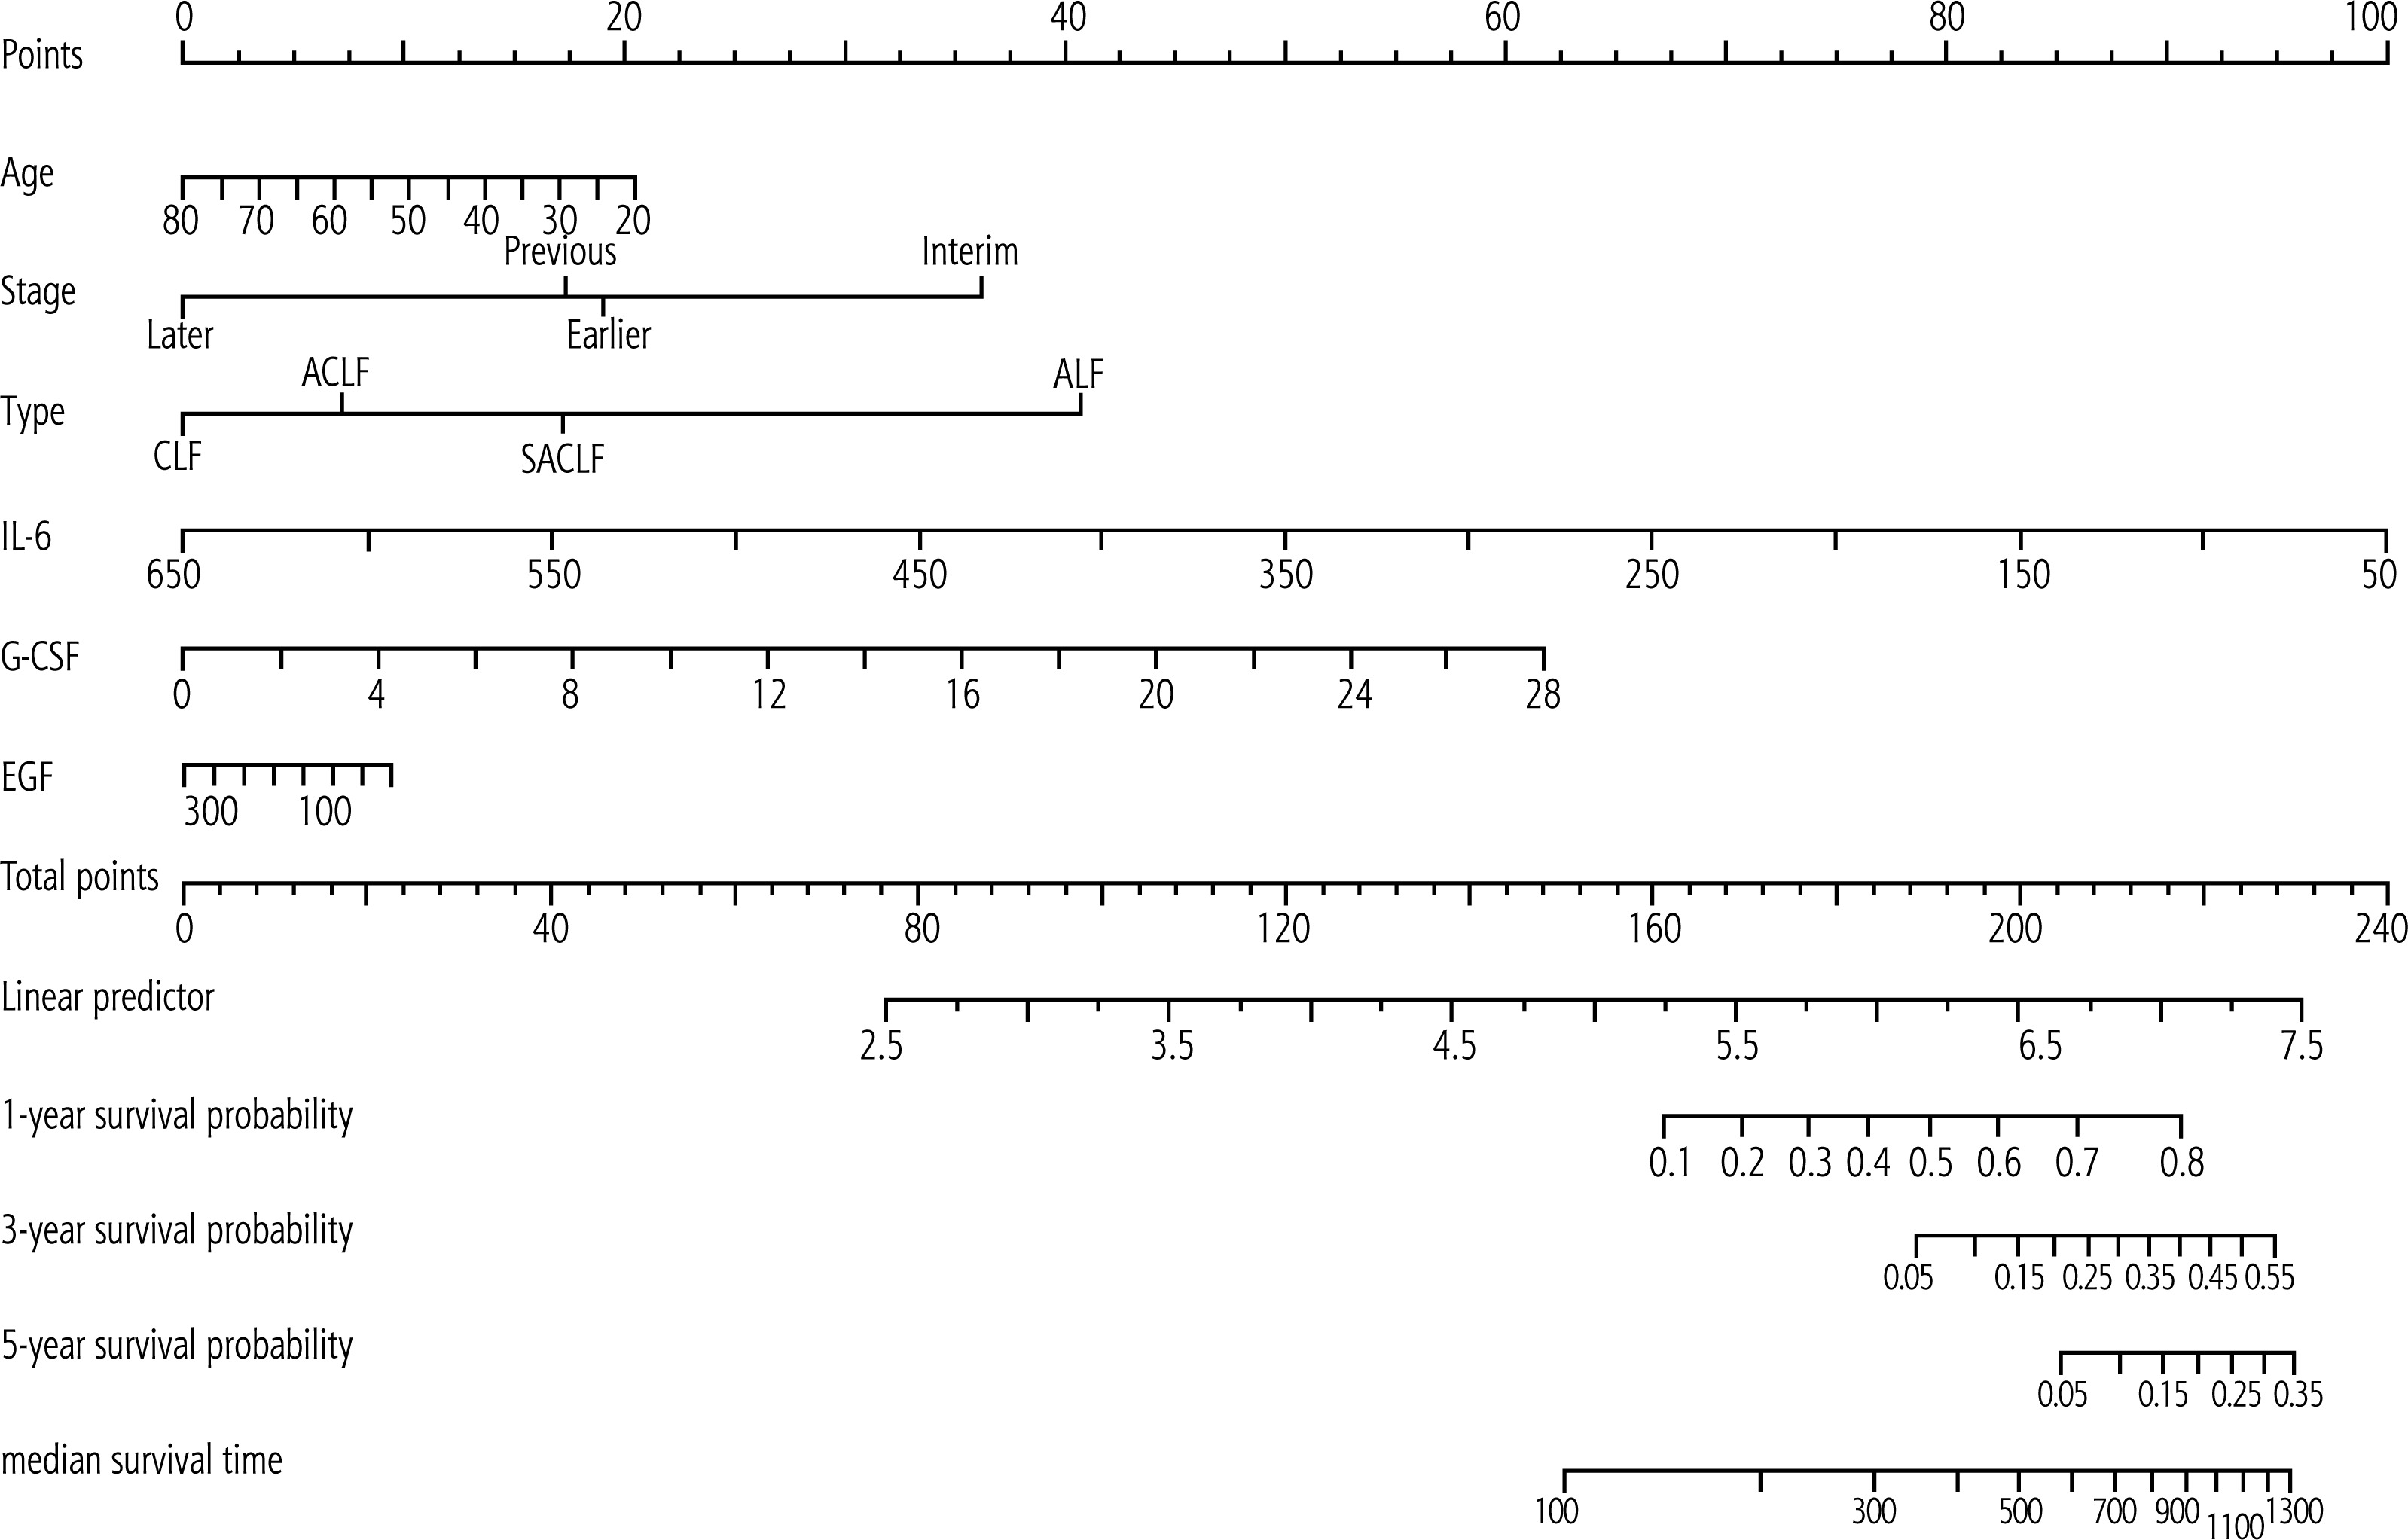
Cytokine indicators with differential expression levels that had been clinically tested during treatment and follow-up were collected. Combined with six indicators – including age of LF patients, LF disease stage, and classification – they were integrated using RStudio software, and nomograms were drawn using Cox regression to predict survival (Fig. 4). The loaded data packages included Hmisc, rms, survival, etc. As shown in the figure, the proportion of IL-6 in the score ranks first, followed by, in descending order, G-CSF, liver failure type, staging age, and EGF expression. This confirms that patients with older age, CLF or ACLF, late and early stages of the disease, higher IL-6 expression, lower G-CSF expression, and higher EGF expression have lower survival rates and shorter median survival days. For example, in a 53-year-old mid-term patient with ACLF, IL-6 is 129 pg/ml, G-CSF was 8.46 ng/ml, and EGF was 26.41 pg/ml. The corresponding score values are a total score of 152 points, with a 1-year survival probability of less than 10% and a 3-year or 5-year survival probability of less than 5%. The overall C-index of the model is 0.715, with a 95% CI: 0.64-0.79 (p < 0.05).
Discussion
Once liver failure occurs, the condition is extremely dangerous, and the short-term survival rate of patients is extremely low. Although liver transplantation treatment after liver failure is an effective intervention, its widespread application is limited by factors such as donor and organ availability, transplantation timing, and high costs. Even if successful, there is still an extremely low survival rate. Benítez et al. retrospectively studied the data on 1-year survival after liver transplantation and found that the 1-year survival rate of ACLF patients after liver transplantation was only 74.7%, indicating that liver failure patients still have a high risk of death even after liver transplantation [10]. Bernal et al. believe that chronic acute liver failure is a unique clinical and pathophysiological syndrome with clear diagnostic and prognostic criteria. Regardless of the stage of liver failure, there is a high risk of death that is difficult to control [11]. Reuben et al. conducted a cohort study over two 8-year periods (1998-2005, 2006-2013) and found that the survival rate of acute liver failure increased from 67.1% in the first 8 years to 75.3% in the second 8 years, while among acute liver failure patients who did not undergo liver transplantation treatment it only increased from 45.1% to 56.2% [12]. These non-liver transplant treatments include antiviral therapy, antimicrobial therapy, and supportive treatments such as plasma and human serum albumin. However, our data suggest that the combination of DPMAS-PPE under ALSS conditions can control the 4-week and 12-week survival rates of LF patients at 88.43% and 57.02%, indicating that our treatment improves short-term survival rates for patients. The findings revealed that the differences in the corresponding test indicators (e.g., TBIL, DBIL, IBIL, INR, NLR, BUN, Cr, ALB, HGB, Na) between the survival group and the death group before treatment were statistically significant (p < 0.05). These indicators suggest that patients in the death group had severe hepatic necrosis, infection, and renal dysfunction prior to treatment, along with severe coagulation disorders, hypoproteinemia, and hyponatremia.
In terms of cytokine expression, when we followed up to week 4, we compared the difference in cytokine expression between the first and last treatments, and found that only cytokine IL-6 showed significant differences between the two groups (p < 0.01). The difference in IL-6 before and after treatment in the survival group was negative, while the difference in IL-6 before and after treatment in the death group was positive. We infer that IL-6 in the survival group tended to improve after treatment, while the improvement trend in IL-6 in the death group was not significant. Apart from changes in cytokine levels, significant correlations were observed between cytokines and clinical laboratory indicators (Table 4). The positive correlations (p < 0.05) between IL-6 and both TBIL and DBIL suggest that IL-6 could serve as an important indicator for liver function evaluation. When liver failure occurs, its value will gradually increase, and the higher the value, the more severe the damage to liver cells. The increase in its value also indicates an increased risk of death (Fig. 4). In the population of liver failure patients in China, the main cause is chronic or acute liver failure caused by hepatitis virus infection, followed by some drugs and liver toxic substances (alcohol, chemical agents, etc.) [9], with a mortality rate of up to 60% [13]. Zhou et al. found that the serum IL-6 level of patients with ACLF of hepatitis B was correlated with the mortality rate [14]. The baseline IL-6 level of patients who died within 4 weeks was significantly higher than that of patients who survived, and the mortality rate of patients with high IL-6 levels at both baseline and 4 weeks was 16.7%. With the dynamic changes in IL-6 levels, the mortality rate shows an upward trend. Xiao et al. found that IL-6 in liver failure patients was an independent risk factor for 28-, 90-, and 180-day mortality in LF patients, and the column chart showed good calibration and discrimination, with an AUC of 0.927 [15]. In addition to virus-induced liver failure, there have also been studies investigating IL-6 in alcoholic liver failure. Murakami et al. measured serum inflammatory cytokines – IL-1, IL-6, IL-8, IL-10, IL-12p70, and TNF-α – in Japanese patients with chronic alcoholic exacerbation of acute liver failure [16]. The analysis showed that the serum IL-6 levels of patients in the liver transplant group and those who died within 6 months after admission were significantly higher than those in the survival group [16]. Serum IL-6 levels and the 4th day model for end-stage liver disease (MELD) score are prognostic factors for alcohol-related ACLF. In addition, Maeda et al. evaluated the postoperative liver cell regeneration ability by measuring the concentration of IL-6 in the bile after liver lobectomy [17]. The results showed an association between the concentration of IL-6 in the bile and postoperative liver failure, and a negative correlation with serum bilirubin concentration. This is similar to our current study, so the serum cytokine IL-6 may serve as a good predictive indicator for 4-week survival in patients with liver failure.
When we followed up to week 12, the number of deaths increased to 52 and 69 survived. The difference in cytokines between the two groups before and after treatment was compared again. The results showed a significant difference (p < 0.05) between the survival group and the death group in terms of cytokine G-CSF, and the degree of reduction in the survival group was more significant than that in the death group. Analyzed from a time perspective, the trend is even more apparent: the value of cytokine G-CSF in the survival group continuously decreased from week 4 to week 12, and the same is true for the death group. We speculate that G-CSF is a continuously decreasing process in the pathogenesis of liver failure. We also found a positive correlation (p < 0.05) between G-CSF and PLT as well as WBC, and significant differences in expression levels among different groups. Cytokine G-CSF is a growth factor secreted by various cells. Animal studies have shown that G-CSF accelerates liver regeneration by inducing bone marrow-derived progenitor cells in rats to migrate to the liver and increasing the endogenous oval cell response [18]. Wan et al. found in patients with chronic acute liver failure that an increase in endogenous G-CSF content promoted liver cell regeneration and reduced liver damage [19]. Liu et al. established a damaged liver cell model and found for the first time that G-CSF can directly affect damaged liver cells through the AKT and ERK signaling pathways, thereby promoting damaged liver vitality and angiogenesis [20]. Saha et al. found during a 90-day follow-up period of antiviral combined with G-CSF treatment in HBV-ACLF patients that its efficacy was positive [21]. It is believed that G-CSF treatment can improve the survival rate and clinical recovery of HBV-ACLF patients, and can also prevent renal failure and hyponatremia. It is strongly recommended to add G-CSF treatment to standard drug treatment. Khanam et al. found that treating ACLF patients with G-CSF can increase the frequency of dendritic cells, reduce the frequency of CD8 T cells secreting IFN-c, and improve clinical severity indicators [22]. It is believed that G-CSF can serve as the basis for immune modulators in patients with liver failure. Engelmann et al. established an ACLF model in mice and found that the combination of TAS-242 and G-CSF inhibited the inflammatory response, promoted liver regeneration, and reduced mortality in the ACLF model [23]. They suggested that this combination may be a potential therapeutic option for ACLF. There are also studies suggesting that the combined use of G-CSF can inhibit the secretion of inflammatory cells in ALF. For example, Chen et al. found that human umbilical cord blood mesenchymal stem cells (hUCB MSCs) combined with G-CSF treatment can improve rat ALF by inhibiting liver function damage, pro-inflammatory cytokine production, oxidative stress, and hepatocyte apoptosis [24]. In terms of research and development of productivity in patients with G-CSF and LF, Zhu et al. compared post-treatment plasma exchange, simple plasma exchange, and G-CSF + plasma exchange + peripheral blood stem cell collection + hepatic artery injection with other treatments [25]. The results showed that the 90-day survival rates of each group were 50% plasma exchange, 65% G-CSF group, and 85% peripheral blood stem cell collection (p = 0.034). Similarly, De et al. reported that the 1-year survival rate of ACLF patients was evaluated after multiple cycles of G-CSF treatment, and the 3-month standard administration + G-CSF 5d group showed increases in the number and survival rate of hematopoietic stem cells [26]. Kabbani et al. conducted a study on 246 subjects (121 in the G-CSF group and 125 in the control group), and found that G-CSF treatment for ACLF may be beneficial and effective, but the study was limited by sample size and limited to Asian countries [27]. Similar meta-analyses, such as Shi et al., showed that G-CSF significantly improved the 12-month survival rate [28]. Although Colli et al. refuted the conclusion of systematic evaluation of the therapeutic effect of G-CSF [29], Martin-Mateos et al. found through a systematic review and meta-analysis that G-CSF administration did not significantly improve overall survival in ACLF patients [30]. The beneficial effects observed in Asian studies were opposite to those in the European region. This suggests that further evidence is needed to support the prediction of survival rate based on the expression of G-CSF.
In addition, this study found no significant differences in the expression levels of some cytokines between the survival and death groups (Table 3). There was no significant difference in their levels before treatment (Table 2). At the fourth week of follow-up, we found that the difference in EGF between the survival group and the death group before and after treatment was 2.45 pg/ml and 6.43 pg/ml, respectively (p > 0.05). When we followed up to week 12, the preand post-treatment levels of the survival group and death group were 6.77 pg/ml and 1.33 pg/ml, respectively (p = 0.05). However, in terms of their respective pre- and post-treatment times, the overall level of the survival group increased compared to before, while the death group decreased compared to before. We can infer that EGF has an impact on the survival of LF patients, and Table 4 confirms our viewpoint: EGF is positively correlated with PT and INR (p < 0.05), while EGF is negatively correlated with PTA (p < 0.05). Given that SDF-1α and SDF-1β are both indicators of liver regeneration ability after liver injury, their levels show no significant differences, whether in the temporal comparison before and after treatment, or the horizontal comparison between the two groups (p > 0.05). Yuan et al. demonstrated that the expression level of SDF-1α was associated with the improvement of liver inflammation. However, in our current study, we found no significant correlation between this factor and survival or death [31]. Sun et al. found a correlation between SDF-1 and hepatocyte growth factor in liver tissue in their study involving treating LF through four BMSC transplantation methods, confirming an improvement in liver tissue damage [32]. Returning to the previous point, EGF, which is also a growth factor, has different expression levels, which is partially consistent with Barreiros’s view that EGF is significantly elevated in patients with active viral infections, suggesting that the survival microenvironment generated by liver regeneration factor activation may be a risk factor for establishing viral tolerance [33].
This study revealed the relationship between changes in cytokines and short-term prognosis in patients with liver failure. According to the 4-week outcome, the cytokine IL-6 in the survival group decreased by 3.85 (–4.39) pg/ml after treatment, while in the death group, the cytokine IL-6 increased by 2.90 (–9.55) pg/ml after treatment. There was a significant difference in the changes of IL-6 level between the two groups of patients before and after treatment in the fourth week of follow-up, and its expression level can serve as a reference indicator for predicting the prognosis over a period of four weeks. As a pro-inflammatory cytokine and a potent inducer of acute phase response proteins, IL-6 is mainly increased by serum amyloid A and C-reactive protein, and its elevation occurs earlier than that of the latter in inflammatory conditions, with a longer duration. Therefore, IL-6 can be used to evaluate infection levels. Our study found that patients with decreased IL-6 had a superior 4-week prognosis, which may be related to the better infection control in the survival group after artificial liver treatment compared to the death group. At 12 weeks of follow-up, both the survival group and the death group showed a decrease in serum G-CSF expression levels compared to before, and the degree of decrease in the death group was more significant than that in the survival group, showing a significant difference. This is a good prognostic indicator for predicting the survival of LF patients for 12 weeks. Piscaglia et al. found that plasma exchange and G-CSF can promote the regeneration of liver cells in patients with advanced LF [34]. The reasons for this are that plasma exchange clears harmful factors in the circulation, while G-CSF promotes the repair and regeneration of liver cells. This indicates that low expression of serum cytokine G-CSF levels may be related to immune dysfunction, with higher levels indicating a poor prognosis at 12 weeks. Research shows that in the late stage of liver failure, the application of G-CSF treatment can improve the survival rate of patients [35].
The prognosis of LF patients is also related to many factors, such as age, the presence or absence of cirrhosis, different stages of liver failure, and the number of failed organs. Numerous studies have shown that dynamic observation combined with multiple factors is the scientific means to determine the prognosis of LF that is in line with clinical practice [36]. Due to the multifaceted factors influencing disease progression, according to the nomogram (Fig. 4), the factors affecting LF mortality are divided into three categories. The first is infection. This study showed that NLR (which can be considered as the ratio between inflammation severity and immune function, with smaller values indicating a more favorable disease state), as well as IL-6 and TBIL, all increased. This is a risk factor for the degree of inflammation in LF patients. The second is the physiological synthesis of liver function. Table 4 shows a negative correlation between albumin levels and disease risk. Similarly, there are indicators such as HGB and G-CSF, which are not only factors that need to be maintained under normal conditions, but also factors that need to be produced under LF patient conditions. The increase in their values indicates an improvement or recovery in liver cell regeneration ability. Similarly, INR is associated with coagulation factors synthesized by liver cells, and its continued increase above normal levels indicates a negative trend in LF, with the highest proportion in this nomogram score, making it a key indicator for predicting survival. The third factor is the overall metabolic (excretory) capacity of the body. The improvement of indicators such as TBIL, IL-6, Cr, and EGF contributes to the improvement of the condition in patients with LF. In the survival group, these indicators tend to stabilize.
In summary, prior to DPMA-PPE treatment, patients in the death group had significantly higher levels of TBIL, DBIL, IBIL, INR, NLR, BUN, and Cr, while levels of ALB, HGB, and Na were significantly lower compared with the survival group. During treatment and follow-up, the death group maintained higher levels of N, N#, NLR, TBIL, and Cr, whereas HGB, ALB, and PTA levels remained lower, with significant differences observed. ROC analysis showed that the AUC values for N, NLR, and TBIL exceeded 80%. At the 4-week follow-up, elevated IL-6 expression was a marker for mortality risk in LF patients, while at the 12-week follow-up, low G-CSF expression and high EGF expression were markers for mortality risk. Correlation analysis indicated that IL-6 was positively correlated with TBIL and DBIL, EGF was positively correlated with PT and INR but negatively correlated with PTA, and G-CSF was positively correlated with WBC and PLT counts. Multivariate regression analysis revealed that older patients, those with ACLF, individuals with advanced or early disease stage, and patients with high IL-6 expression, low G-CSF expression, and high EGF expression had lower survival rates and shorter median survival times. The C-index value of the model, 0.715, falls within the range of moderate accuracy.
Conclusions
The causes of death in LF patients are often related to severe infections, coagulation dysfunction, renal insufficiency, refractory hyponatremia, and hypoalbuminemia. During DPMA-PPE treatment, laboratory indicators such as N, NLR, and TBIL can still be used as references for assessing the short-term prognosis of patients. In addition, high expression of IL-6 is a risk factor for death within 4 weeks in LF patients, while low expression of G-CSF and high expression of EGF are risk factors for death within 12 weeks. Additionally, the multivariate model constructed with IL-6, G-CSF, EGF, and other factors has moderate value in assessing the short-term prognosis of patients with LF. Finally, given that the current study involved a relatively small sample size with potential heterogeneity, further validation from multiple institutions with larger cohorts is required to support the reliability of our findings.


