A 59-year-old asymptomatic, hypertensive patient was admitted for planned percutaneous coronary intervention (PCI) of the left anterior descending artery (LAD). Significant proximal LAD stenosis was identified, with coronary computed tomography angiography (CCTA) revealing two high-risk plaque features: positive remodelling and napkin-ring sign. Pre-procedural CCTA analysis defined the procedural strategy, including optimal angiographic projections, stent length, and landing zones. The estimated stent length was 20 mm, with proximal and distal reference diameters of 4.0 mm and 3.5 mm, respectively. Lesion morphology did not indicate the need for advanced lesion preparation.
PCI was performed via right femoral access using real-time computed tomography (CT) guidance. Optimal projections (LAO 30°/CAU 30° and RAO 40°/CRA 40°) were transferred to the C-arm using the Follow C-arm feature (Advanced Visualisation Workstation, Philips). Both optical coherence tomography (OCT, Ultreon 2.0, Abbott) and near-infrared spectroscopy-intravascular ultrasound (NIRS-IVUS, Dualpro, Nipro) were used for procedural optimisation. Baseline NIRS-IVUS demonstrated a high lipid burden (LCBI 383, maxLCBI4mm 587). The OCT MLD MAX workflow identified a soft lipid-rich plaque with eccentric calcification, stent length of 20 mm, and reference diameters of 4.5 mm proximally and 3.5 mm distally.
The lesion was predilated with non-compliant balloons (3.0 × 15 mm and 3.5 × 20 mm at 20 atm), followed by implantation of a 3.5 × 21 mm drug-eluting stent (Ultimaster Tansei, Terumo) at 16 atm, with postdilatation using a 4.5 × 15 mm NC balloon. Final OCT confirmed optimal stent deployment using the MAX algorithm: M – no edge dissection; A – complete stent apposition throughout; X – 80% of stent area achieved, with minimal lumen area of 9.46 mm². Post-PCI NIRS-IVUS demonstrated a marked reduction in lipid burden (LCBI 86, maxLCBI4mm 260) (Figure 1).
Figure 1
A – High-risk plaque features in the left anterior descending artery on coronary computed tomography angiography (CCTA), including the napkin-ring sign and positive remodelling. Green arrow indicates the vessel lumen; orange arrow indicates the low-attenuation core; blue arrow indicates a ring of higher attenuation; yellow arrow indicates the calcification; white arrow indicates positive remodelling. B – CT-guided planning of percutaneous coronary intervention (PCI). The expected stent length was 20–21 mm, and proximal and distal reference diameters were 4.0 mm and 3.5 mm. Red arrows indicate the planned stent length. Prox. ref. – proximal reference; Dist. ref. – distal reference. C – Comparison of plaque morphology assessed by optical coherence tomography (OCT) (upper row) and CCTA (lower row). D – Final result of percutaneous coronary intervention on the LAD
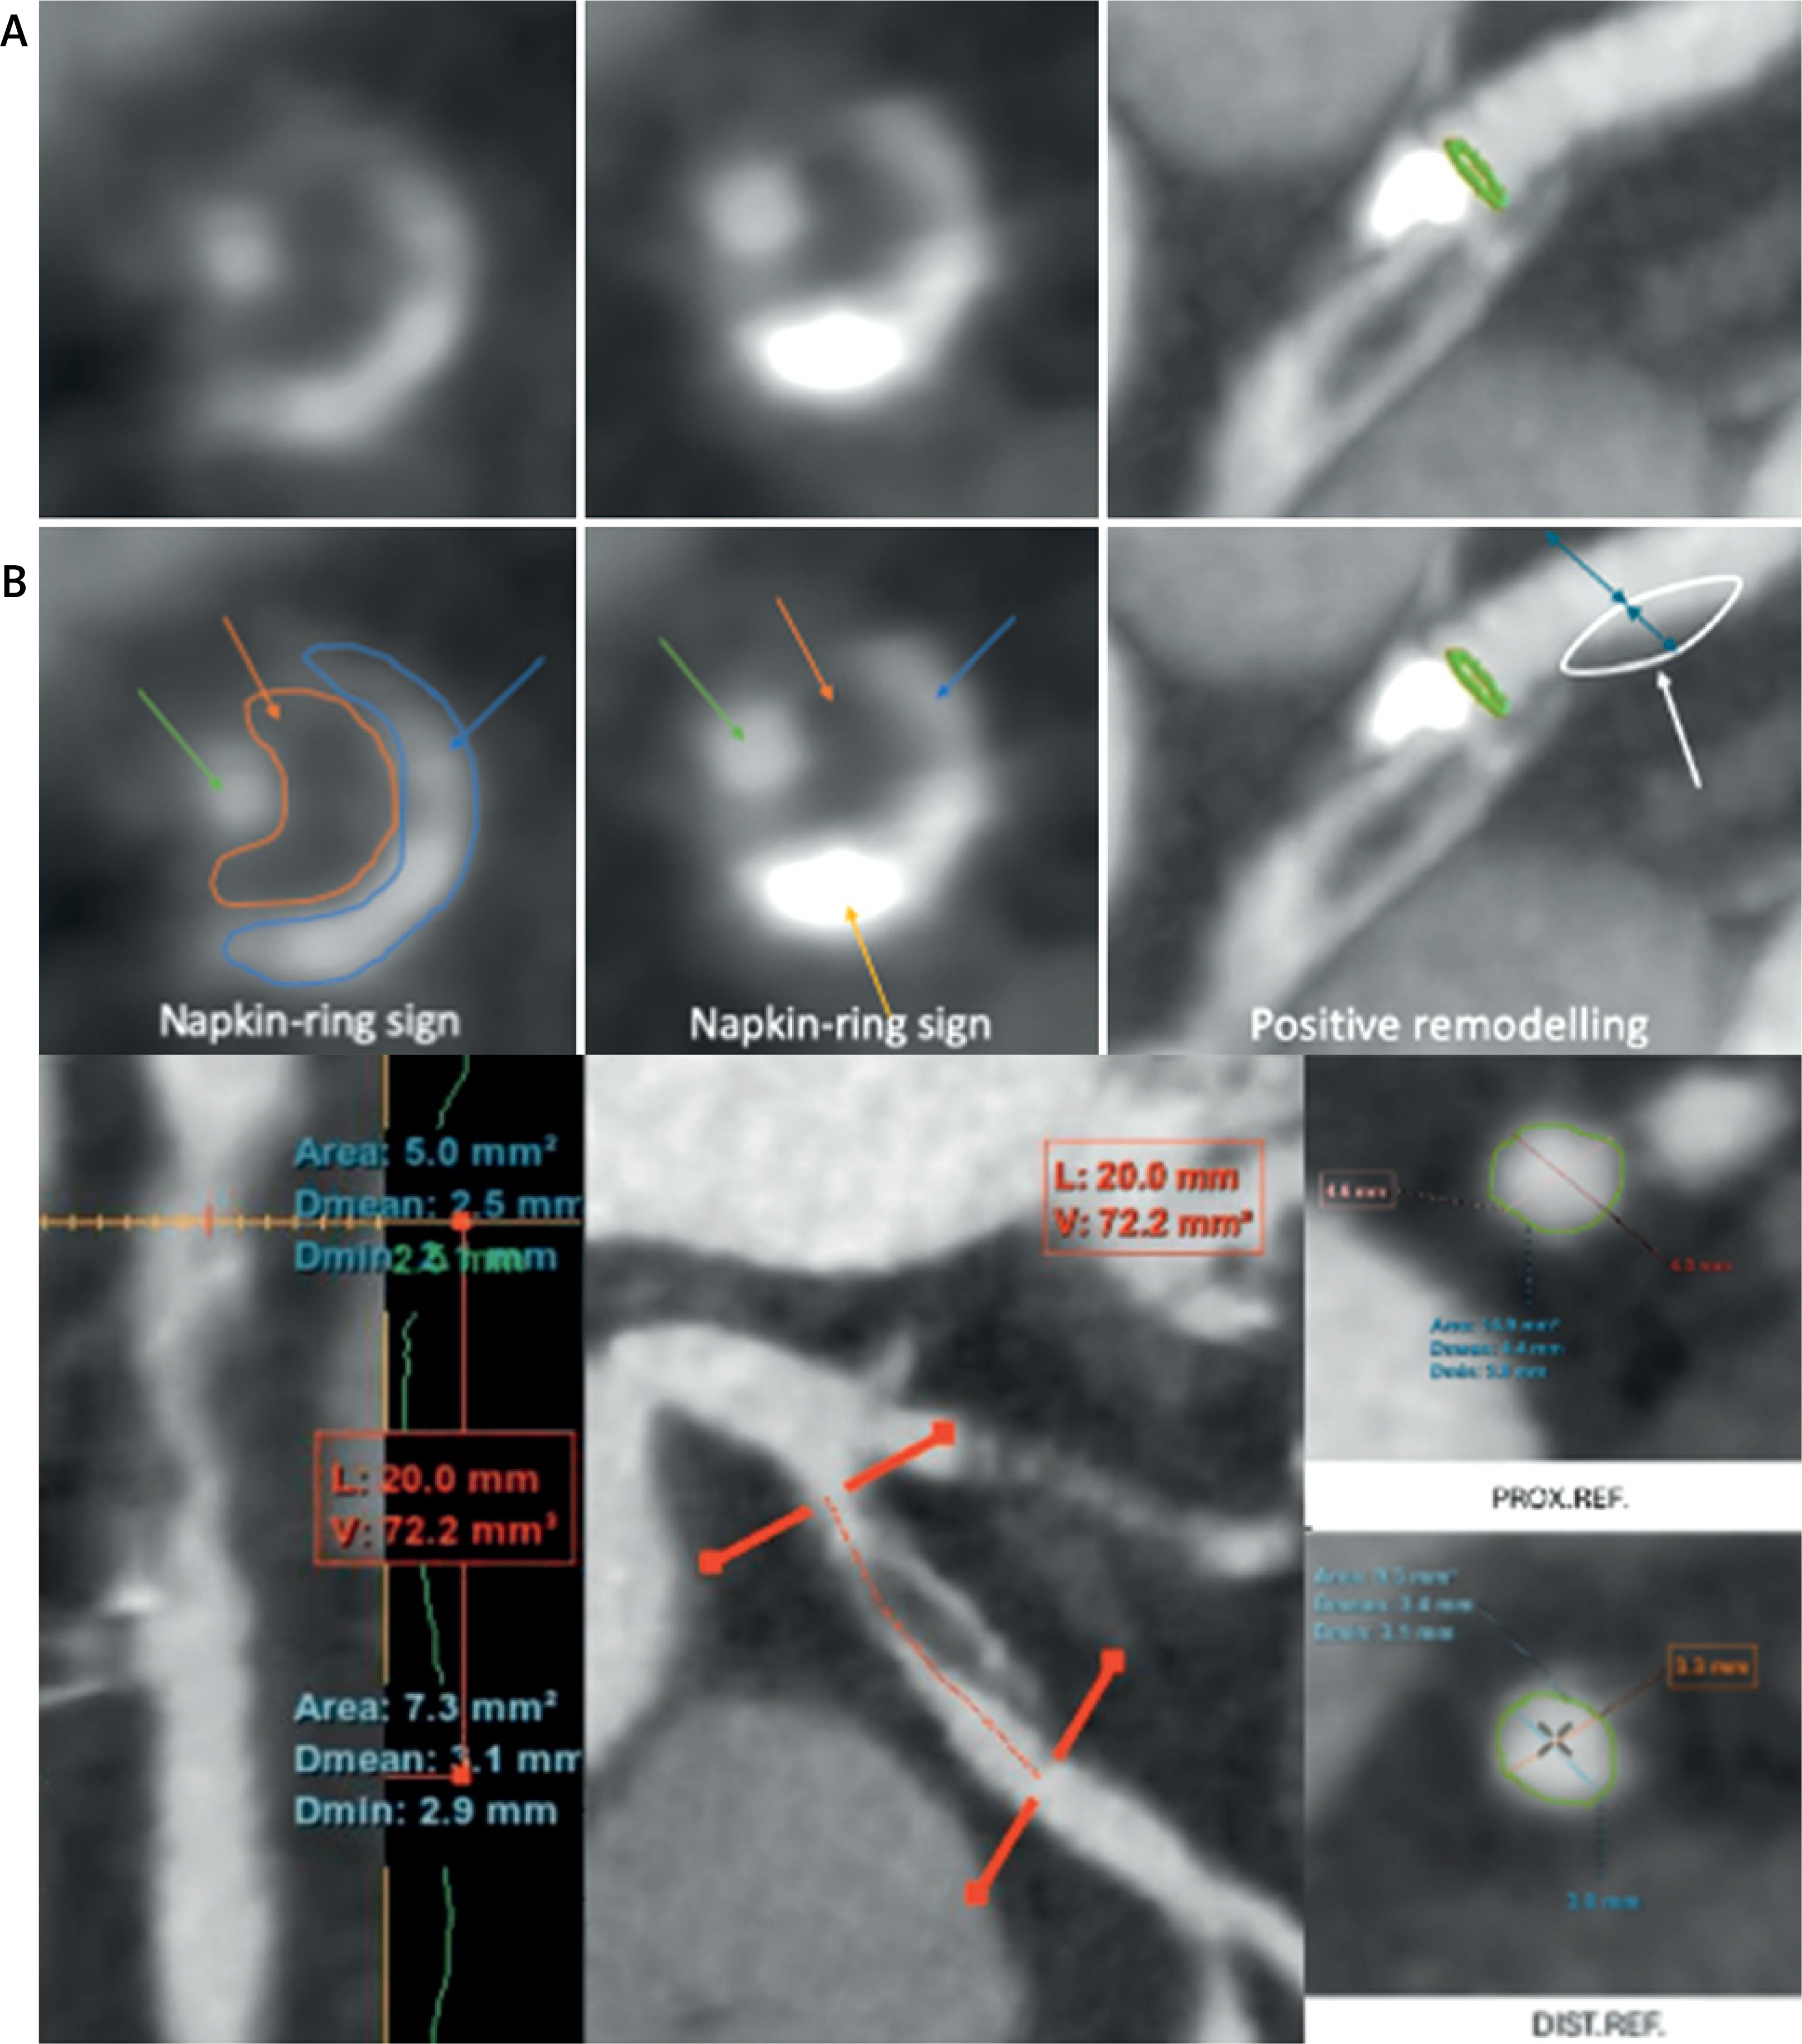
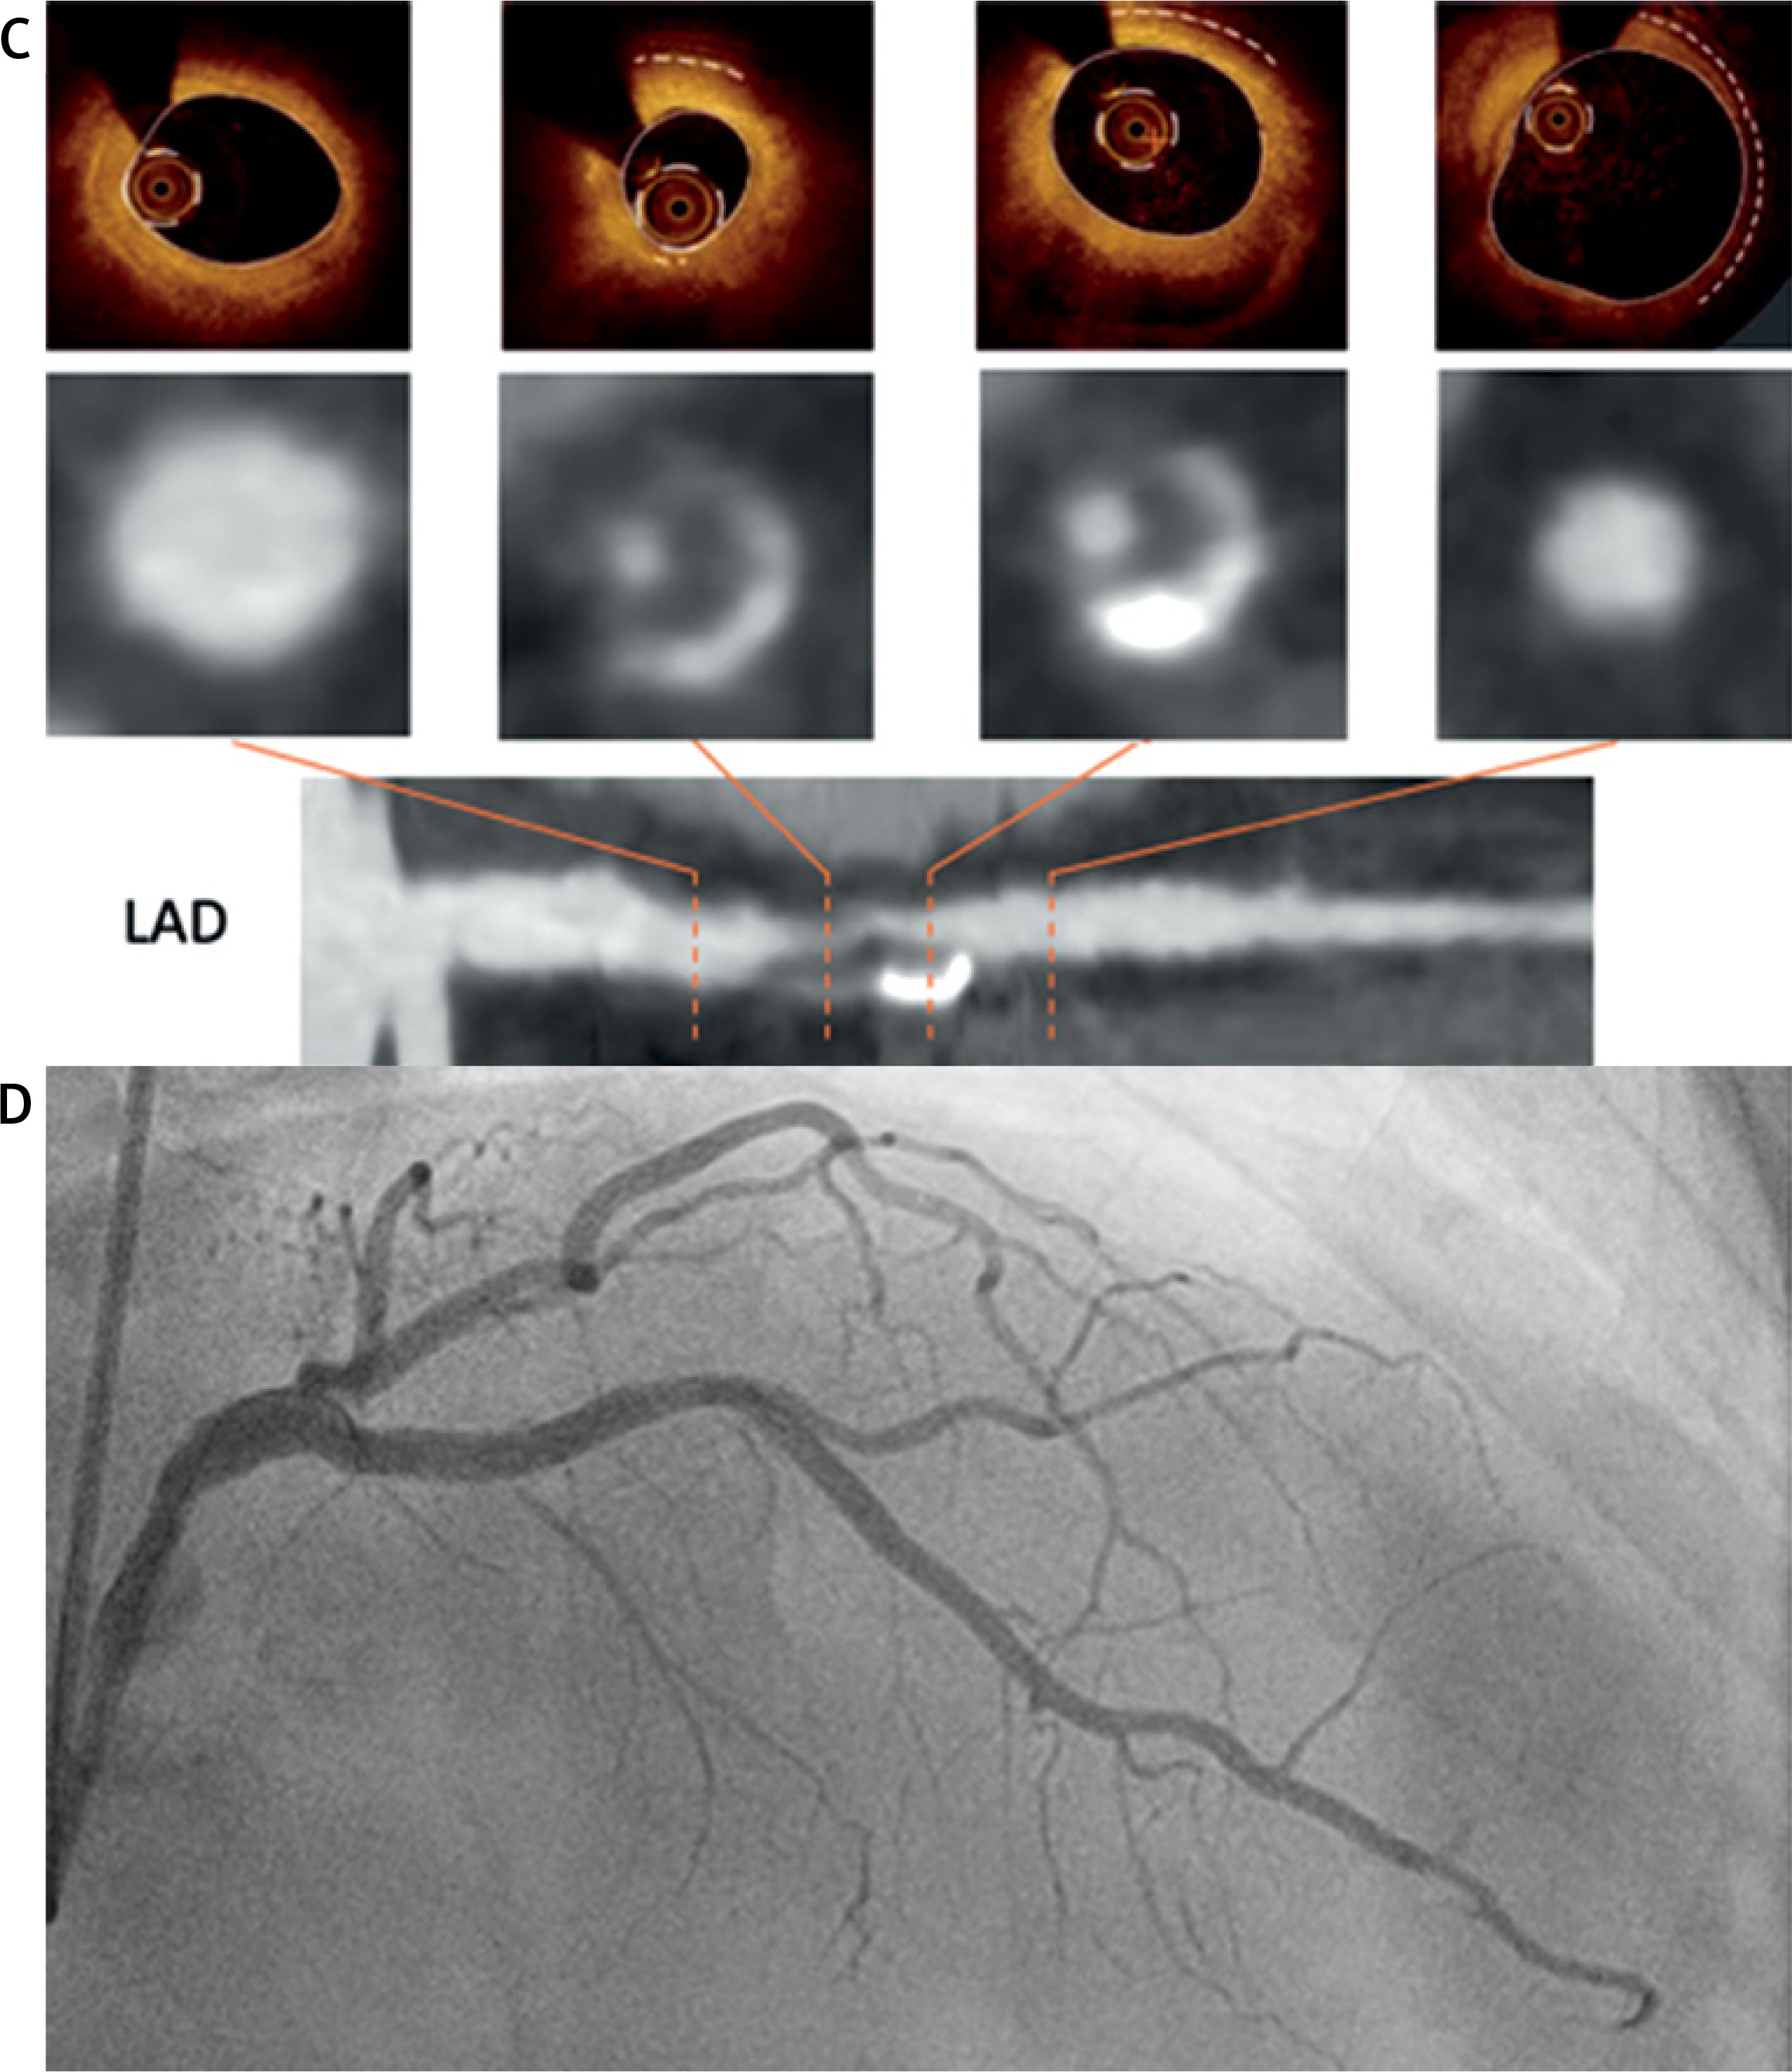
CT-based planning proved feasible and effective, enabling detailed anatomical assessment upfront. CCTA showed excellent concordance with OCT findings [1] – planned stent length was identical, and reference diameters were nearly concordant. Both modalities allowed precise landing zone delineation, avoiding extension into the left main – a critical consideration in proximal LAD lesions.
Notably, the lesion appeared angiographically shorter than on cross-sectional imaging, as angiography visualizes only the flow-limiting stenosis rather than the true extent of the diseased vessel. Without CCTA and OCT, a 15 mm stent would likely have been selected – as the 15 mm NC predilatation balloon appeared angiographically sufficient – resulting in geographical miss, with stent edges landing within vulnerable plaque.
The marked post-interventional reduction in lipid burden (LCBI 383 to 86) likely corresponded to the napkin-ring sign identified on CCTA. The underlying mechanism remains incompletely understood; proposed explanations include mechanical displacement of lipid from the plaque core, redistribution into the vessel wall, or artifactually reduced NIRS signal penetration through metallic stent struts. Dedicated studies are needed to distinguish true biological effects from imaging artefact.
CCTA defines the procedural roadmap [2], OCT optimizes stent sizing and deployment, and NIRS-IVUS characterizes the plaque content [3]. This multimodality approach provides complementary anatomical, structural, and compositional characterisation of high-risk lesions, with potential to improve procedural safety and outcomes in complex PCI. Nevertheless, CT-based planning has some limitations including limited availability, additional costs, and the need for expertise in the modality. Furthermore, the impact of integrating CT and PCI on overall contrast and radiation exposure warrants further research.