
Introduction
Women with Turner syndrome (TS) are more frequently obese, with a central distribution of adiposity [1]. Adult TS patients have lower total lean body mass, while fat mass is elevated [2]. In girls with TS, higher waist circumference and a thicker layer of subcutaneous adipose tissue are also observed [3]. Turner syndrome is characterized by the frequent occurrence of carbohydrate and lipid metabolism disorders. Many studies indicate that metabolic disorders are more common in female TS patients than in the general population and are noticeable already in childhood [1]. Compared to the general population, women with TS have a two-fold higher risk of developing type 2 diabetes and a 4.5-fold higher risk of developing impaired glucose tolerance [4]. Girls with TS are also more likely than the general population to have impaired glucose tolerance and insulin resistance [5] as well as reduced insulin sensitivity compared to age-matched controls [6]. The majority of girls with TS are treated with growth hormone (GH). Our previous study demonstrated impaired development of insulin resistance and carbohydrate metabolism during GH therapy in girls with TS [7]. On the other hand, a beneficial effect on body composition (BC) has been reported [8].
As obesity can lead to the development of cardiovascular diseases (CVD) and, in consequence, to increased mortality, the improvement of BC may reduce the risk of CVD in TS patients (8). This is particularly important because congenital heart diseases and components of metabolic syndrome lead to shorter life expectancy in adult TS patients [9].
The study aimed to investigate the effect of GH therapy on BC and establish the relationship between BC parameters and metabolic syndrome components in girls with TS during a 5-year follow-up.
Material and methods
In this prospective study, 21 patients with TS, confirmed by karyotyping with routine G-banding (according to the recommendations of the American College of Medical Genetics), who started GH therapy between 2007 and 2019 at the Department of Pediatrics and Pediatric Endocrinology with a dose of 47–66 µg/kg/day according to the Polish Drug Program, were enrolled. The criteria for inclusion into the study group were: TS, age from 5 to 18 years, the onset and continuation of GH therapy at our center, and lack of coexisting diseases that could temporarily affect test results (severe infections). Exclusion criteria were a lack of consent of the legal guardian and/or the patient to participate in the study, and/or taking medications that could temporarily affect the measured and laboratory parameters.
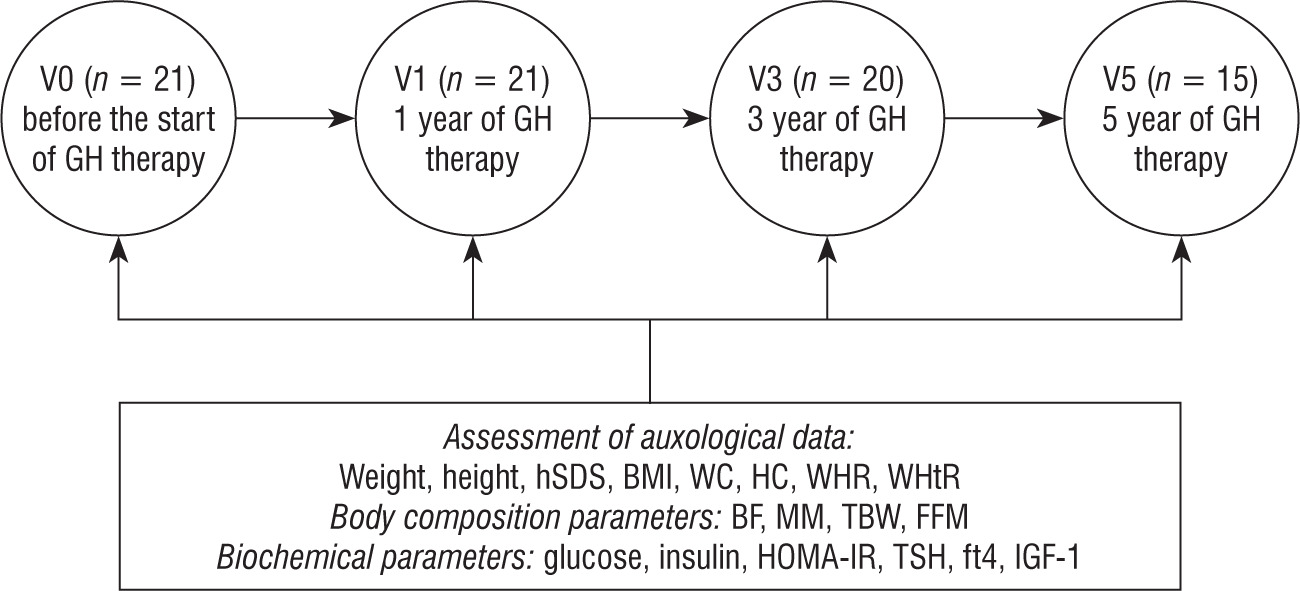
For each patient, auxological, BC, and biochemical parameters were measured before starting GH treatment. Then, clinical and biochemical parameters were monitored every 3–6 months according to the protocol of the Polish Drug Program until the end of GH therapy. Data before the start of GH therapy (V0) were obtained from 21 subjects, then after the first year (V1) of GH therapy in 21 patients, the third (V3) year in 20 patients, and the fifth (V5) year of GH therapy in 13 patients (Figure 1).
Figure 1
The course of the study
BF – body fat; BMI – body mass index; FFM – fat-free mass; fT4 – free thyroxine; HC – hip circumference; HOMA-IR – index of insulin resistance; hSDS – height standard deviation; IGF-1 – insulin-like growth factor 1; MM – muscle mass; WC – waist circumference; WHR – ratio of waist circumference to hip circumference; WHtR – ratio of waist circumference to height; TBW – total body water; TSH – thyroid-stimulating hormone
The anthropometric characterization was based on weight and height measurements, along with body mass index (BMI) calculation, using the standard formula of weight (kg) divided by height (m) squared, and evaluated on the chart for healthy girls [6].
Weight was measured with a TANITA MC-980 device with a precision of 100 g, and height with a Harpenden stadiometer with a graduation of 0.1 cm. Height was expressed as standardized values (height standard deviation score – hSDS) and was calculated using the following formula: hSDS = child’s height − height for 50th percentile/0.5 × height 50th percentile − height 3rd percentile. Based on the age, sex, BMI, and the appropriate reference standard, the BMI Z-score was calculated using the international (International Obesity Task Force; IOTF) body mass index (BMI) cut-offs [10]. Tanner staging was used for puberty assessment [11].
The measurements of waist and hip circumference were obtained in an upright position, midway between the lowest rib margin and the iliac crest, and at the widest point of the hips, respectively, to the nearest 0.1 cm using an inelastic tape. The waist-to-height ratio (WHtR) and waist-hip ratio (WHR) were calculated by dividing both values.
The body composition was measured using a TANITA MC-980 BC analyzer, which is intended for professional use in hospitals and medical facilities, as well as universities for scientific research. The current flows at six frequencies (1 kHz/5 kHz/50 kHz/250 kHz/500 kHz/1000 kHz), which maximizes measurement accuracy. The following parameters were taken into account: body weight in kilograms, body fat (BF) mass in percentages, muscle mass (MM) in kilograms, total body water (TBW) content in kilograms, and free-fat mass (FFM) in kilograms.
Morning fasting venous blood samples were collected to measure the concentrations of total cholesterol (TCh), HDL cholesterol (HDL-C), and triglycerides (TG). TCh, HDL-C, and TG levels were analyzed enzymatically (Beckman Coulter, Brea, CA). An oral glucose load test of 1.75 g/kg was performed, with the determination of glucose and insulin levels at two time points: 0' and 120'. An enzymatic test (hexokinase method) was used for the quantitative determination of glucose (Beckman Coulter). Insulin was determined using a chemiluminescence immunoassay on an IMMULITE 2000 analyzer. Insulin resistance (IR) was measured using the HOMA index (HOMA-IR), calculated as fasting glucose [mg/dl] × fasting insulin [µUI/ml] /405 [12]. The fasting insulin [mIU/l]-to-glucose [mg/dl] ratio was also used as an index of IR, with a ratio > 0.3 considered indicative of IR [13].
Additionally, TSH (thyroid-stimulating hormone), free thyroxine (fT4), and insulin-like growth factor 1 (IGF-1) were also determined. Serum concentrations of fT4 and TSH were measured with a chemiluminescent immunometric assay (IMMULITE 2000 Free T4 and IMMULITE 2000 Third Generation TSH, respectively; Siemens), and IGF concentration was measured by solid-phase enzyme-labeled chemiluminescent immunometric assays (IMMULITE, DPC).
Statistical analysis
Data processing and statistical analyses were performed using STATISTICA v.13 (license No. JPZ804I382130ARCN10J) software and Microsoft Excel (2013). The distribution of quantitative values was evaluated according to the Shapiro-Wilk test.
Given the non-normal distribution of quantitative variables, their descriptive statistics were presented as the median (Me) and lower (Lq) and upper (Uq) quartiles. Comparative analysis of quantitative indicators in three or more groups was performed using the Kruskal–Wallis H test, which was considered significant at p < 0.05.
Comparisons of groups were performed using the Mann–Whitney U test with Bonferroni correction to assess the level of statistical significance.
The Pearson chi-square test (χ2) was used to analyze frequencies. To evaluate the possible associations between the studied data, Spearman correlation coefficients were determined. The significance of the differences between the values was considered significant at p < 0.05.
Bioethical standards
The study followed the ethical standards of the Declaration of Helsinki of 1975, as revised in 2013, as well as national laws. Patient safety rules and the ethical standards and procedures for research on human beings were followed. The idea of evaluating metabolic parameters and body mass composition in girls with TS was approved by the Ethics Committee of the Medical University of Silesia (resolution number NN-013-96/I/03 and KNW/0022/KB1/162/15/16).
Results
The study group consisted of 21 TS patients with median age 10 ±2.8 years. None of the patients had hypertension at the start of therapy. Of the 13 patients continuing therapy after 5 years (mean age 14.7 ±2.8 years), arterial hypertension was observed in 1 girl.
The only BC parameter that increased significantly during GH therapy, apart from weight and height, was FFM. The details related to clinical and laboratory parameters are demonstrated in Tables I and II.
Table I
Dynamics of changes in anthropometrical parameters in patients with TS depending on GH therapy duration (Lq; Uq)
hSDS – height standard deviation; BMI – body mass index; BMI Z-score – body mass index Z-score; WC – waist circumference; HC – hip circumference; WHR – ratio of waist circumference to hip circumference; WHtR – ratio of waist circumference to height; BF – body fat; MM – muscle mass; TBW – total body water; FFM – fat-free mass
Changes in carbohydrate and lipid parameters in the course of GH therapy included an increase in insulin and insulin 120' levels, as well as an increase in insulin resistance during treatment, without statistically significant differences in glucose concentration during GH treatment. Total cholesterol decreased during therapy, with no statistically significant changes in its individual fractions. An increase in IGF-1 concentration was also observed during treatment (Table II). The correlation between BC characteristics and metabolic parameters is presented in Figure 2. Apart from the clear correlation between BC and duration of therapy, no significant correlations were found between BC, glucose, and cholesterol levels during the GH 5-year follow-up.
Figure 2
Correlation between body composition characteristics and metabolic parameters (heat map)
BF – body fat; FFM – fat-free mass; HC – hip circumference; HDL – high-density lipoprotein; MM – muscle mass; WC – waist circumference; TBW – total body water; Tch – total cholesterol; TG – triglicerydes
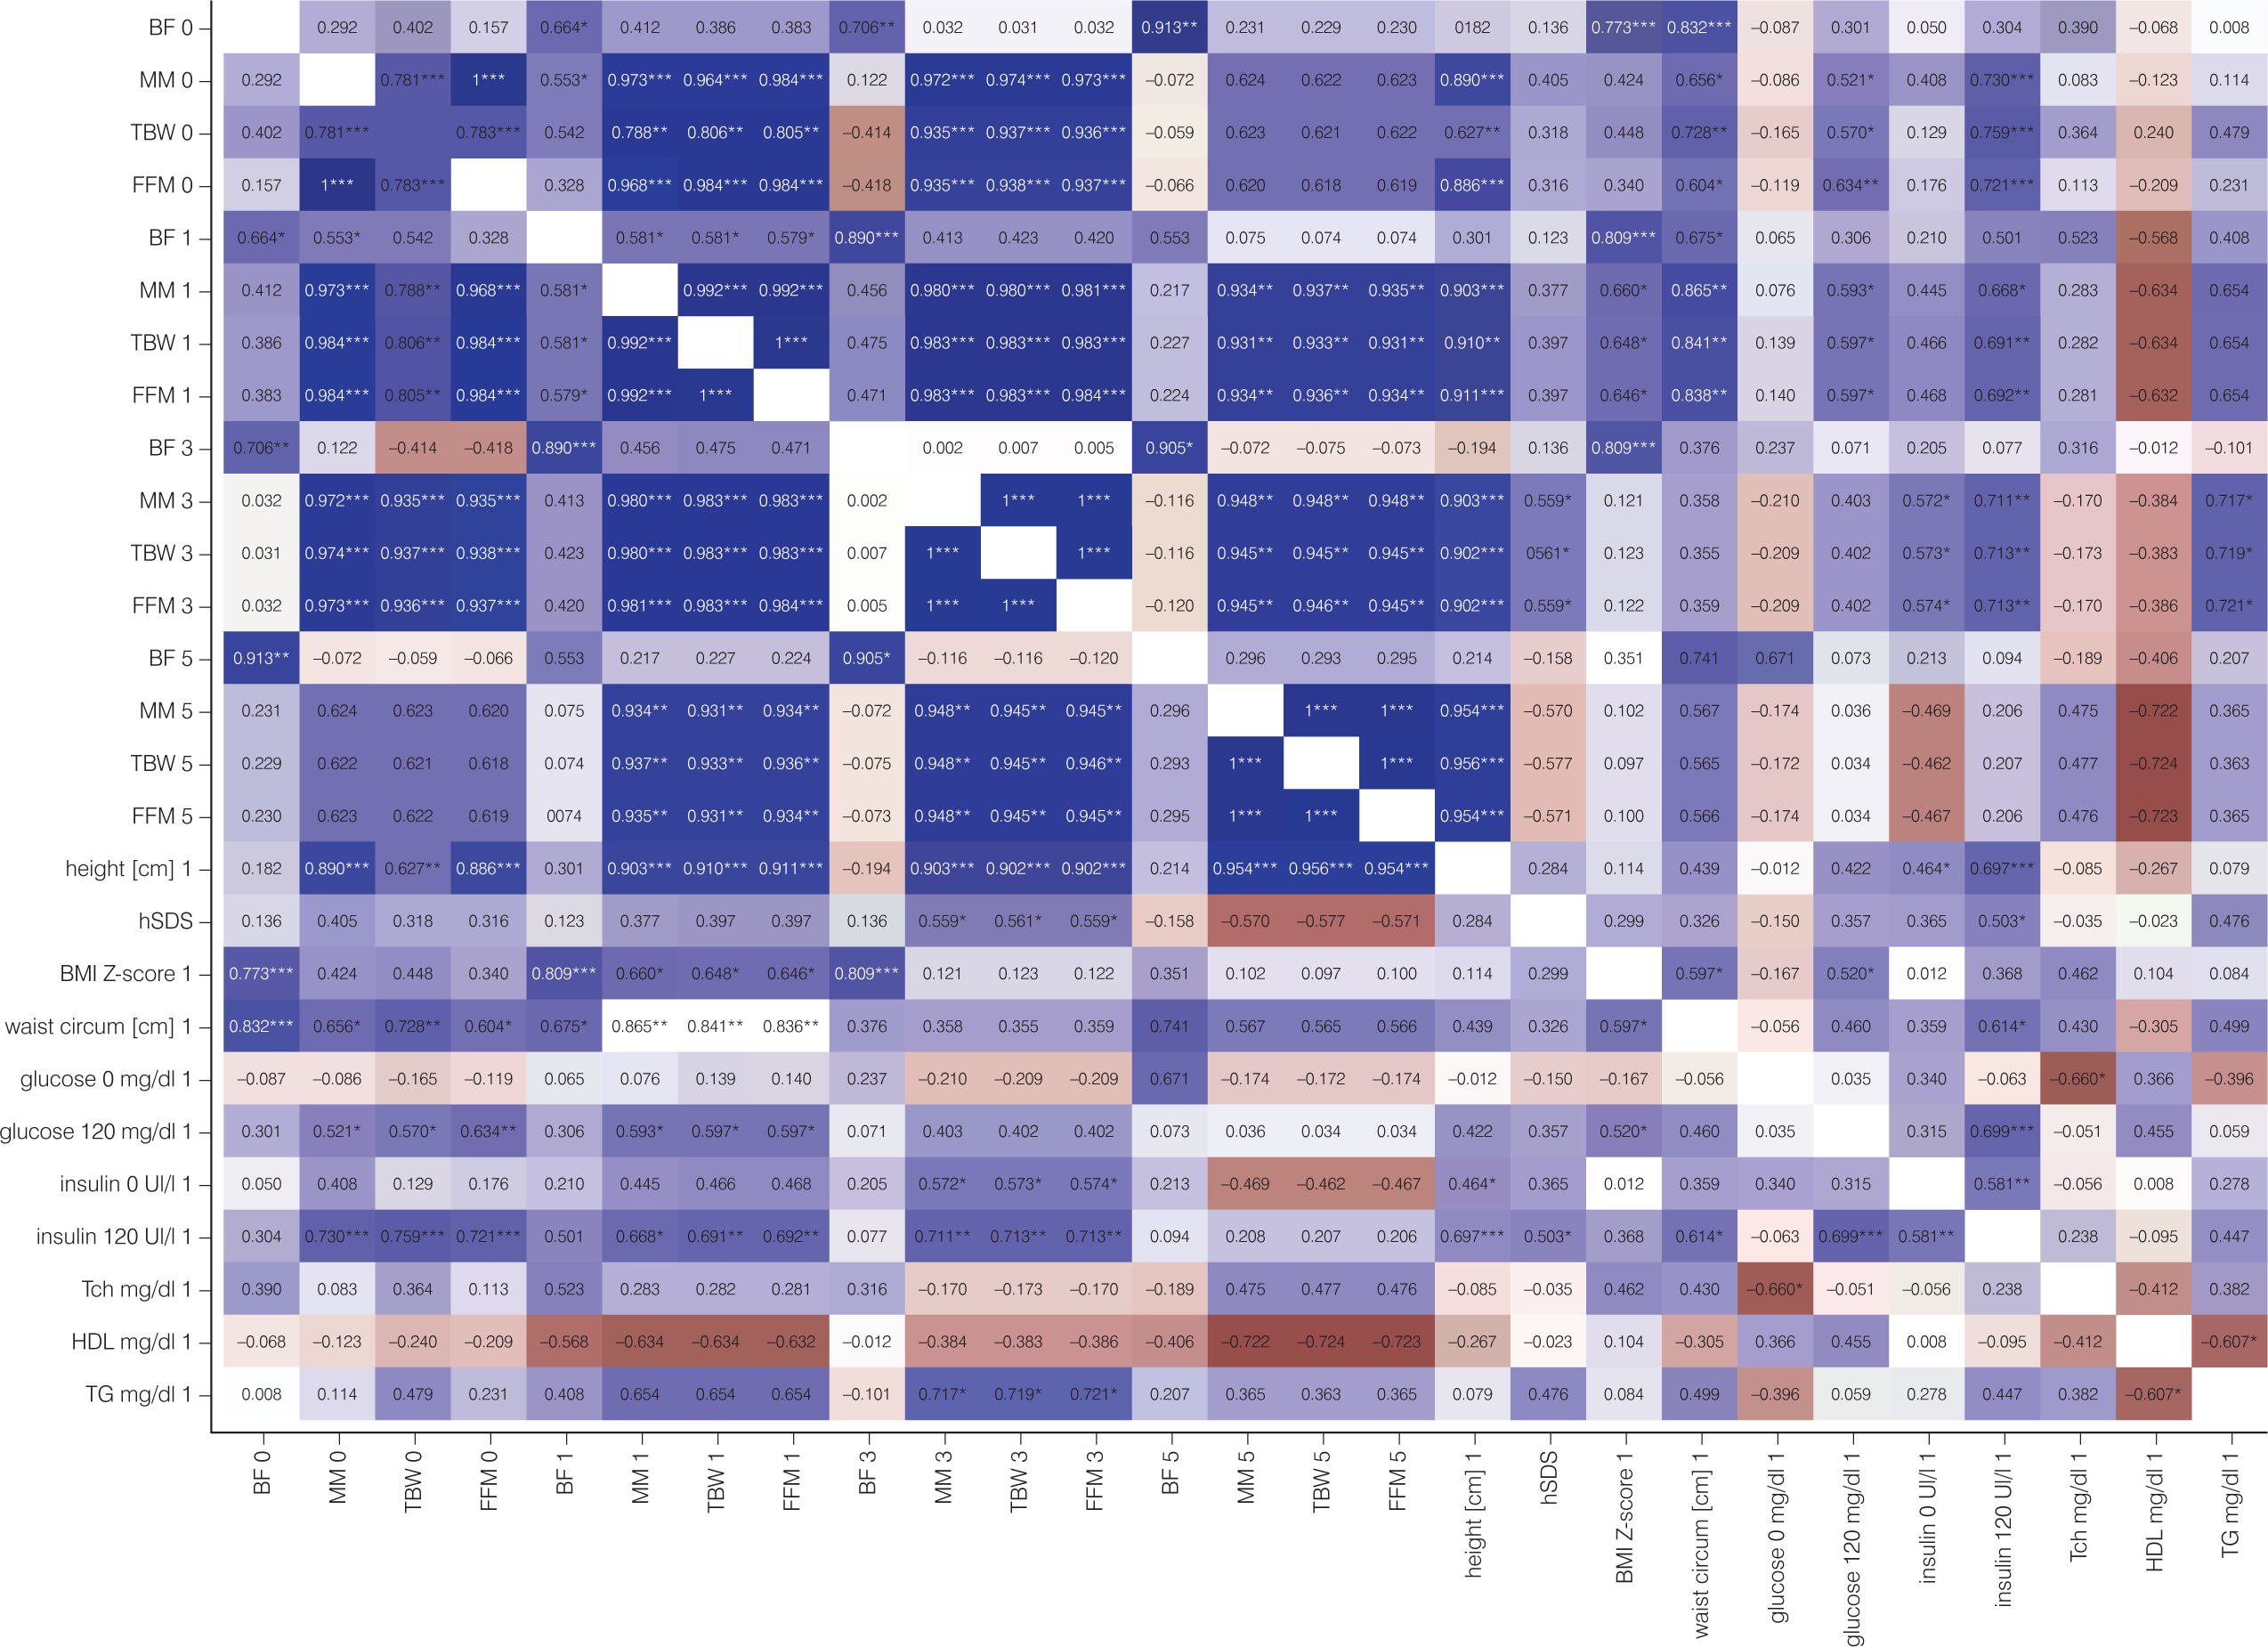
Table II
Dynamics of carbohydrate and lipid parameters in patients with TS depending on GH therapy duration (Lq; Uq)
Pubertal changes were associated with key markers of BC, such as MM and FFM (p = 0.001).
Discussion
Patients treated with GH, while achieving accelerated growth and attaining an appropriate final height, gain beneficial effects on BC [14–16]. The same effect was observed in TS patients. Wooten et al. reported that abdominal adiposity was significantly lower in GH-treated vs. untreated TS girls, with an increase in the volume of MM and improvement of the proportion of MM to BF in treated girls. The study also revealed that effects were independent of estrogen exposure and were still observed in girls who finished GH treatment at least one year after the end of therapy [17]. Research by Polish authors on a group of TS patients after GH treatment vs. untreated patients revealed that a decrease in BF persists for several years after finishing GH treatment [18], which confirms the beneficial effect of the therapy.
It is known that inadequate BC is a predictor of cardiovascular risk, including TS patients [16]. Therefore, it seems that the effect of GH treatment has a protective effect in the context of cardiovascular diseases. However, it should not be forgotten that although GH therapy is associated with favorable changes in body composition, it is also connected with relative impairment of glucose tolerance and insulin sensitivity [19]. Our study revealed an increase in insulin, insulin 120', as well as insulin resistance. These are expected effects of GH treatment, especially since we use supra-substitution doses of GH in patients with TS. Thus, glucose metabolism should be monitored carefully during long-term GH treatment in these patients.
We also observed a decrease in TCh concentration during therapy. Individual lipid fractions did not show statistically significant changes. Similarly to our previous study with a 10-year follow-up, we did not observe a statistically significant difference in the serum triglycerides and HDL-C levels during GH therapy [7]. Bannink et al. revealed that TCh, LDL, and HDL increased after GH treatment discontinuation compared to 6 months after GH treatment. The atherogenic index remained constant, though lower than in controls; hence, GH therapy in girls with TS seems to have beneficial effects on serum lipids, visible even a few years after discontinuation of GH therapy [20].
In our study, no significant correlations were found between BC parameters, glucose, and TCh during the GH 5-year follow-up. This study may be limited by the small number of participants, potentially affecting the generalizability of the findings to the larger TS population. This limitation might reduce the statistical power and precision of the results. Variability in age during inclusion in the study and pubertal status among participants may also add some confounding variables.
The strength of our study is that it is a long-term prospective observation in patients with a rare disease carried out at one center, following a uniform protocol.
In addition to the clear effect of GH on the growth of treated patients, GH therapy also seems to be important in the context of cardiometabolic disturbances. Its positive influence is visible in the context of BC. However, parameters of carbohydrate metabolism should be monitored due to the increase in insulin resistance during GH therapy. Additionally, exercise should be promoted as a general component of a healthy lifestyle. Current recommendations for children with TS include at least 60 minutes of daily moderate to vigorous activities [21], especially as they have lower total lean body mass, and their VO2max and physical activity levels are significantly lower compared to controls [2]. At our center, there is also good cooperation with a dietitian and a psychologist to strongly emphasize the importance of lifestyle.


