
Introduction
Melanogenesis is the biosynthetic process responsible for the production of melanin pigments in melanocytes, leading to the formation of brown–black eumelanin and yellow–red pheomelanin [1]. Melanin, synthesised and stored in melanosomes, protects against ultraviolet (UV) radiation by absorbing UV and visible light [2–4]. Key enzymes such as tyrosinase (TYR) and dopachrome tautomerase (DCT) determine both the quantity and type of melanin produced [5, 6]. The process begins with the oxidation of L-tyrosine to dopaquinone by TYR, leading either to eumelanin formation or, in the presence of cysteine, to pheomelanin synthesis through benzothiazine intermediates [7–9]. The cAMP-dependent signalling pathway regulates melanogenesis by activating protein kinase A, which induces transcription of microphthalmia-associated transcription factor (MITF), which controls melanosome biogenesis, maturation, and transport [10, 11]. Hormonal regulation via α-MSH/MC1R (melanocyte stimulating hormone/melanocortin 1 receptor) determines the eumelanin-pheomelanin balance, while transcription factors SOX9, SOX10, and PAX3 modulate MITF expression and melanocyte proliferation [12–15].
Both pheomelanin and eumelanin are capable of protecting the skin against harmful UV radiation [2, 16]. However, pheomelanin acts as a photosensitizer, generating reactive oxygen species (ROS) that increase susceptibility to sunburn, photoaging, and melanoma [17, 18]. Its photoreactivity, intensified by zinc, contributes to oxidative DNA damage and reduced antioxidant capacity [19]. Moreover, a high pheomelanin content reduces cysteine availability, impairing T lymphocyte function and immune surveillance against mutated cells [20, 21]. In contrast, eumelanin effectively absorbs UV and scavenges free radicals, providing stronger genoprotection. The genoprotective function of melanin seems to be of particular importance in skin cancers, including malignant melanoma, which are associated with sunlight exposure [22]. Several mechanisms contributing to pheomelanin-induced carcinogenesis are linked to enhanced production of ROS, abundantly generated during its synthesis [23]. Pheomelanin synthesis requires large amounts of antioxidants, which in turn depletes antioxidants such as glutathione (GSH), rendering melanocytes more vulnerable to damage. Many studies have demonstrated a relationship between GSH deficiency, resulting from its utilisation in pheomelanin synthesis, and cellular oxidative stress [24, 25]. Moreover, the presence of sulphur in the aromatic ring of pheomelanin lowers its ionisation potential, making it less stable when generating ROS compared with eumelanin [26]. In recent years, suggestions have emerged that the mechanism of malignant transformation in melanocytes may involve chemiexcitation of melanins under oxidative stress, leading to UVR-independent formation of highly mutagenic cyclobutane pyrimidine dimers (CPDs). Studies have shown that pheomelanin is a much stronger generator of CPDs than eumelanin [26, 27].
In melanomas, TYR and other melanogenic enzymes are often overexpressed; therefore, tyrosinase and melanogenic metabolites in blood and urine serve as biomarkers for diagnosis and monitoring [28–30]. TYR functions as part of a complex with TYRP1 and DCT, and mutations in these genes disrupt pigmentation and melanosome formation [31–33]. Reduced activity of TYR or DCT promotes pheomelanin synthesis [19, 34]. Binding of agouti signalling protein to MC1R inhibits MITF and shifts melanin production toward pheomelanin, whereas α-MSH promotes eumelanin synthesis [35, 36]. Mutations in proopiomelanocortin (POMC), the precursor of α-MSH, or in MC1R reduce α-MSH signalling, leading to excessive pheomelanin and increased melanoma risk [37, 38].
A shift in the eumelanin/pheomelanin ratio toward pheomelanin is also associated with decreased intracellular cysteine levels [30, 38]. The SLC7A11 gene encodes the xCT cystine/glutamate antiporter, essential for cysteine transport and GSH synthesis. Reduced SLC7A11 activity causes cysteine and GSH depletion, promoting oxidative stress and DNA damage [19]. Other genes, including CTNS and SLC45A2, regulate melanosomal pH, a key determinant of pigment type. Acidic pH favours pheomelanogenesis, while neutral pH promotes eumelanogenesis. Mutations in these genes cause melanosomal acidification, reduced pigmentation, and increased melanoma risk [39–45].
In summary, the eumelanin/pheomelanin balance depends on enzymatic activity, cysteine availability, redox status, and melanosomal pH. Genetic mutations or dysregulated signalling pathways can shift melanogenesis toward pheomelanin synthesis, enhancing ROS generation, impairing antioxidant defences, and predisposing to melanoma development.
Aim
This study aimed to assess the expression of selected melanogenic genes, with particular emphasis on those involved in pheomelanin synthesis, in melanoma cell lines exhibiting markedly different pigmentation phenotypes. To confirm these pigmentation differences, the content of melanin-related markers was determined using Py-GC/MS/MS analysis. The amelanotic C32 and melanotic G361 lines were used as models to determine whether reduced pigmentation is associated with enhanced expression of pheomelanin-related genes. Understanding these molecular differences may help explain phenotypic variability in melanoma and provide insight into the biological basis of amelanotic and melanotic melanoma.
Material and methods
Material
Human melanoma cell lines C32 (CRL-1585™) and G361 (CRL-1424™) were obtained from American Type Culture Collection (ATCC, Manassas, VA, USA). McCoy’s 5A Medium (modified with L-glutamine and sodium bicarbonate), penicillin-streptomycin solution (10 000 U penicillin, 10 mg streptomycin/ml), foetal bovine serum (FBS), 0.25% trypsin-EDTA solution and hydrochloric acid (HCl) were purchased from Merck, Sigma-Aldrich (St. Louis, MO, USA). HEPES (4-(2-hydroxyethyl)-1-piperazineethanesulfonic acid, 1M) was obtained from Gibco, ThermoFisher Scientific (Grand Island, NY, USA). Dulbecco’s phosphate buffered saline (DPBS) was obtained from Gibco, Life Technologies (Paisley, UK).
Cell cultures
C32 and G361 melanoma cells were grown in the monolayer in McCoy’s 5A Medium, supplemented with HEPES (10 mM), FBS (10%) and antibiotics (penicillin 100 U/ml, streptomycin 100 μg/ml). Cells were seeded into tissue culture flasks at the density of 8 × 10⁴ cells/cm2 and incubated at 37°C in a humidified atmosphere of 95% air and 5% CO2. When the melanoma cultures reached about 80% confluence, the cells were washed twice with DPBS.
Melanin analysis by pyrolysis-gas chromatography/tandem mass spectrometry (Py-GC/MS/MS)
Melanoma cells were detached with 0.25% trypsin–EDTA at 37°C, and trypsinisation was halted by adding an equal volume of complete medium. The resulting cell suspensions were mixed, and cell number was assessed using the Cell Viability Reagent and an ADAM-MC2 counter (NanoEntek Inc., Hwaseong-si, Korea). The cells were then centrifuged (20 000 g), the pellets were photographed immediately, and the resulting material was subsequently designated for Py/GC/MS/MS analysis. For this purpose, melanoma cell pellets were transferred to a glass vessel, and 6 M HCl was added to the samples for hydrolytic degradation (a modification of the method described by Ito et al. [46]). The mixtures were then heated at 110oC for 4 h, followed by standing at room temperature for 20 h. The resulting hydrolysates were purified through sequential washing and centrifugation steps. The pellets were washed with distilled water and centrifuged at 30 000 g for 10 min. This procedure was repeated six times until the supernatant reached pH 6. Finally, the purified pellets were dried to a constant weight at 37°C. The pheomelanin content of the isolated pigments was quantified using our previously described method, based on GC–MS/MS detection of specific pyrolysis-derived marker compounds [47]. Details of the instrumentation and the Py-GC–MS/MS operating conditions are provided in the Supplementary materials (Supplementary Table S1). In each pyrolysate, two distinct groups of products were monitored: sulphur containing compounds, which are characteristic of thermally degraded pheomelanin (P markers), and sulphur-free products (NS) [48]. Quantification of pheomelanin was performed using a calibration curve prepared from synthetic melanins [47].
Gene expression analysis (RT-PCR)
Total cellular RNA was extracted from confluent melanoma cell cultures with TRI Reagent® according to the manufacturer’s protocol (Sigma-Aldrich Co, St. Louis, MO, USA). Residual genomic DNA, as well as any traces of melanin were removed using the RNA Clean-up Kit (Syngen Biotech, Wroclaw, Poland). RNA integrity was confirmed by agarose gel electrophoresis. The purity and concentration of the RNA was checked by UV spectrophotometry (MaestroNano MN-913; MaestroGen Inc., Hsinchu, Taiwan). Prior to RT-PCR, the RNA samples were treated with DNase 1 Amplification Grade (Sigma-Aldrich Co, St. Louis, MO, USA) according to the manufacturer’s instructions. For cDNA synthesis, two micrograms of total RNA from each sample was reverse transcribed using the iScript™ Advanced cDNA Synthesis Kit for RT-qPCR (Bio-Rad Laboratories, Inc., Hercules, CA, USA) according to the manufacturer’s instructions.
The real-time PCR reactions were performed with the CFX Connect Real-Time System thermal cycler (Bio-Rad Laboratories, Inc., USA). cDNA was amplified using the SsoAdvanced Universal SYBR® Green Supermix (Bio-Rad Laboratories, Inc., Hercules, CA, USA); 20 μl of PCR mix was added to each well of PrimePCR plate containing primers for melanocyte development and pigmentation genes (Melanocyte development and pigmentation PrimePCR Plate 96; Bio-Rad Laboratories, Inc., Hercules, CA, USA). The list of all genes assessed for expression are provided in the Supplementary materials (Supplementary Table S2). Real-time PCR reactions for SLC7A11 (Hs.390594), SLC45A2 (Hs.278962), CTNS (Hs.187667) and DCT gene (Hs.307865) were performed using individual primers designed for these genes (PrimePCR™ SYBR® Green Assay; Bio-Rad Laboratories, Inc., Hercules, CA, USA).
A thermal cycling program used was: activation at 95°C for 30 s, denaturation at 95°C for 5 s (40 cycles), annealing and extension at 60°C for 30 s (40 cycles) and melt curve at 65–95°C (0.5 increments, 5 sec/step). Cycle threshold (Ct) values were used to quantify gene expression.
Data analysis
Py-GC/MS/MS
The fit of the calibration curve was assessed using linear regression. The p-values for the slope and, where applicable, the intercept were calculated, and statistical significance was confirmed for the slope (p-values < 0.05). All analyses were performed using Statistica version 13.3 (TIBCO Software Inc., Palo Alto, CA, USA).
Gene expression
The Ct values (threshold values) of the target genes were normalised against the Ct values of the housekeeping HPRT1 (hypoxanthine phosphoribosyltransferase 1; Hs.412707) gene, which exhibited a relatively high expression stability in melanoma cell lines [49]. The transcript level of HPRT1 was comparable between the two lines, confirming the accuracy of normalisation. Each sample was analysed in a minimum of three independent replicates, and the mean value was used in the statistical analysis.
The fold change in gene expression between the melanoma G361 and melanoma C32 pair was calculated using the relative quantification 2−ΔΔCt method. Two-fold or more differences in gene expression between C32 and G361 were considered significant.
Statistical analysis
Data represent the mean ± SEM from three independent experiments. The Shapiro–Wilk test was used to assess the normality of the data. One-way analysis of variance followed by post-hoc Tukey’s test (TIBCO Software Inc. Statistica version 13.3) were used for group comparisons. P-values < 0.05 were considered statistically significant.
Results
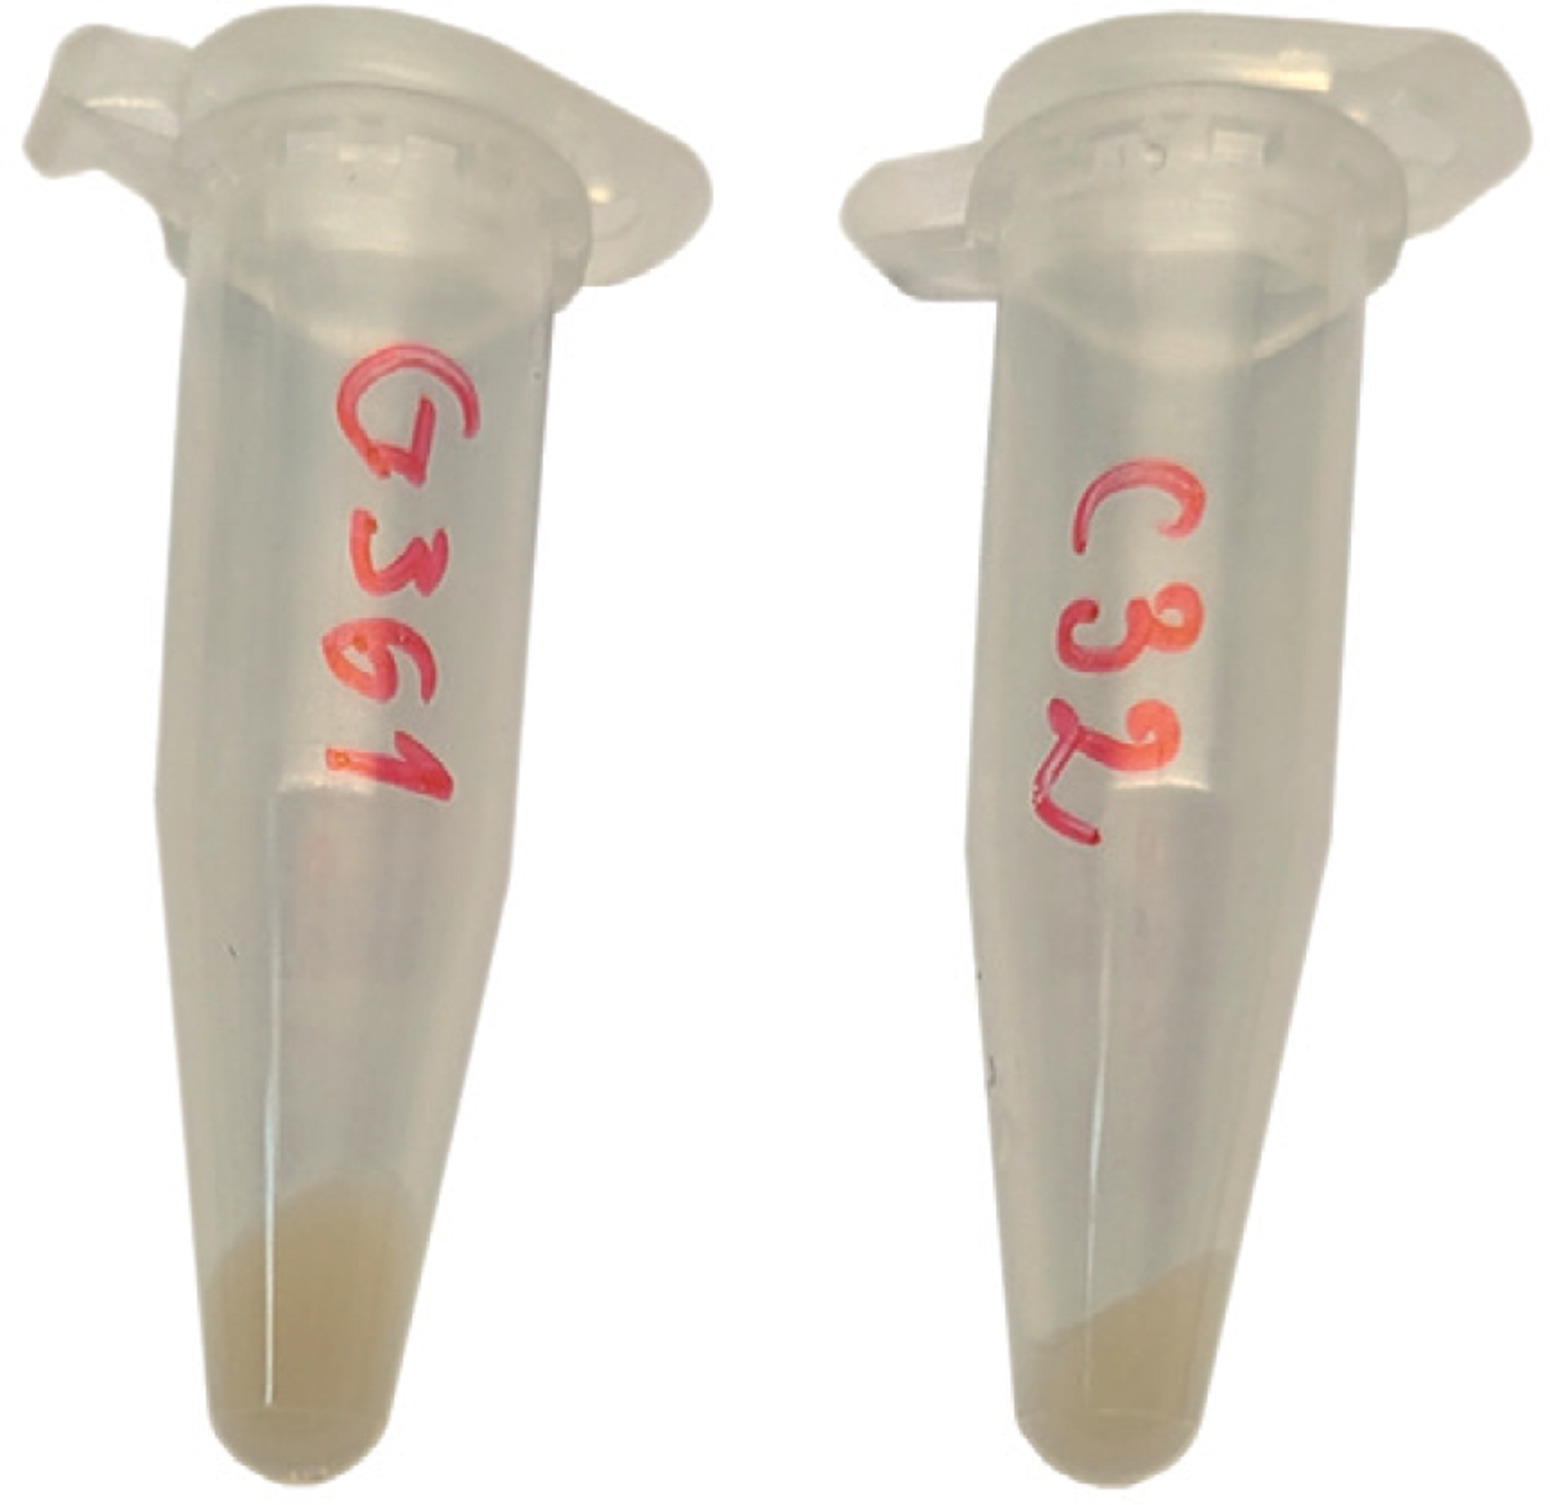
As an initial qualitative assessment, the appearance of cell pellets from the amelanotic C32 and melanotic G361 melanoma cell lines was examined. Pellets were prepared from equivalent numbers of cells in both cultures (32 × 106 cells). Overall pigmentation was comparable between the two cell lines, although G361 pellets exhibited a slightly deeper hue than those of C32 (Figure 1).
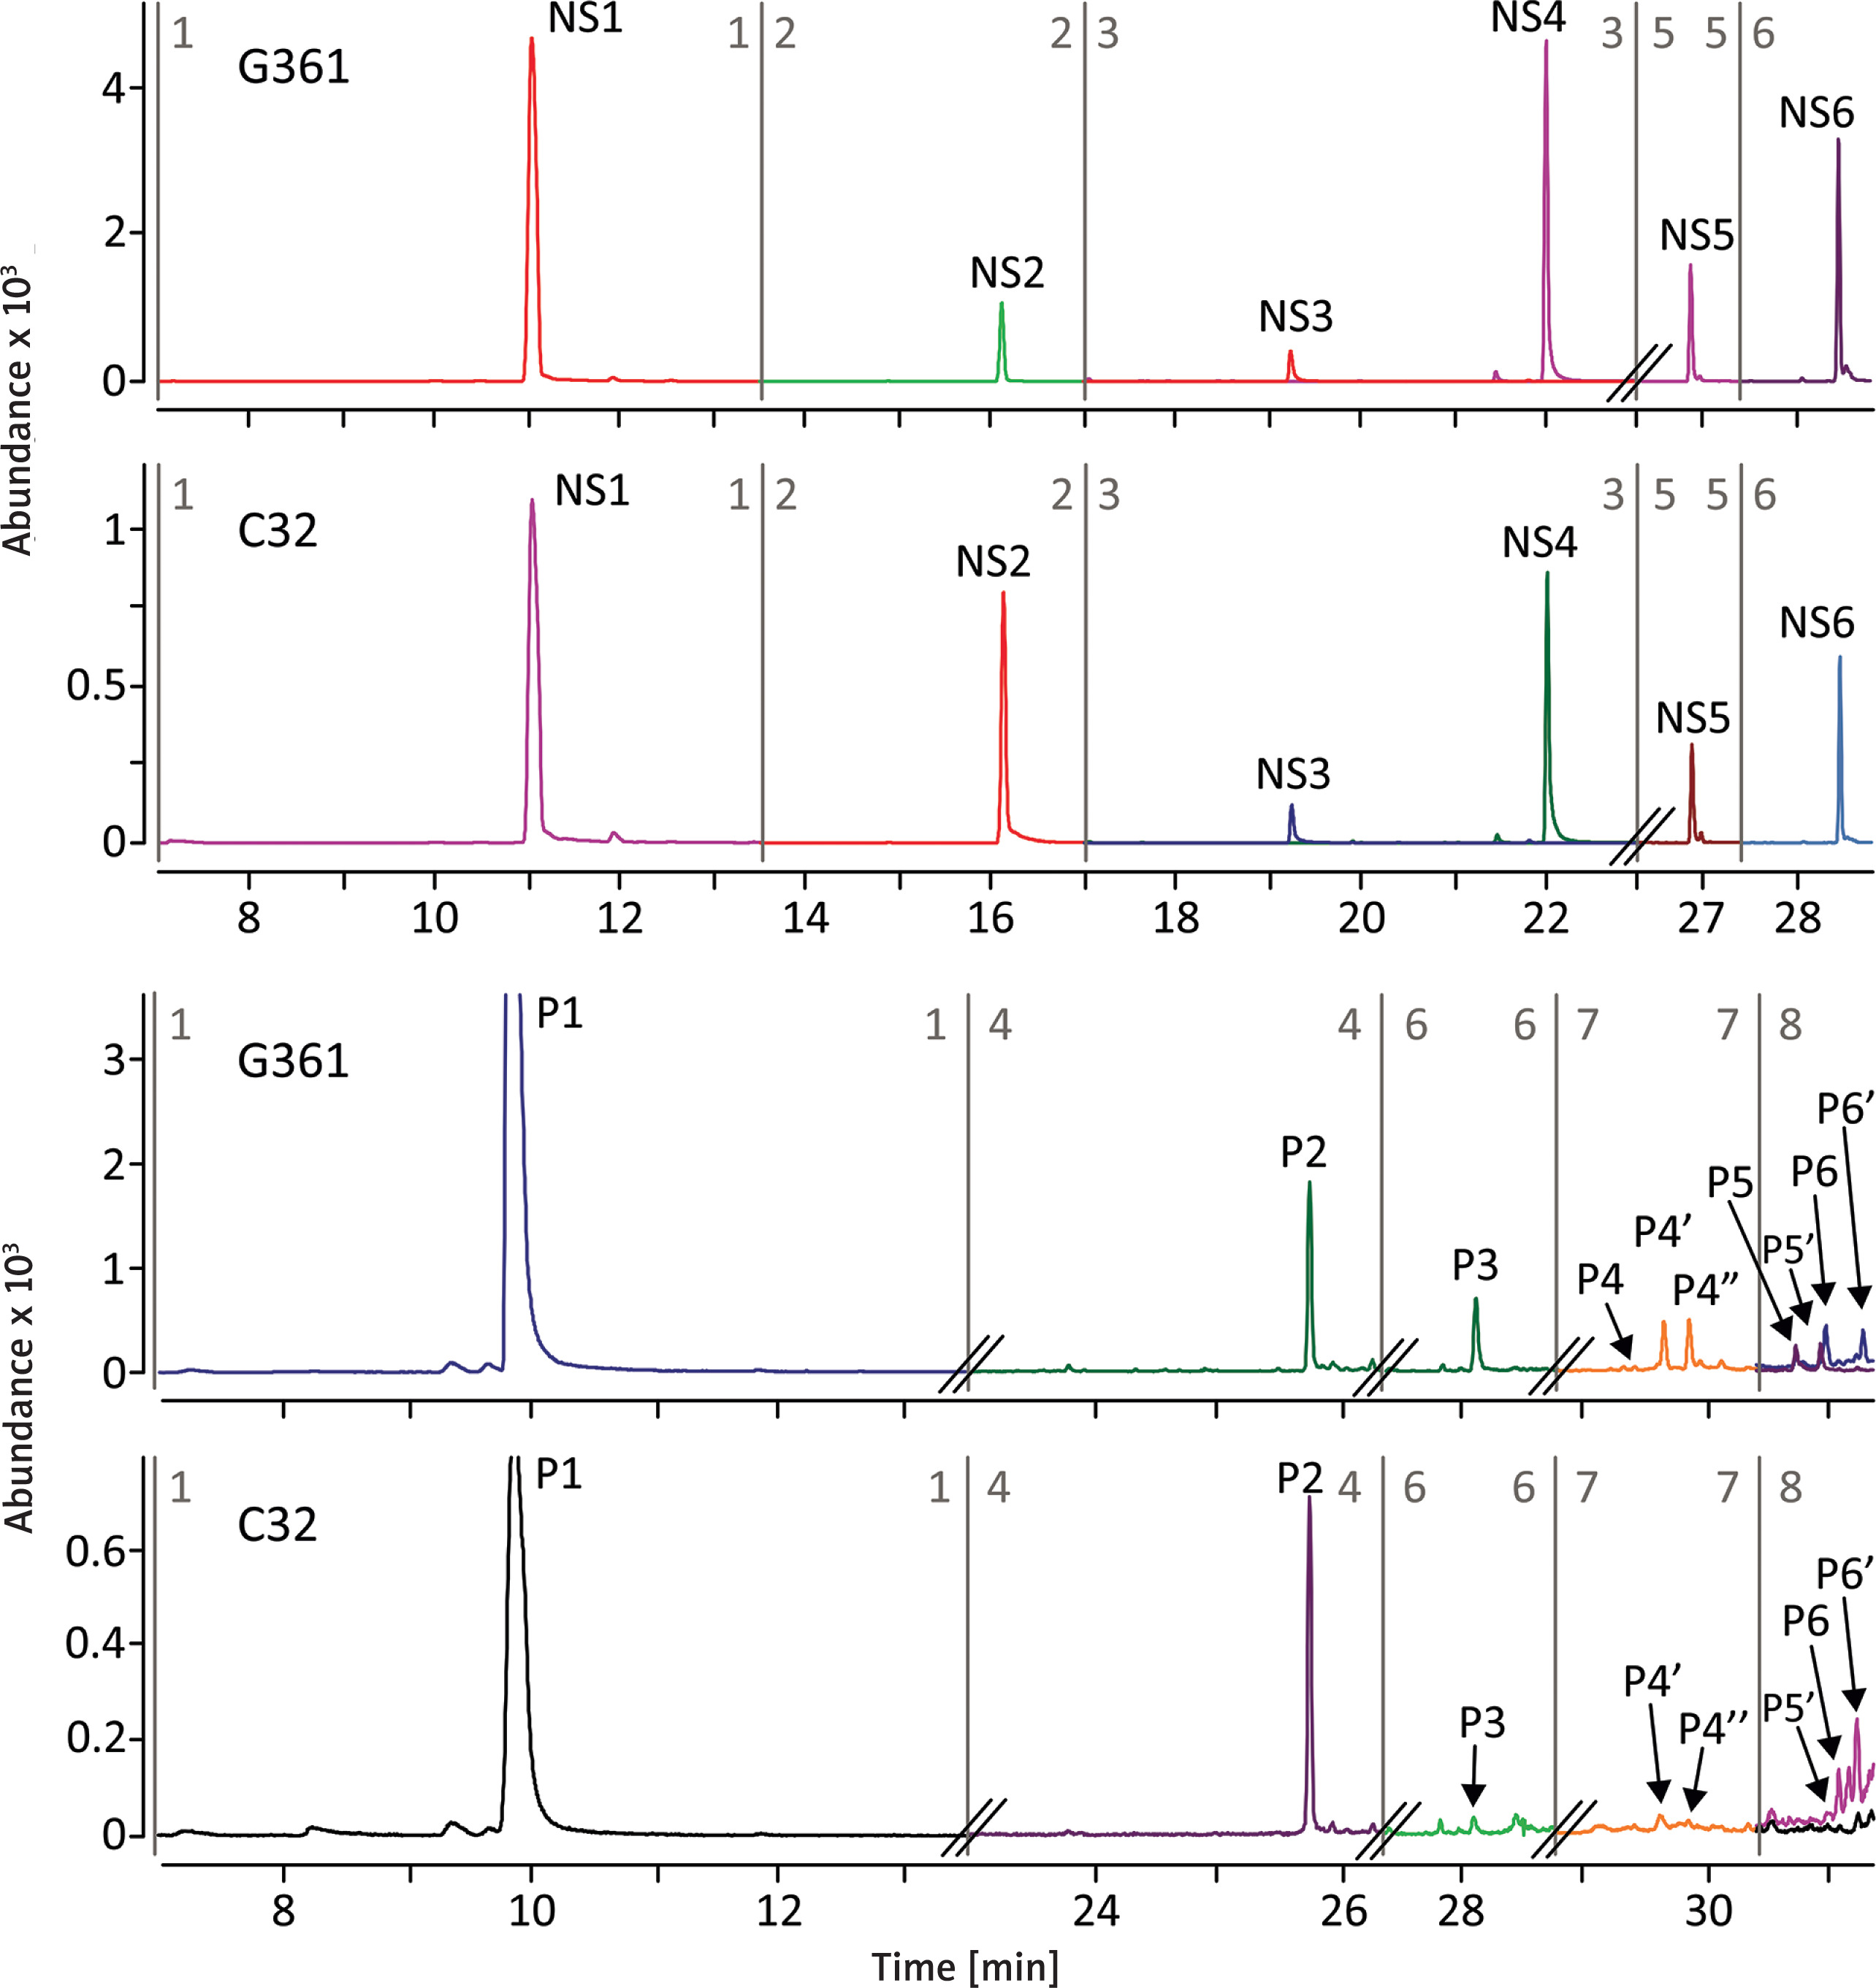
Visual observations were supplemented with chromatographic analysis. Figure 2 shows chromatograms of sulphur-free (NS) pyrolysis products and pyrolytic pheomelanin (P) markers derived from melanin isolated from G361 and C32 melanoma cell cultures. The melanin isolation procedure, conducted under strongly acidic and high-temperature conditions (6 M HCl, 110°C), ensured complete removal of the protein component, so that the NS compounds can be assumed to originate exclusively from melanin, whereas the sulphur-containing P markers are characteristic solely of pheomelanin. The analysis clearly confirmed the presence of both eumelanin and pheomelanin components in the melanoma cell lines examined. Pheomelanin constituted a small fraction of the total melanin, representing 0.52% in C32 cells and 0.78% in G361 cells. Quantification of overall melanin content, calculated as the sum of NS and P markers and normalised per one million cells, revealed that C32 cells contained 62% less melanin than G361 cells. These results indicate not only a pronounced difference in total pigmentation between the two cell lines, but also suggest that G361 cells have a relatively higher contribution of pheomelanin to their melanin pool, which may reflect underlying differences in melanogenic activity and pathway regulation.
Figure 2
Extracted MRM chromatograms of the non-sulfur-containing pyrolysis products (NS) and pyrolytic pheomelanin markers (P) obtained from melanin isolated from melanoma G361 and C32 cell cultures. Each peak corresponds to the most intense MRM transition. Peak designation: NS1: toluene, NS2: styrene, NS3: phenol, NS4: methylphenol, NS5: indole, NS6: methylindole, P1: thiazole, P2: benzothiazole, P3: 4-hydroxybenzothiazole, P4: 2,3-dihydro-5h-1,4-benzothiazin-5-one (and its isomers P4′, P4″), P5: methyl-2,3-dihydro-5h-1,4-benzothiazin-5-one (and its isomer P5′), P6: 4-hydroxy-6-ethylbenzothiazole (and its isomer P6′)
To explore the molecular basis underlying these differences in melanin and pheomelanin content, we next assessed the expression of genes involved in pheomelanogenesis in both melanoma cell lines. RT-PCR analysis of a panel of 40 genes associated with melanocyte development and pigmentation, performed using a plate containing primers specific for these genes, showed detectable expression of all genes in both melanoma cell lines (Figure 3). Among these, six genes (KIT, KITLG, MC1R, POMC, PRKCB, and TYRP1) exhibited the most pronounced differential expression.
Figure 3
Comparative expression of genes involved in development and pigmentation in amelanotic C32 and melanotic G361 melanoma cells. The bar graphs depict mRNA expression levels (Ct values) normalized to HPRT1 (mean ± SD), where higher bars indicate lower gene expression. Ph – pheomelanogenesis-associated genes
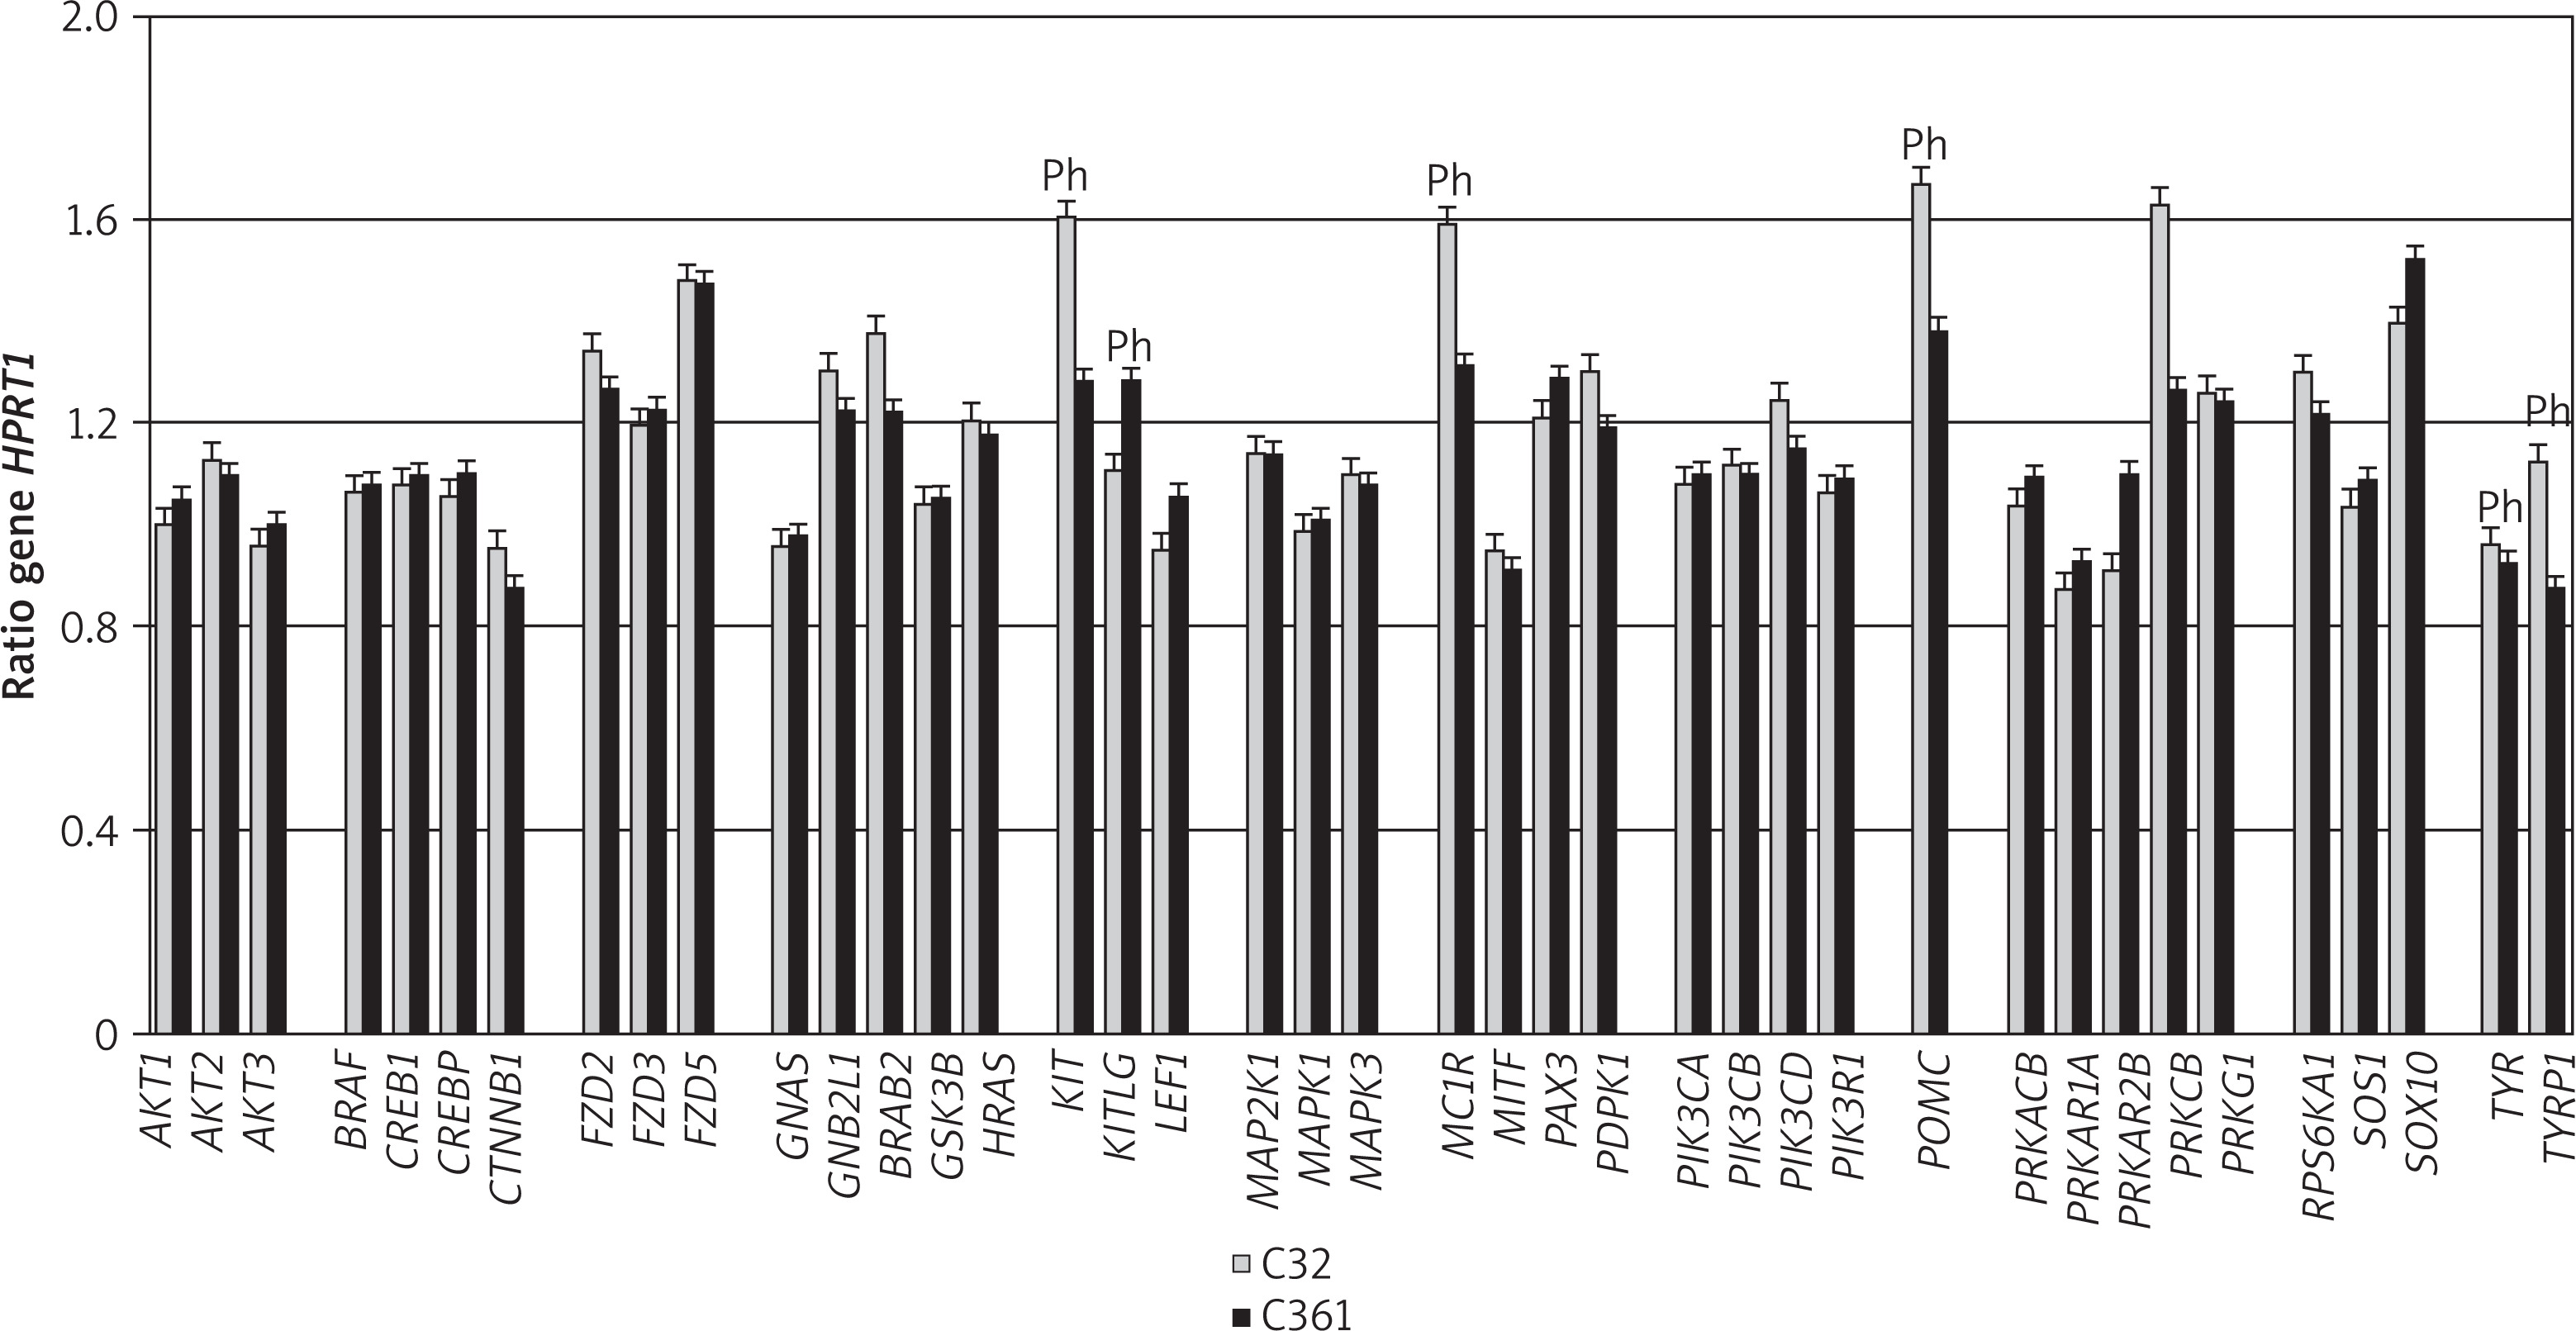
Several genes were consistently expressed at high levels in both cell lines, including CTNNB1, GNAS, MITF, PRKAR1A, and TYR. By contrast, high expression restricted to the C32 line was observed for LEF1 and PRKAR2B, whereas TYRP1 was highly expressed only in the G361 line.
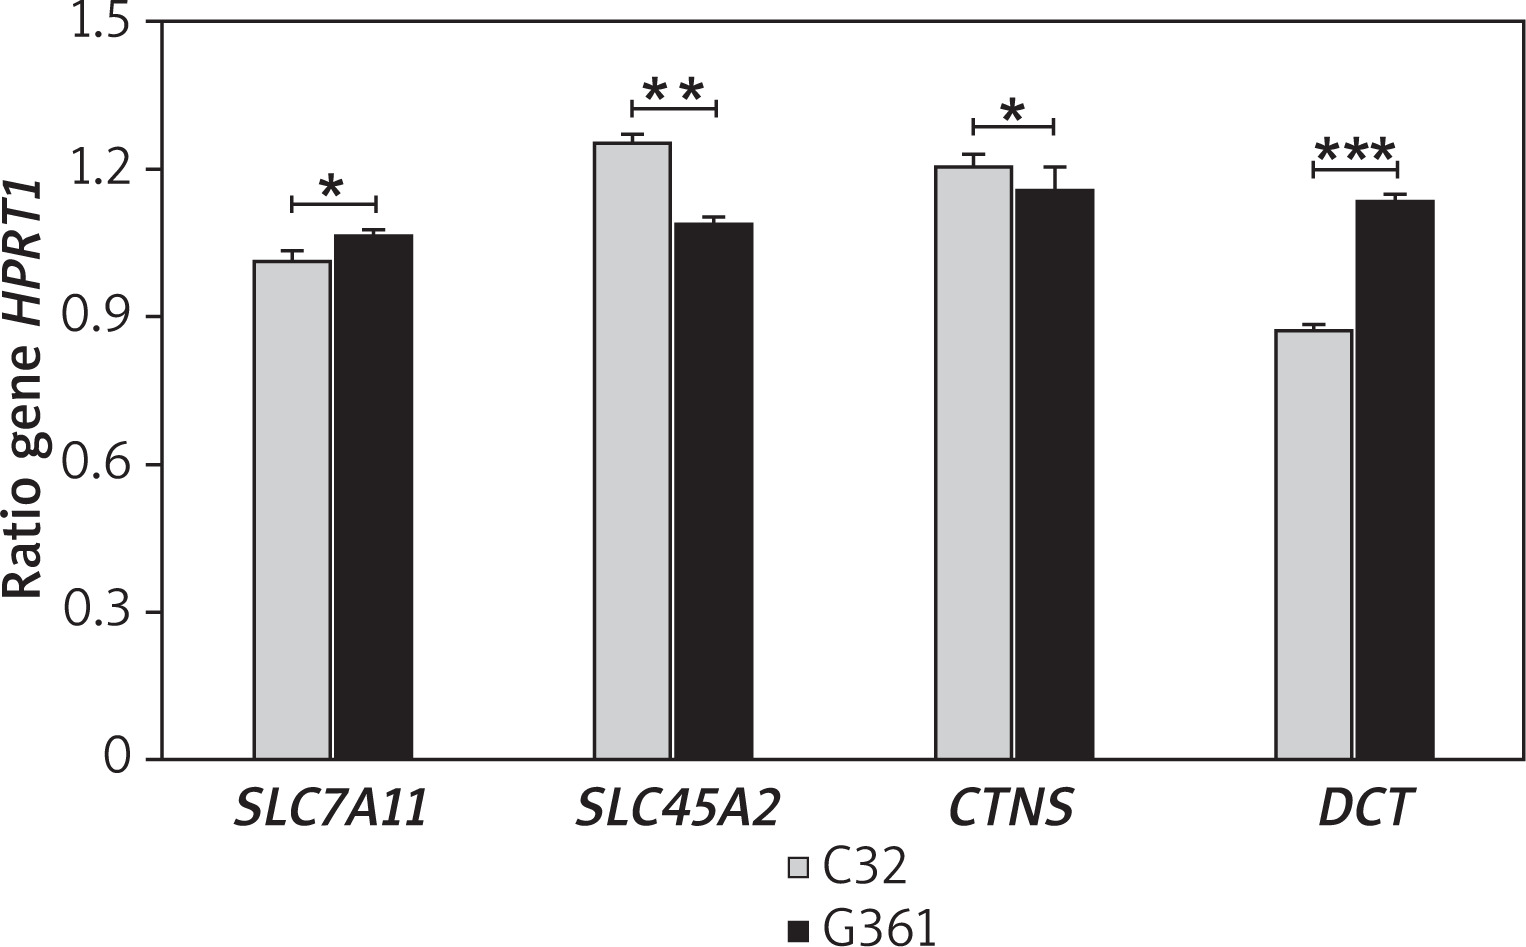
Differential expression was observed for three genes encoding transport proteins involved in pheomelanogenesis (Figure 4). SLC7A11 and CTNS expression differed significantly between the two lines (p < 0.05), while SLC45A2 showed an even greater divergence (p < 0.01). Taken together, the melanotic line was characterised by higher expression of SLC45A2 and CTNS, whereas the amelanotic line showed elevated expression of SLC7A11. Unexpectedly, DCT expression was elevated in the amelanotic melanoma cell line relative to the melanotic counterpart. The observed difference in gene expression was highly statistically significant (p < 0.001).
Figure 4
Expression of pheomelanogenesis-related genes in amelanotic (C32) and melanotic (G361) melanoma cells. The bar graphs represent mRNA expression levels normalized to HPRT1 (mean ± SD), with bar height inversely correlated with gene expression. Statistical significance: *p < 0.05, **p < 0.01, ***p < 0.001
Significant differences in gene expression between the melanoma cell lines studied were defined using a threshold of a twofold relative ratio (R ≥ 2). Using this criterion, 13 genes exhibited higher expression in the C32 line (Table 1), while as many as 20 genes were more highly expressed in the G361 line (Table 2).
Table 1
Genes responsible for pigmentation and melanocyte development characterised by higher expression in amelanotic C32 melanoma cells than in melanotic G361 melanoma cells
[i] Template cDNA, prepared from melanoma cells total RNA was characterized using the Melanocyte development and pigmentation PrimePCR Plate or PrimePCR™ SYBR® Green Assay(*) for a single gene (Bio-Rad Laboratories, Inc.). Two-fold or greater differences in gene expression between C32 and G361 were considered significant.
Table 2
Genes responsible for pigmentation and melanocyte development characterised by higher expression in melanotic G361 melanoma cells than in amelanotic C32 melanoma cells
[i] Template cDNA, prepared from melanoma cells total RNA was characterized using the Melanocyte development and pigmentation PrimePCR Plate or PrimePCR™ SYBR® Green Assay(*) for a single gene (Bio-Rad Laboratories, Inc.). Two-fold or greater differences in gene expression between C32 and G361 were considered significant.
The most pronounced differences were observed for PRKCB and KIT, whose expression was increased more than 305-fold and 165-fold, respectively, in G361 cells. Elevated expression of POMC and MC1R was also characteristic of G361, with POMC expressed over 100-fold and MC1R more than 80-fold higher than in C32 cells. Significantly increased expression of TYRP1 was also observed in the non-amelanotic line compared with the amelanotic line, reaching 38-fold higher levels in G361 cells, while TYR expression was approximately two-fold higher. Additional genes showing increased expression in G361 included: GRB2, SLC45A2, PDPK1, PIK3CD, RPS6KA1, FZD2, GNB2L1, CTNNB1, MITF,CTNS, AKT2, FZD5, and PRKG1 (Table 2).
By contrast, genes with higher expression in the amelanotic C32 line included: DCT (37-fold higher), PRKAR2B (over 16-fold higher), and KITLG (11-fold higher), as well as LEF1, SOX10, PAX3, PRKAR1A, PRKACB, AKT1, SOS1, AKT3, CREBBP, and SLC7A11 (Table 1). The data also demonstrate that the amelanotic and melanotic melanoma cell lines exhibit distinct expression profiles of genes associated with pheomelanogenesis.
Discussion
Melanogenesis in the skin plays a crucial protective role against the harmful effects of UVR, and disruptions at different stages of pigment synthesis may contribute to an increased risk of melanoma development [32, 33]. Individuals with blonde hair, blue eyes, and a fair skin complexion, i.e. a phenotype indicative of pheomelanin predominance, are at a higher risk of tumour transformation. However, little is known about the relationship between pheomelanin levels in melanoma cells and clinical features affecting disease progression, and the expression of genes involved in pheomelanogenesis in melanoma remains largely uncharacterised.
We analysed the expression of genes associated with pheomelanogenesis in two commercially available human melanoma cell lines, the amelanotic C32 and the melanotic G361. The G361 line was derived from a dark-brown tumour, whose histological examination revealed cells containing melanin granules, whereas the C32 line originated from a lightly pigmented tumour, with cells exhibiting pale cytoplasm and lacking visible melanin granules [50, 51]. Although the term “amelanotic melanoma” implies a complete absence of tumour pigmentation, these lesions are thought to contain melanin and may be enriched in pheomelanin. This assumption is supported by the observations of Wang et al. [52], who used Coherent Raman scattering microscopy to examine unstained sections of cutaneous tumours and found that pheomelanin was absent in the surrounding normal skin but present at high levels in all amelanotic melanoma lesions. In a study by Lee et al. [53], the authors compared melanosomes from melanotic and amelanotic melanomas and found that amelanotic lesions predominantly contained “pheomelanin melanosomes”, whereas melanotic lesions were enriched in eumelanin-type melanosomes.
In our study, very subtle variations in the pigmentation of cell pellets were observed, suggesting that any differences in melanin content between the two cell lines under in vitro conditions are not detectable at the macroscopic level. These observations underscore the limitations of visual assessment and highlight the importance of chemical and molecular analyses of melanin for studying its role in melanoma cells. Quantitative data on pheomelanin in melanoma lines explicitly classified as “amelanotic” are scarce. Most available studies examine whole tumours, heterogeneous cell populations and cell lines with differing malignant potential, and many do not distinguish pheomelanin from eumelanin or employ pheomelanin-specific analytical methods. In studies that have since become part of the canonical literature, Ito and Jimbow [54] reported that melanoma colour – whether visibly dark or light – does not reliably correlate with pheomelanin content. In our study, based on the detection of pheomelanin-specific markers using Py-GC/MS/MS, we confirmed the presence of pheomelanin in both melanotic and amelanotic melanoma cells. Its relative contribution was 0.78% in the melanotic G361 cell line and 0.52% in the amelanotic C32 cell line. The comparatively lower pheomelanin content in amelanotic C32 cells indicates potential differences in melanogenic activity and pathway regulation relative to melanotic G361 cells. Key regulators of melanogenesis, such as TYR, TYRP1, TYRP2/DCT, SLC7A11, and MC1R, could be expressed at lower levels or exhibit reduced activity in C32 cells, thereby limiting pheomelanin synthesis. In addition, signalling pathways that govern the balance between eumelanin and pheomelanin production, including the MC1R–cAMP–MITF axis, may be shifted in favour of decreased pheomelanogenesis. These observations provide a rationale for the subsequent analysis of differences in gene expression associated with pheomelanin synthesis between the two cell lines. In our study, we primarily focused on evaluating the expression of genes associated with melanocyte development and pigmentation, classifying them according to their direct or indirect involvement in pheomelanogenesis. Particular attention was paid to TYR, TYRP1, POMC, MC1R, and DCT. The obtained results indicate that TYR expression was lower in C32 cells compared with G361 cells. As tyrosinase is the key enzyme in melanogenesis, reduced expression may limit its activity, favouring pheomelanin synthesis, consistent with observations in atypical nevi and melanomas [19]. Similarly, Hu et al. [55] reported lower total eumelanin in choroidal melanoma cells compared with normal melanocytes. TYRP1 expression was markedly higher in G361 cells, reflecting enhanced eumelanogenic activity, while MC1R and POMC were also elevated, consistent with an eumelanin-based pigmentary programme [19, 56]. In contrast, the amelanotic C32 line exhibits features favouring pheomelanin synthesis.
Interestingly, DCT expression was elevated in C32 cells despite the lack of visible pigmentation, suggesting non-canonical roles in antioxidant defence and cell survival, potentially maintained by MITF regulation and oncogenic alterations such as BRAF V600E and PTEN loss [57–60].
Transporter genes involved in pheomelanogenesis also differed markedly. SLC7A11 was higher in C32 cells, promoting cysteine uptake and pheomelanin synthesis [61, 62], whereas SLC45A2 and CTNS were elevated in G361 cells, supporting a melanosomal environment conducive to eumelanogenesis [39, 40, 43, 44, 63–66].
Among modulatory genes, PRKCB and KIT were upregulated in G361 cells, supporting proliferation and melanogenic regulation [56, 67–69]. MITF was higher in G361 cells, whereas SOX10 and PDPK1 were elevated in C32 cells, suggesting that melanotic cells are biased towards proliferation while amelanotic cells may adopt a more invasive phenotype [69–71].
Finally, components of the Wnt/β-catenin pathway differed between lines: CTNNB1 and FZD2/5 were higher in G361, consistent with proliferative capacity, while LEF1, PRKAR2B, KITLG, and PAX3 were elevated in C32, potentially promoting invasiveness and metastasis [45, 68, 72].
Conclusions
Our findings reveal that melanoma cell lines with distinct pigmentation phenotypes differ in the regulation of melanogenesis and pheomelanogenesis. Melanotic G361 cells are characterised by a eumelanin-driven, proliferative programme, whereas amelanotic C32 cells exhibit traits favouring pheomelanogenesis and a more invasive phenotype, reflecting distinct regulatory networks that may impact melanoma behaviour and response to therapy. To draw more definitive conclusions, studies involving a larger panel of melanoma cell lines are warranted. Such analyses could further clarify the relationship between pigmentation patterns, melanogenic gene expression, and functional properties of melanoma cells, potentially informing the development of targeted therapeutic strategies.


