
Introduction
The standard of care in nasopharyngeal carcinoma (NPC) management is concurrent chemoradiation followed by adjuvant chemotherapy. Nasopharyngeal carcinoma differs from other head and neck cancers by virtue of its unique clinical behaviour and aetiological differences. This malignancy has shown higher incidence in Southeast Asia (annual incidence rate [AIR] of 6.4/100,000 in males and 2.4/100,000 in females). In India, its geographic distribution is heterogeneous, with higher incidence in Northeastern states (AIR of 19.4/100,000 population) [1]. Data from our hospital registry from South India revealed a lower prevalence of this condition in comparison to other head and neck malignancies
Currently, as per World Health Organisation pathological classification, these malignancies are categorized into keratinising squamous cell carcinoma and non-keratinising carcinoma variants [2]. However, there is no clear demonstration of clinical improvement when a specific histological subtype is considered as a prognostic predictor. Although outcomes in terms of local control have significantly improved using treatment protocols like chemo radiation as well as newer radiotherapy treatment techniques such as intensity-modulated radiotherapy (IMRT) [3], distant failure rates continue to be dismal in the locally advanced subset [4, 5]. Hence, various other prognostic factors such as Ebstein-Barr virus-related biomarkers are being hypothesised and evaluated [6, 7]. However, there is still a growing need to analyse other indices to quantify prognosis.
Fluor-18-fluorodeoxyglucose positron emission tomography with computed tomography (18F-FDG-PET-CT) has been used as the preferred imaging modality for staging nasopharyngeal cancer patients [8]. Apart from its use as a staging modality, the use of the same as a prognostic marker has been explored in a few studies [9, 10]. The standard uptake value maximum (SUVmax) for primary tumour and nodal disease has been explored as a potential prognostic biomarker for nasopharyngeal cancers; however, a uniform consensus on the same is still lacking [11, 12]. The drawback of SUVmax is that it represents the areas of active uptake within the tumour but does not provide an estimate of the entire tumour volume; hence, other metabolic parameters such as metabolic tumour volume (MTV) are also being studied to overcome the above-mentioned limitations [13, 14].
In this study, we have calculated the value of MTV, and SUVmax of primary tumour (SUVmax-P) and nodal disease (SUVmax-N) in pre-treatment PET-CT of patients with non-metastatic nasopharyngeal cancer treated with chemoradiation and correlation were drawn in terms of treatment response, overall survival (OS) and progression-free survival (PFS). Thereby we evaluated the role of these PET-CT metabolic parameters as a prognostic tool in non-metastatic nasopharyngeal cancer.
Material and methods
Patient population: We retrospectively analysed image datasets and follow-up data of NPC patients who presented at our institute between January 2017 and January 2020. Informed consent was obtained from each patient prior to radiotherapy and chemotherapy on the use of their data and image data for subsequent research.
Eligible patients were those with biopsy-proven nasopharyngeal carcinoma, including those who had received concurrent chemoradiation with IMRT followed by adjuvant chemotherapy. Pre-therapy evaluation included those who had been evaluated with 18F-FDG-PET-CT as part of the staging and metastatic workup and had subsequently been staged in accordance with 8th edition of the American Joint Committee on Cancer Staging Manual (2016). Patients with a Karnofsky index value below 70% and a prior history of other malignancies were excluded from the study.
18F-FDG-PET-CT parameters: the patients were administered an intravenous injection of 18F-FDG-PET-CT at a dose of 0.22 mCi (8.14 MBq)/kg (10–15 mCi/370-555 MBq) FDG. Forty-five minutes after the injection, patients were imaged from vertex to knee level with a 120 kV, 50 mA CT scan with a slice thickness of 3 mm using a Siemens Biograph Horizon device.
Treatment details: For radiotherapy planning, the patients were simulated in the supine position and immobilised with a thermoplastic mould. A CT simulation was performed with a slice thickness of 3 mm extending from the vertex to the D8 spine using a Siemens Biograph Horizon. The contouring was done with PET fusion-based delineation as per the international guidelines by Lee et al. [15]. Radiotherapy was administered to a total dose of 66 Gy to the GTV, 60 Gy to the high-risk clinical target volumes, and to a dose of 54 Gy in elective nodal regions in 1.8–2 Gy daily fractionation. With regard to chemotherapy, the patients were administered cisplatin (CDDP) 40 mg/m2 weekly concurrent with radiation and adjuvant chemotherapy using CDDP (70 mg/m2) and 5FU (1000 mg/m2 D1-5) 3-weekly following concurrent chemoradiation.
Follow-up: All patients were reviewed weekly during RT to assess the acute reactions, and post-therapy assessment with PET-CT was performed at 3 months post-RT after completion of adjuvant chemotherapy. Response assessment was performed in accordance with PERCIST criteria.
18F-FDG-PET-CT Metabolic Parameters: The SUV values were obtained using attenuation-corrected images, patient body weight, amount of FDG injected, and cross-calibration factors between the dose calibrator and FDG-PET CT.
The MTV of the primary tumour was calculated and derived automatically under a fixed threshold of the SUV at 2.5. The contouring margin contained the entire primary MTV2.5, where the MTV was a quantitative measurement of 18F-FDG uptake within the tumour lesions and volume of interest.
Study design and statistical analysis: To evaluate the role of MTV and SUVmax of the primary and node and its significance in terms of treatment outcomes: OS and PFS. The software used for statistical analysis was SPSS version 11, the survival fractions were estimated using the Kaplan-Meier method, and its correlation with treatment response and prognostic factors were analysed using the log-rank test. Statistical significance was set at p < 0.05. Chi-square and Fisher’s exact test were used to compare characteristics between the 2 groups SUVmax-P and SUVmax-N.
Results
Patient characteristics
The patient characteristics are shown in Table 1, and a total of 20 patients were analysed in this study, of whom 17 were alive at the last follow-up. The median follow-up period was 34.7 months (range, 20–48 months). The common histological variant was non-keratinising carcinoma, comprising of 85%, with most patients presenting in the locally advanced stages (III and IVA). The median nodal size measured on the short axis was 20 mm (range, 8–42 mm).
Table 1
Patient characteristics
Maximum standard uptake cut-off value
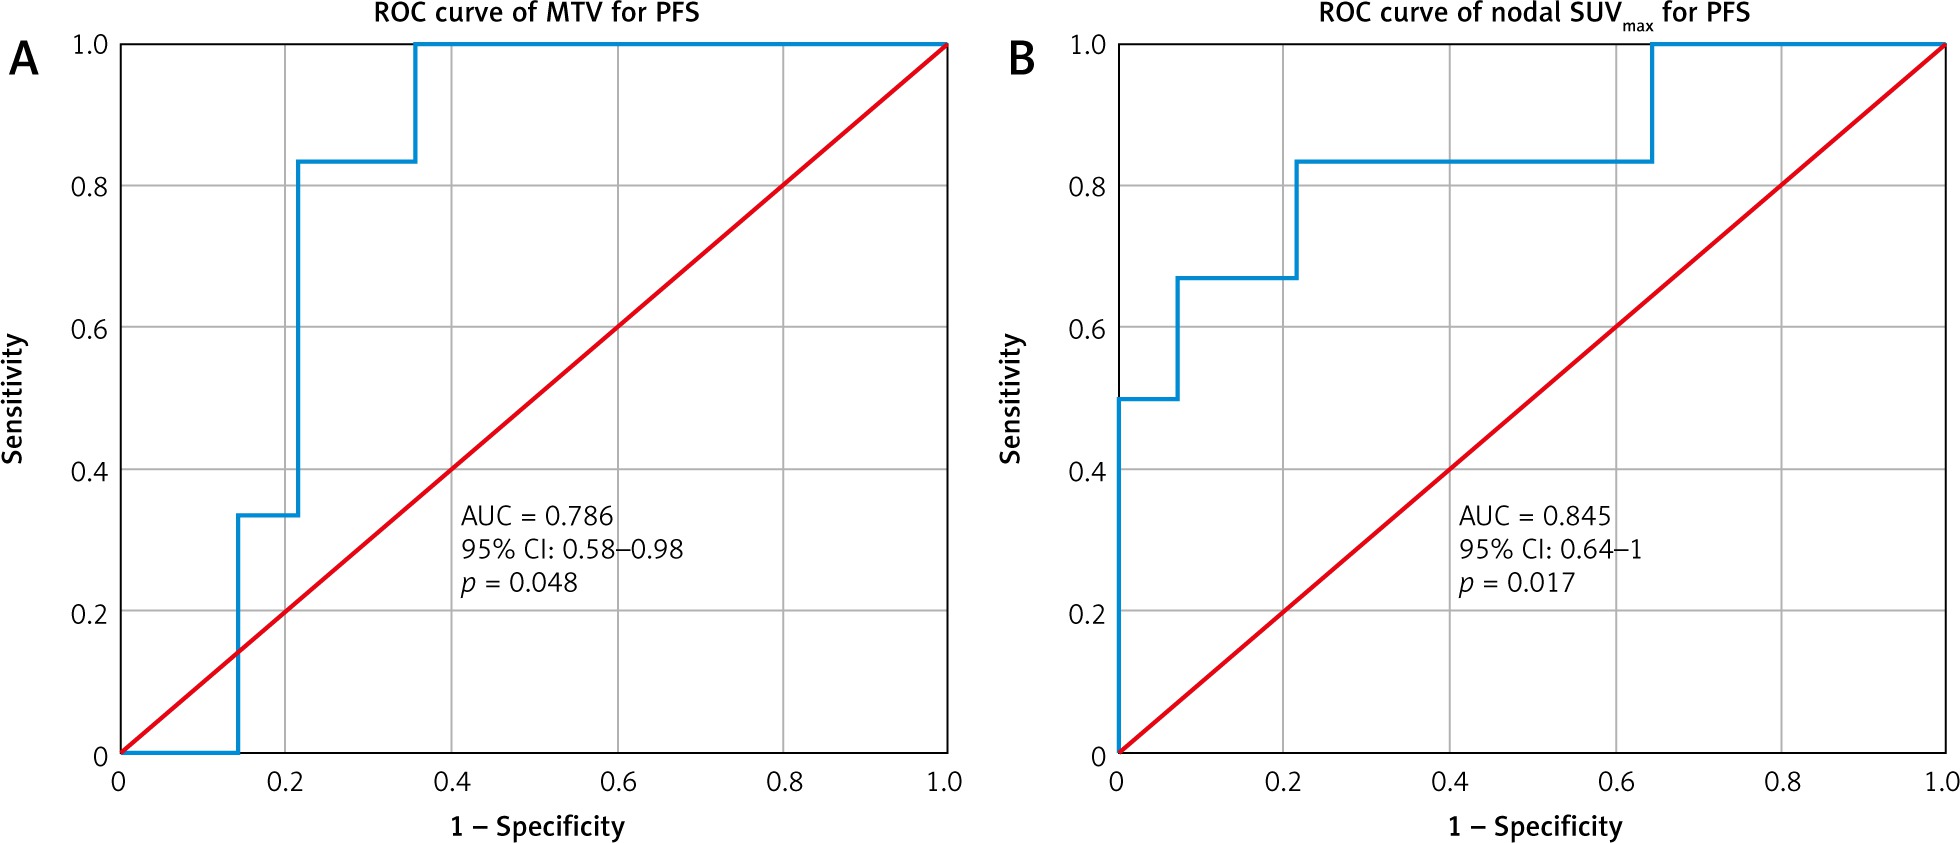
Based on pre-therapy PET-CT, the mean SUVmax-P was 13.55, (range, 8.75 to 26.17) and the mean value of SUVmax-N was 10.20, (range, 2.27 to 20.49). The reference cut-off value for SUVmax-N was obtained by receiver operating characteristics (ROC) curve analysis for progression for a value of 10.58 (area under curve – AUC, 0.845; p = 0.017). In terms of MTV, the mean value was 22.04 cm3 (range, 8.53–56.92) and the reference cut-off value was 25.8 cm3 (AUC, 0.786; p = 0.048) by ROC curve analysis for progression as shown in Figure 1.
Fig. 1
Receiver operating characteristics curve for metabolic tumour volume and nodal maximum standard uptake value for predicting progression
Based on the cut-off values for SUVmax at primary and node and MTV calculated using the ROC method, the distribution of these values with respect to disease stage and pathological variants in our study is depicted in Table 2.
Table 2
Characteristics mapped to maximum standard uptake values
Prognostic significance of maximum standard uptake value and metabolic tumour volume treatment outcomes
In terms of treatment outcomes, patients were evaluated with post-therapy PET-CT at 3 months post-radiotherapy. Among the 20 patients analysed, 14 (70%) had complete metabolic response, 2 (10%) were partial responders, and the remaining 4 (20%) had progressive disease.
When stratified and compared against the average SUVmax-P, there were no significant differences in response rates (p = 1.0). However, in terms of SUVmax-N, there was a significant difference of 91.7% versus 37.5% in terms of complete response rates for patients with SUVmax-N < 10.58, showing significantly better response rates (p = 0.05). In terms of histological variants, the poorly differentiated variant had a poorer outcome, as shown in Table 3 (statistically insignificant). The MTV cut-off value of 25.8 cm3 was also statistically significant in terms of complete responders (91.7% vs. 37.5% p = 0.018).
Table 3
Treatment outcomes
During the follow-up period, 2 patients who had partial response developed progressive disease (6 out of n = 20, 30%) of whom 4 patients had succumbed to the disease, 1 patient had distant progression, and 1 had local progression, and they were salvaged with second-line chemotherapy. Among the above-mentioned patients who had progressed, 5 had an SUVmax-N of > 10.58 and an MTV of > 25.8 cm3. The sensitivity and specificity regarding the use of these metabolic markers for prognostic significance is shown in Table 4.
Survival outcomes
The 2-year PFS and OS for all patients were 70% and 79%, respectively. In univariate analysis, high SUVmax-P > 13.55 did not show any significant difference in terms of OS and PFS (p = 0.582).
However, a higher SUVmax-N level > 10.58 was a negative prognostic factor. The 2-year PFS was (91% vs. 46%; p = 0.035) and the 2-year OS was (95% vs. 58%; p = 0.015) for the SUVmax-N < 10.58 and SUVmax-N > 10.58, respectively, which was statistically significant (Table 5). When the SUVmax-N was stratified by stage or across histologies, there was no difference in PFS or OS (p = 0.715). A high SUVmax-N of > 10.58 was a negative predictor of OS (95% confidence interval [CI]: 0.93–1; p = 0.003) as well as PFS (95% CI: 0.64–1; p = 0.017), as shown in Figure 2.
Table 5
Survival outcomes for nodal maximum standard uptake value and metabolic tumour volume
| Prognostic parameters | SUVmax-N ≤ 10.58 | SUVmax-N > 10.58 | p-value |
|---|---|---|---|
| 2-year PFS | 91% | 46% | 0.035 |
| 2-year OS | 95% | 58% | 0.015 |
| Prognostic parameters | MTV ≤ 25.8 | MTV > 25.8 | p-value |
| 2-year PFS | 90% | 38% | 0.006 |
| 2-year OS | 99% | 55% | 0.008 |
Fig. 2
Receiver operating characteristics curve for metabolic tumour volume and nodal maximum standard uptake value for predicting survival
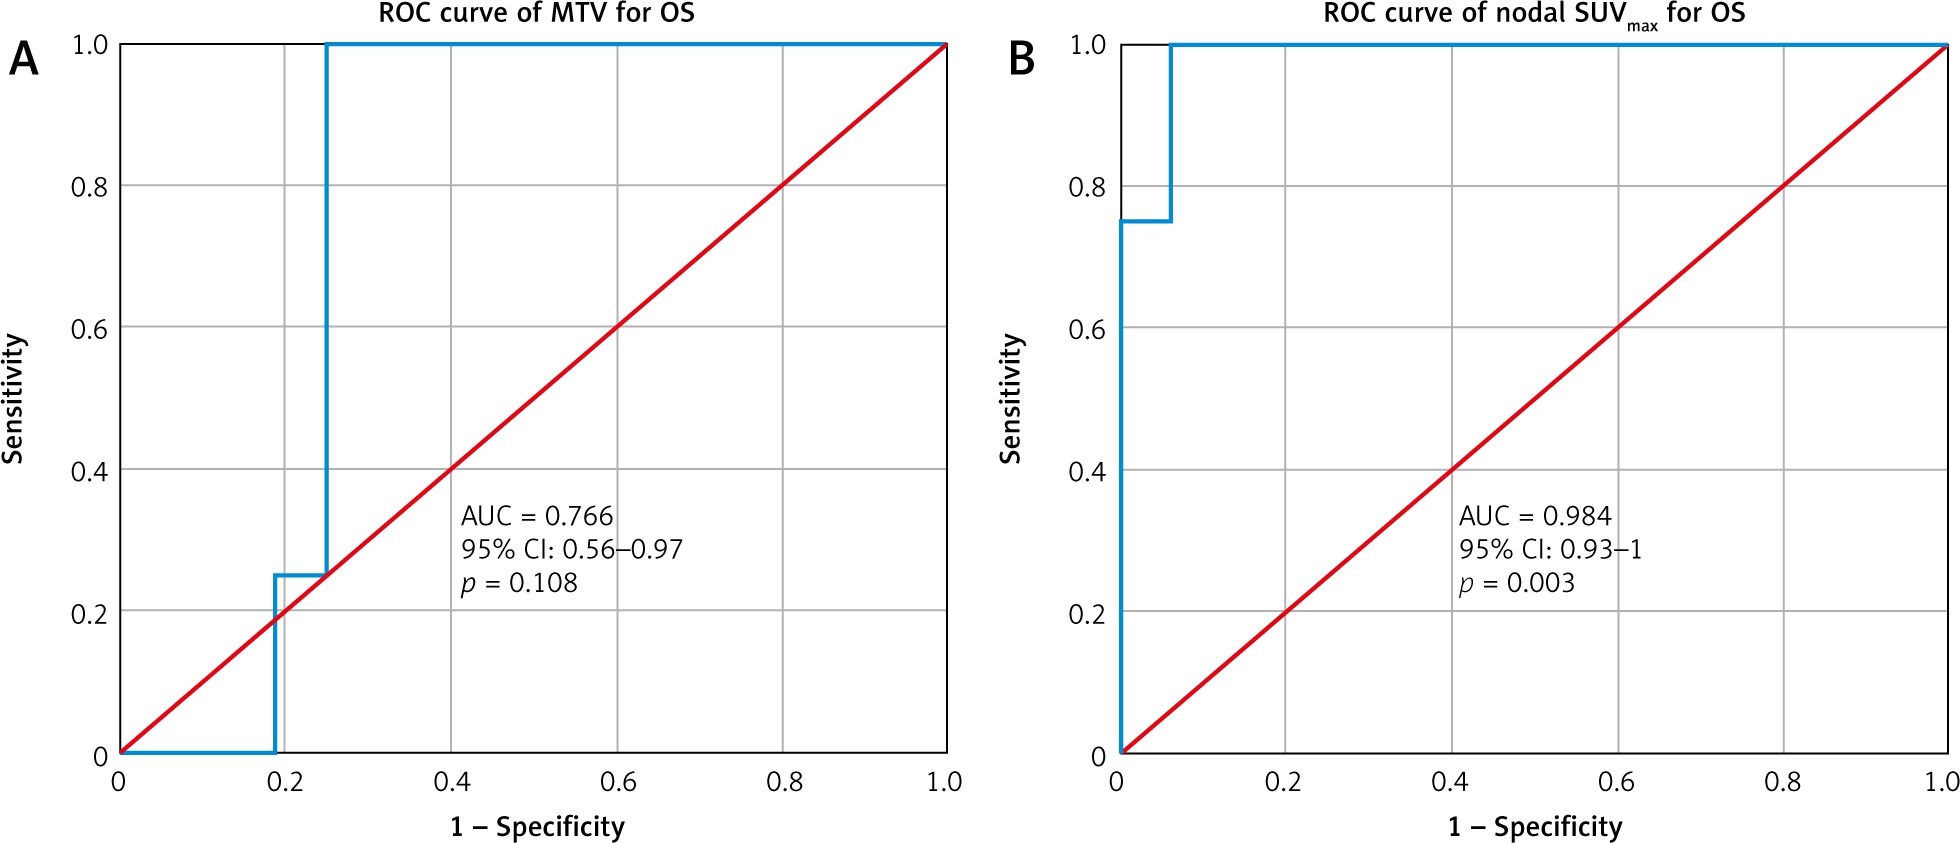
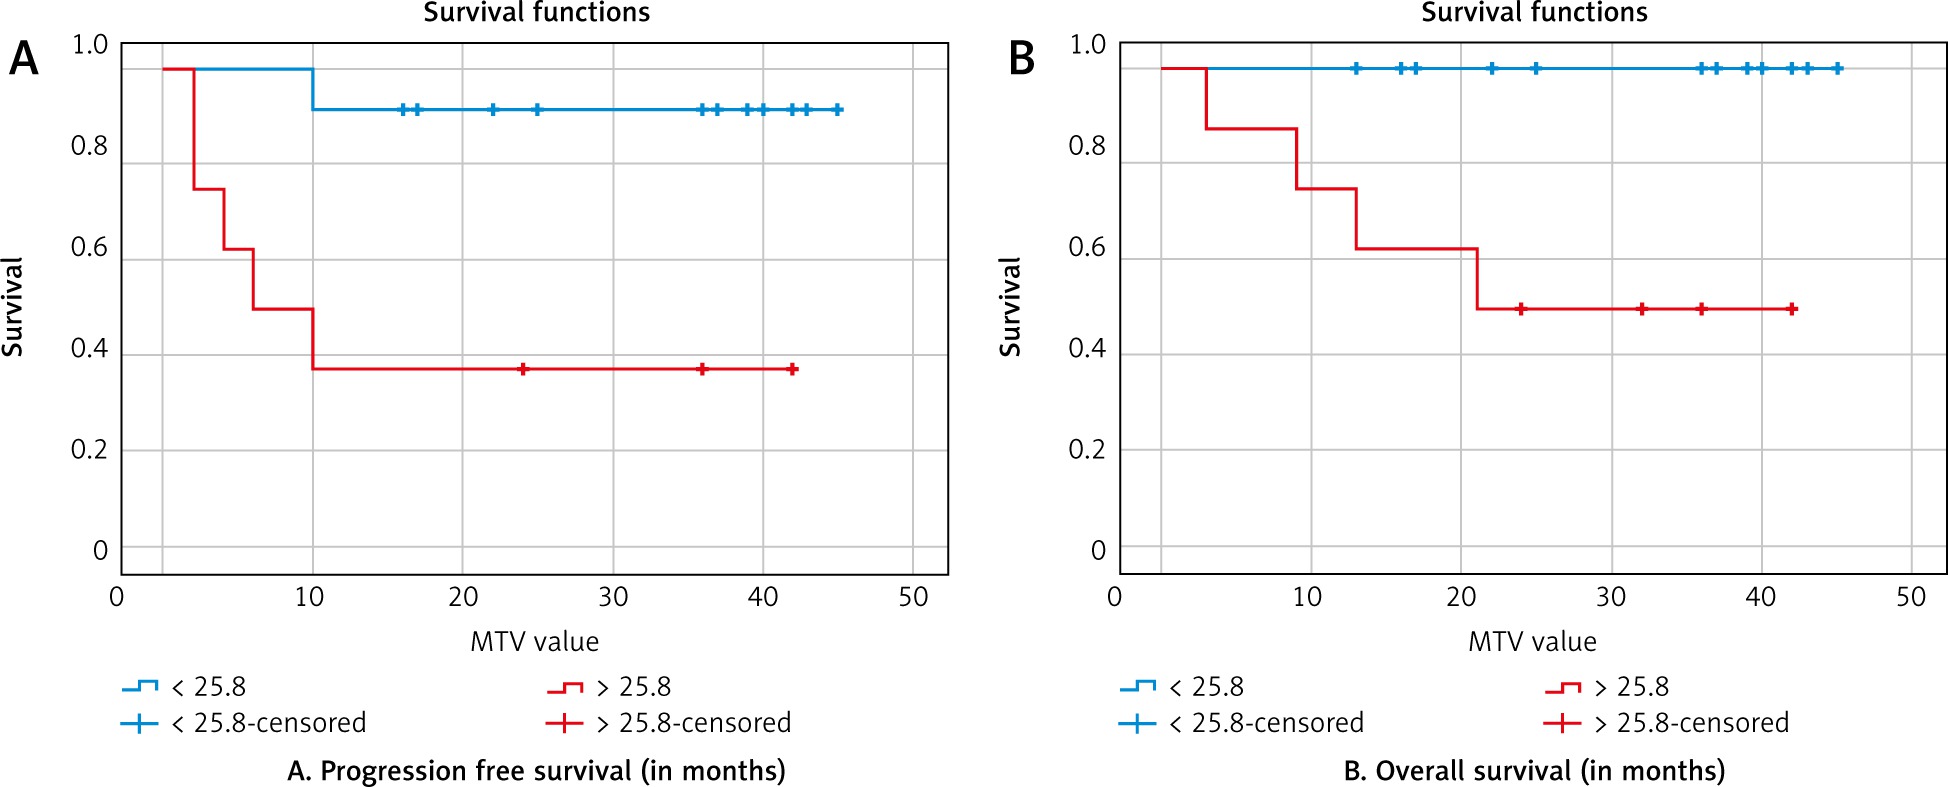
In terms of MTV, the 2-year PFS was (90% vs. 38%; p = 0.006) and 2-year OS was (99% vs. 55%; p = 0.008) for the cut-off values of MTV ≤ 25.8 cm3 and MTV > 25.8 cm3, respectively. A high MTV of > 25.8 was also a negative predictor of OS (95% CI: 0.56–0.97; p = 0.108) as well as PFS (95% CI: 0.58–0.98; p = 0.048). The Kaplan-Meier curves for PFS and OS are shown in Figures 3 and 4.
Fig. 3
A – Kaplan-Meier curves for progression-free survival, B – overall survival (nodal maximum standard uptake value)
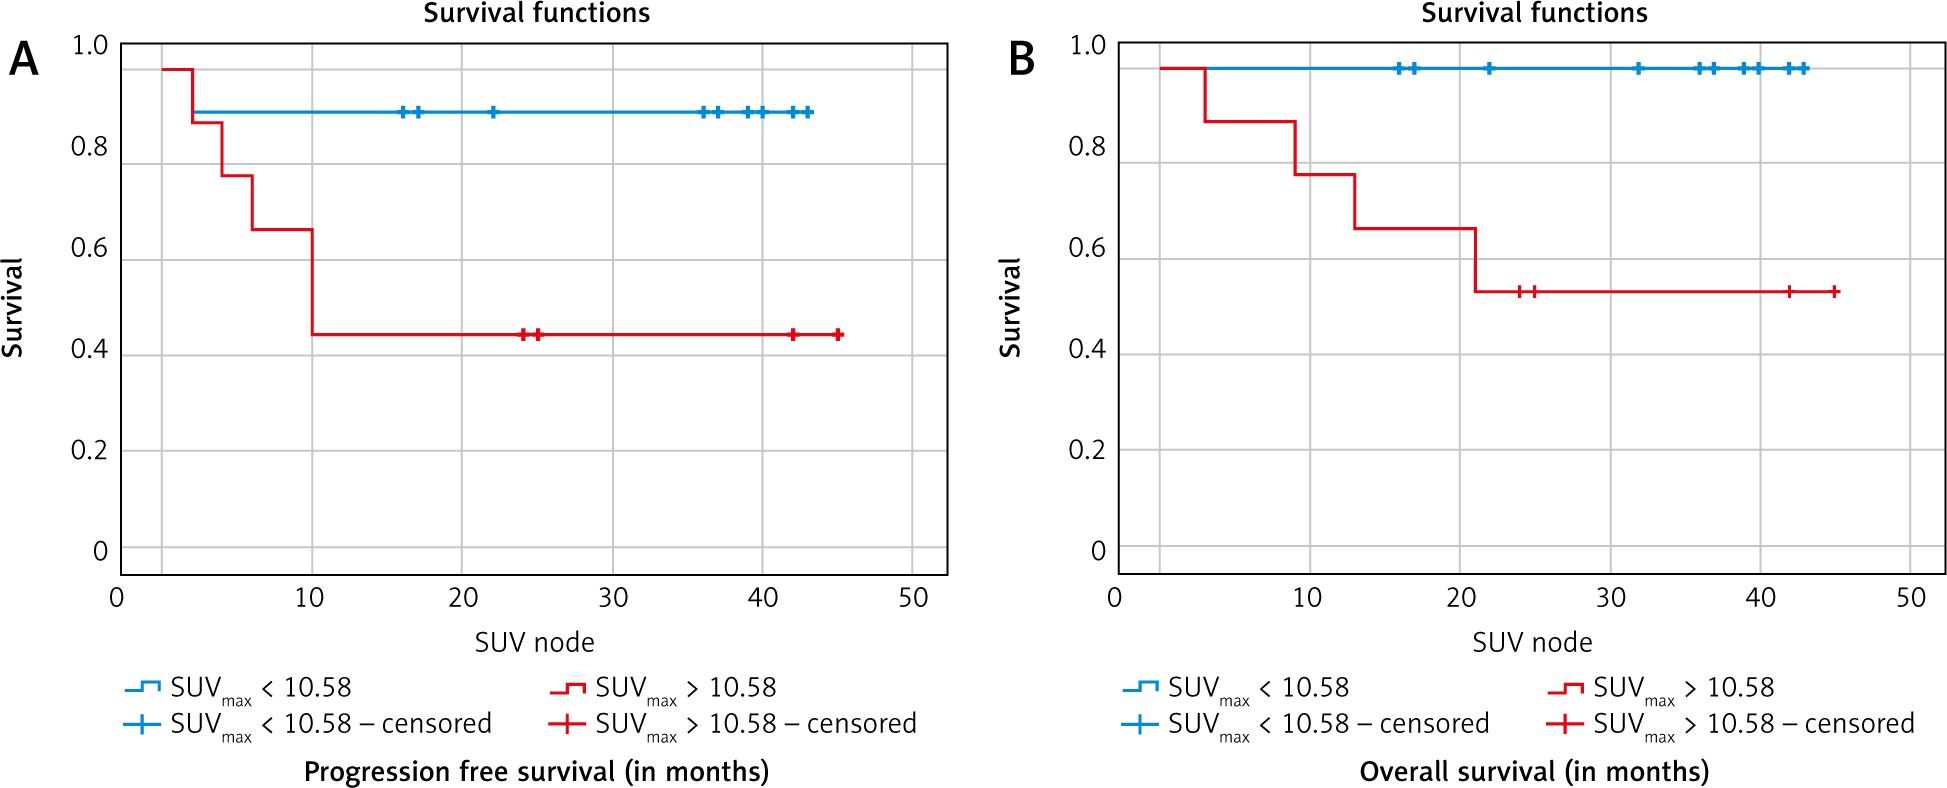
Fig. 4
A – Kaplan-Meier curves for progression-free survival, B – overall survival (metabolic tumour volume)
Hence, SUVmax-N and MTV are significant independent predictors of PFS and OS in univariate analysis, whereas it was not significant in the Cox regression multivariate analysis.
Discussion
Although NPC is sensitive to chemoradiation, the OS rates for locally advanced cancers is around 71.3% with dismal distant failures rates. Hence, there is a need to identify factors that may predict prognostic outcomes, thereby leading to intensification of treatment for the poor prognostic subset. Among the prognostic factors in vogue are stage grouping, histological subgrouping, and assessment of tumour tissue microarrays [16, 17]. The main drawbacks of the previously mentioned factors are the lack of genetic expression of the entire tumour. Hence, identifying additional prognostic factors that can predict treatment outcomes, particularly non-invasive diagnostic methods, may enhance the development of individualised strategies, thereby improving treatment outcomes. PET-CT is a modality that is non-invasive and can obtain the entire tumour metabolic information.
18F-FDG-PET-CT is the gold standard imaging modality for staging and assessing treatment response in nasopharyngeal cancers. In addition to its use for staging workup, its metabolic parameters are being explored as prognostic markers that may dictate the treatment response as well as a marker to determine long-term survival outcomes. SUVmax is one such marker that has been evaluated in the reviewed literature. SUV is defined as the ratio of the radioactivity concentration measured in the tissue to body weight in kilograms. SUVmax is a convenient parameter that is commonly used in clinical practice. It represents the highest voxel value within the volume of interest; however, it does not reveal heterogeneity within the tumour volume. Hence, other parameters, such as MTV, have been explored to offset this issue. In our study, we analysed the value of SUVmax-P, SUVmax-N, and MTV as significant prognostic markers.
In terms of SUVmax-P, Xie et al. found the best cut-off value to be 8.0 for the SUVmax of primary although in multivariate analysis it was not statistically significant in terms of 5-year OS and 5-year PFS benefit [18]. Lee et al. also deemed a cut-off value of 8 to be optimum for prognosis prediction [19]. In contrast, in this study, the SUVmax-P cut-off of 13.55 did not have any major bearing on the response rates or long-term survival outcomes, but the SUVmax-N had a bearing on the outcomes. In an earlier retrospective study on locally advanced head and neck cancer patients from India Srinivas et al. [20] failed to identify a cut-off value for pretherapy SUVmax that could predict the probable outcome of therapy.
In continuation of the above data obtained in this study in terms of SUVmax-N, it should be noted that lymph node metastasis has long been an important independent prognostic factor for nasopharyngeal cancer patients. Various parameters for quantifying the prognostic value of lymph node status, such as MTV and SUV, have been studied by many investigators, although with conflicting data. Yecai et al. reported that SUVmax, MTV of metastatic nodes did not have a bearing as an independent prognostic factor [21]. However, in a study by Hung et al. SUVmax-N was deemed an independent prognostic factor, with distant metastasis-free survival of 79.9% [22, 23]. Similarly, Lee et al. in their study also confirmed that the SUVmax-N was a more sensitive marker with a higher pre-treatment value > 13.4, which was a negative prognostic factor in terms of survival and disease progression (93.1% vs. 55.5% for OS and 92.7% vs. 38.5% for PFS) [24]. The data from this study are also in agreement with a PFS of 91% vs. 46% (p = 0.035) and an OS of 95% vs. 58% (p = 0.015), which was statistically significant in our study.
Regarding MTV, the follow-up data of 20 patients in the present study showed that for a definite SUV threshold, the most distinct MTV cut-off value had prognostic merit. This suggests that the 2-year PFS rate was inversely related to the MTV cut-off value of 25.8 cm3 for an SUV threshold of 2.5, with the PFS being 91% vs. 46% (p = 0.048). Fei et al. also confirmed MTV as an independent prognostic factor for predicting treatment and survival outcomes in patients and deemed MTV at an SUV threshold of 4 as an ideal sub-volume to be chosen for best therapeutic effect [25]. Similarly, Chan et al. further highlighted the role of MTV as an independent risk factor in patients with metastatic NPC [14].
Thus, it may be reasonable to use MTV as a biological target volume for the sub-set of patients with higher MTV value. The functional information provided by the MTV and its application as a biological target volume and dose escalation volume in radiation planning may improve the therapeutic efficacy for patients with NPC, who receive concurrent chemoradiation. The threshold by which the MTV can be considered the biological target volume needs to be explored in future studies. The MTV, as measured by PET-CT, tends to be smaller than the gross tumour volume defined by MRI or CT [26, 27]. Hence, the benefit regarding the use of dose escalation to a subregion within the GTV for a particular threshold of MTV and its effect on treatment or survival outcomes needs to be analysed exhaustively. This is beyond the scope of the present study and should be prospectively analysed in future studies.
A major limitation of our study was the retrospective nature and the limited sample size owing to the relatively low incidence of nasopharyngeal cancers in the southern districts of India. A well-designed prospective study is needed to validate the results of this study. Nevertheless, our report is still worthwhile because we have compared various metabolic parameters and conclusions were drawn with regard to MTV and SUVmax-N, which has been shown to be a superior prognostic marker to SUVmax-P.


