Purpose
Recently, relevant literature on radiation oncology suggested that there was no alternative treatment to electron beam therapy [1]. We have recently witnessed a rapid growth and development of different treatment modalities and techniques in radiation therapy, with the purpose of improving the quality of cancer treatments. When treating shallow tumors, radiation beams that pass through the entire patient are not favorable. The electron external beam radiation therapy (EBRT) was proven to be suitable for shallow tumors at a certain depth (rarely deeper than a cm). The principal applications of EBRT are: a) treatment of skin and lip cancers, b) chest wall irradiation for breast cancer, c) administering a boost dose to lymph nodes, and d) treatments of the head and neck [2]. Dose distributions and dose characterizations in EBRT are well documented [2-5]. Percent depth doses for various electron beams [4] show that a certain dose level can be deposited into deeper-seated tissue due to electron penetration, generation of secondary electrons, and photon contamination. This characteristic of electron beams is not desirable in cases where radiation dose needs to be deposited at a very shallow depth under the skin surface, e.g., less than 5 mm. In such cases, surface brachytherapy can be good or even better treatment modality for skin treatments [6].
Aside from EBRT, two additional advanced radiation therapy treatment techniques for malignant and non-malignant diseases of the skin include high-dose-rate brachytherapy (HDR-BT) and electronic brachytherapy [6, 7]. Adapted for a specific disease and topography, these brachytherapy techniques are used for effective, accurate, and safe delivery of radiation. Moreover, the complexity of clinical target volumes (CTVs), e.g., curvy, rounded, or targets with complicated topology, is in a direct relationship with the adequate choice of treatment modality used in skin treatments. The prescription dose for some cutaneous diseases (cutaneous T cell and B cell lymphoma, Merkel cell carcinoma, basal cell carcinoma, squamous cell carcinoma, rare adnexal neoplasms: eccrine, apocrine, sebaceous, and hair follicle tumors, and other rare cutaneous cancers) has to be delivered at shallow depths; thus, superficial HDR-BT is an alternative to EBRT.
As noted, requirements for dose distributions in skin treatments are related to desirable dose depositions at certain depths with organs at risk (OARs) sparing beyond that depth. A primary characteristic of HDR-BT is the rapid and sharp dose fall-off, with the possibility to spare critical organs near treated regions or clinical targets. Clinicians often need to choose between EBRT and HDR-BT for the treatments of skin targets. Clinical decisions are usually made based on previous experience and availability of resources. However, critical decision-making conditions that need to be considered are treatment site geometry, position, size, and topography of the target. These components are directly related to favorable dose distributions in both EBRT and HDR-BT. When the skin ought to be treated, various target geometries require proper adaptation of the flap (or custom-made) applicators or the electron field to this treatment site. Consequently, the dose at depth on central axis (CAX) and field edges changes with the variation of curvatures and the size of applicators.
The purpose of this study was to investigate the influence of such parameters on the quality of treatment plans generated under the same conditions (identical computed tomography (CT) images and the same patients), using EBRT and HDR-BT for skin treatments. EBRT and HDR-BT treatment plans were compared to identify which treatment modality resulted in more favorable dosimetry. Target coverage and dose distributions were evaluated under various clinical scenarios, such as large targets, small targets, curvy surfaces, rounded surfaces, and the like. All generated HDR-BT treatment plans were clinically delivered; however, it was investigated whether EBRT resulted in improved radiation dose distributions in various cases. Additional purpose of this study was to generate robust quantitative criteria that could result in a set of straightforward recommendations for either treatment modality prior to delivery. These decision criteria were based on the knowledge of geometry of clinical targets, including size, anatomic curvatures, and topography that could be obtained by visual inspection of the target or evaluation of the clinical images, such as CT. As a result, OARs’ doses could be predicted based on the presented charts; thus, either EBRT or HDR-BT could be recommended based on particular circumstances.
Material and methods
The first part of this study included generation, evaluation, and data analysis of EBRT and HDR-BT treatment plans using CT images for 37 treatment sites to aid in developing a relevant conclusion regarding treatment modalities. The second part of this study involved characterizing the dose distributions of HDR-BT in skin. The goal was to generate a predictive dose distribution model of various CTV shapes and sizes. These dose distribution models were designed to be a counterpart to the well-known electron dose distribution parameters, such as Rp, R50, and depths of 80% and 90% isodose lines, respectively.
Patients and clinical targets
The study was performed with a cohort of 37 patients who had been diagnosed with cutaneous T cell or B cell lymphoma or angiosarcoma, and had been treated within a five-month period. The targets were present on the preauricular cheek (2), thighs (6), abdominal wall (4), forearm (6), flank and hip (8), scalp (6), and the whole face (5). The size of CTV varied from 4 × 6 cm2 to 23 × 40 cm2. The treatment sites, target sizes, and depths are presented in Table 1. One of the most relevant factors for dose distribution evaluation was the target curvature. For this study, the curvature was defined as the distance along CAX (CAX distance) from the peripheral margin to the plane perpendicular to the point of incidence (vertex) of CAX. The topology of targets varied from almost flat to parabolic, with a minimum and maximum CAX distance of 4.7 mm and 70 mm, respectively. Additionally, characteristics of the clinical targets summarized in Table 1 showed wide variations in size, geometry, and topology. These variations were crucial for the EBRT and HDR-BT plans comparisons.
Table 1
Treatment sites, applicator/CTVs size, and CAX distance of CTVs for all patients
Treatment planning
First, the EBRT and HDR-BT plans were generated. The HDR-BT plans were used for patient treatments, while the EBRT plans were used for comparisons only. All patients underwent a simulation using CT prior to planning, so the EBRT and HDR-BT treatment plans were generated on identical CT images. Specific details on treatment planning for both techniques are presented later in this section. To analyze the data obtained from dosimetric plans, we compared dosimetric parameters including the coverage of CTV (D100, D95, D90, D50), maximum plan doses (D2 cm3, D0.5 cm3, D0.1 cm3), surface doses, and irradiated volumes. The CTVs for HDR-BT plans were created by adding margins to visible gross tumor volumes. These margins were in the range of 2-5 cm. The EBRT plans were generated by adding an additional margin to encompass possible patient movement and setup uncertainties.
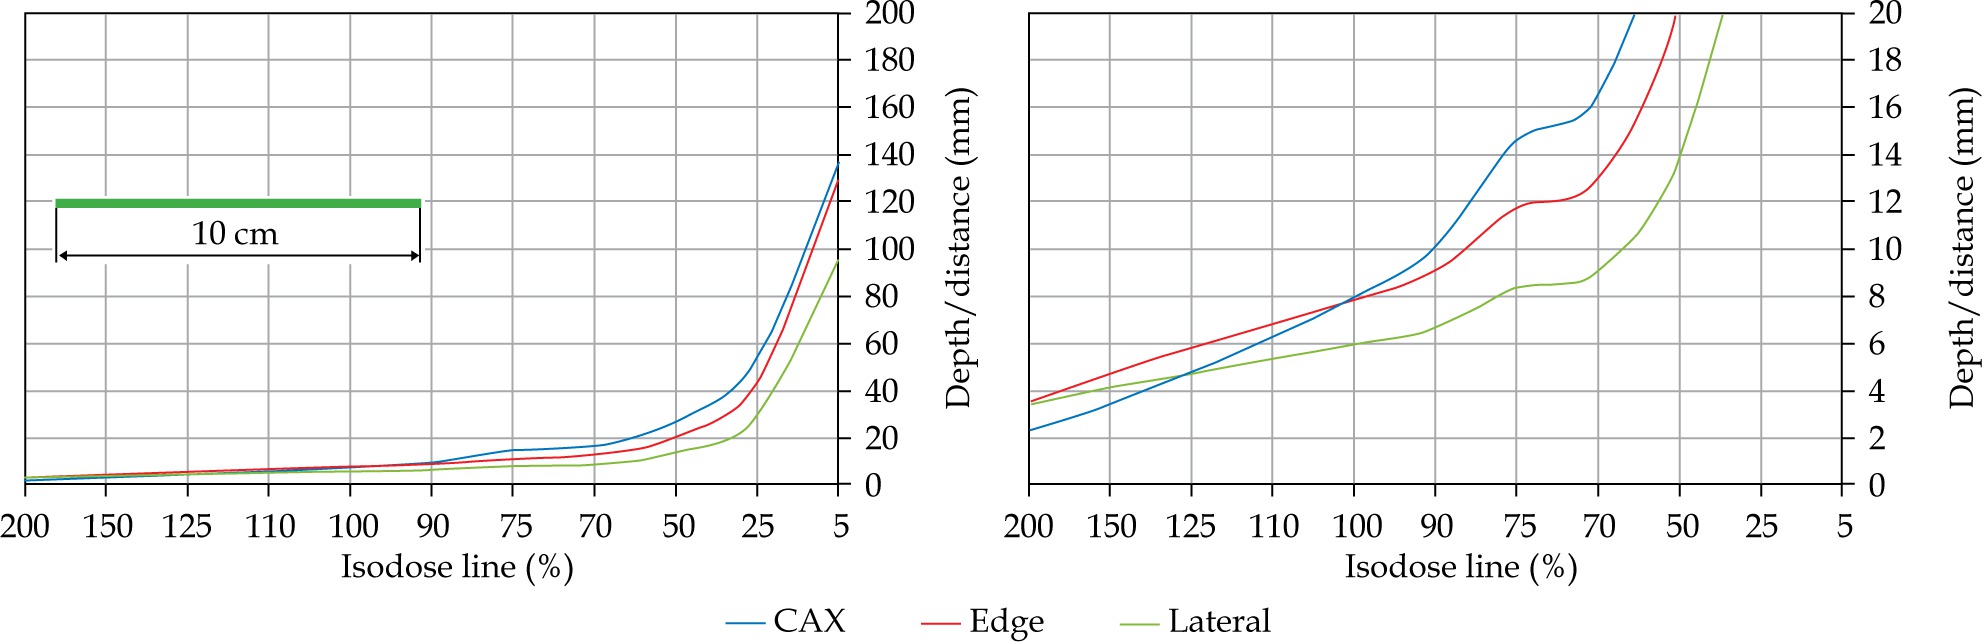
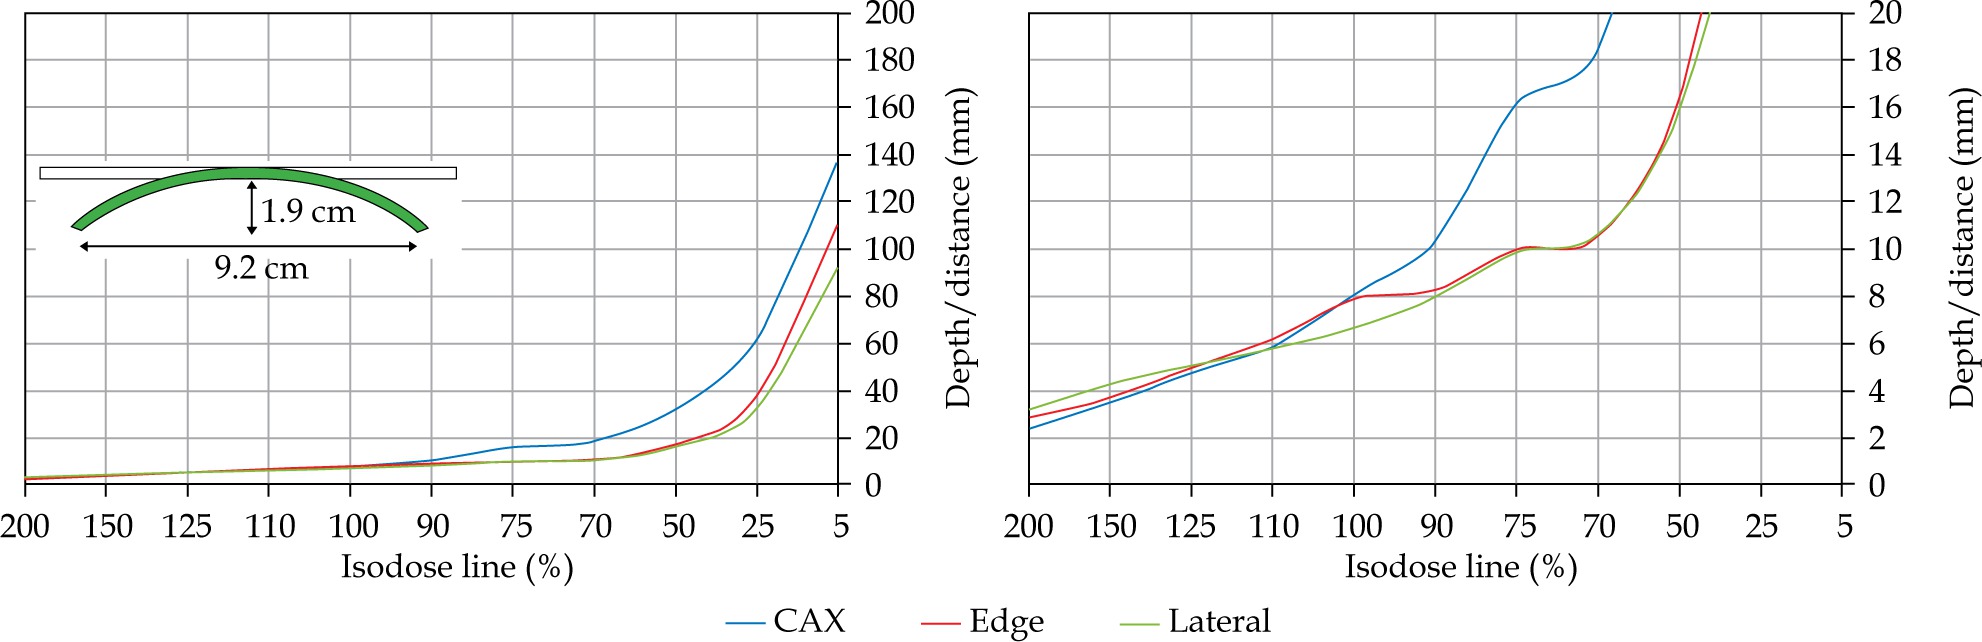
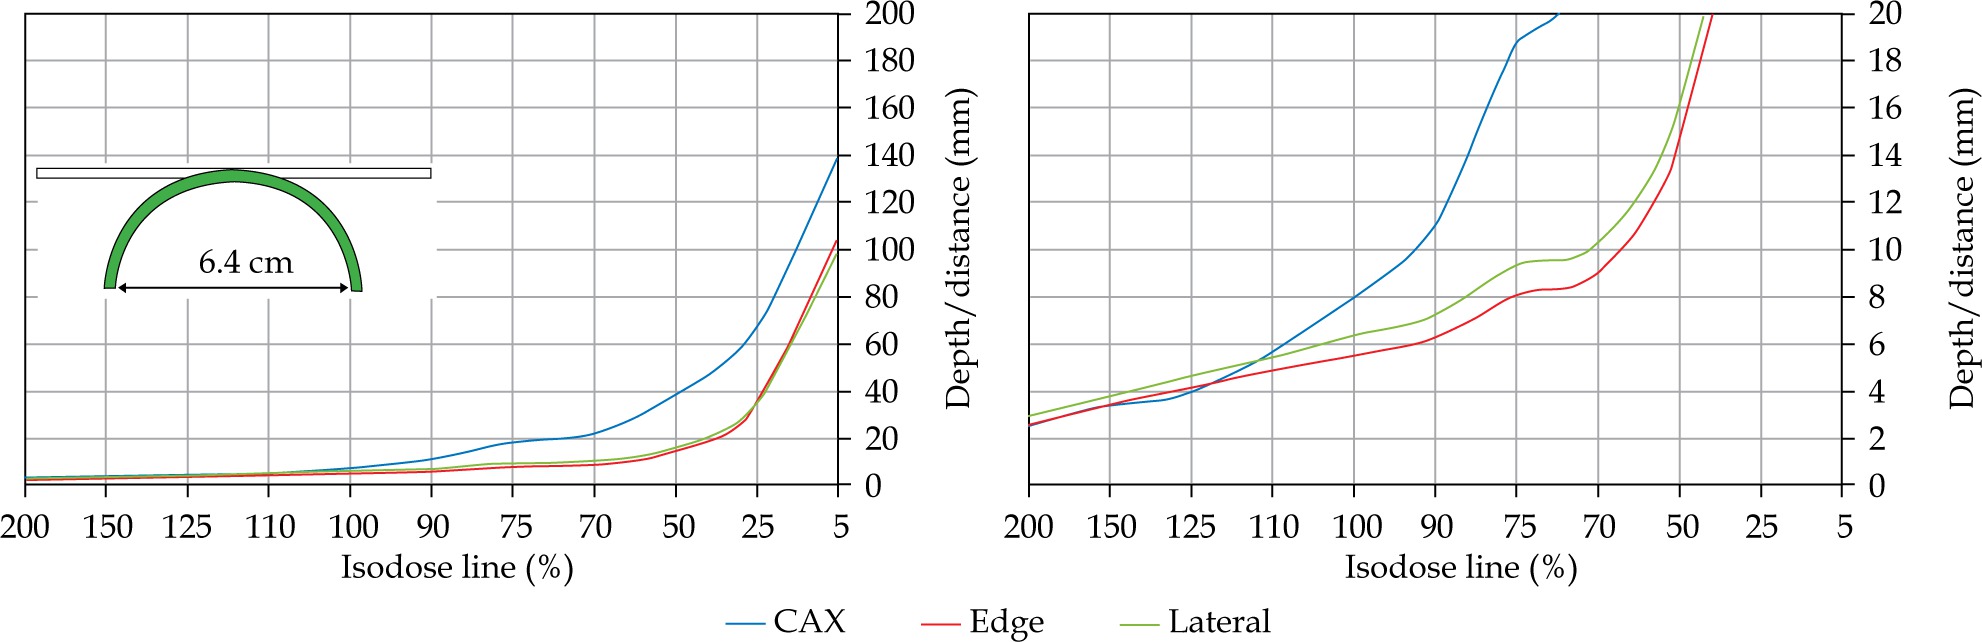
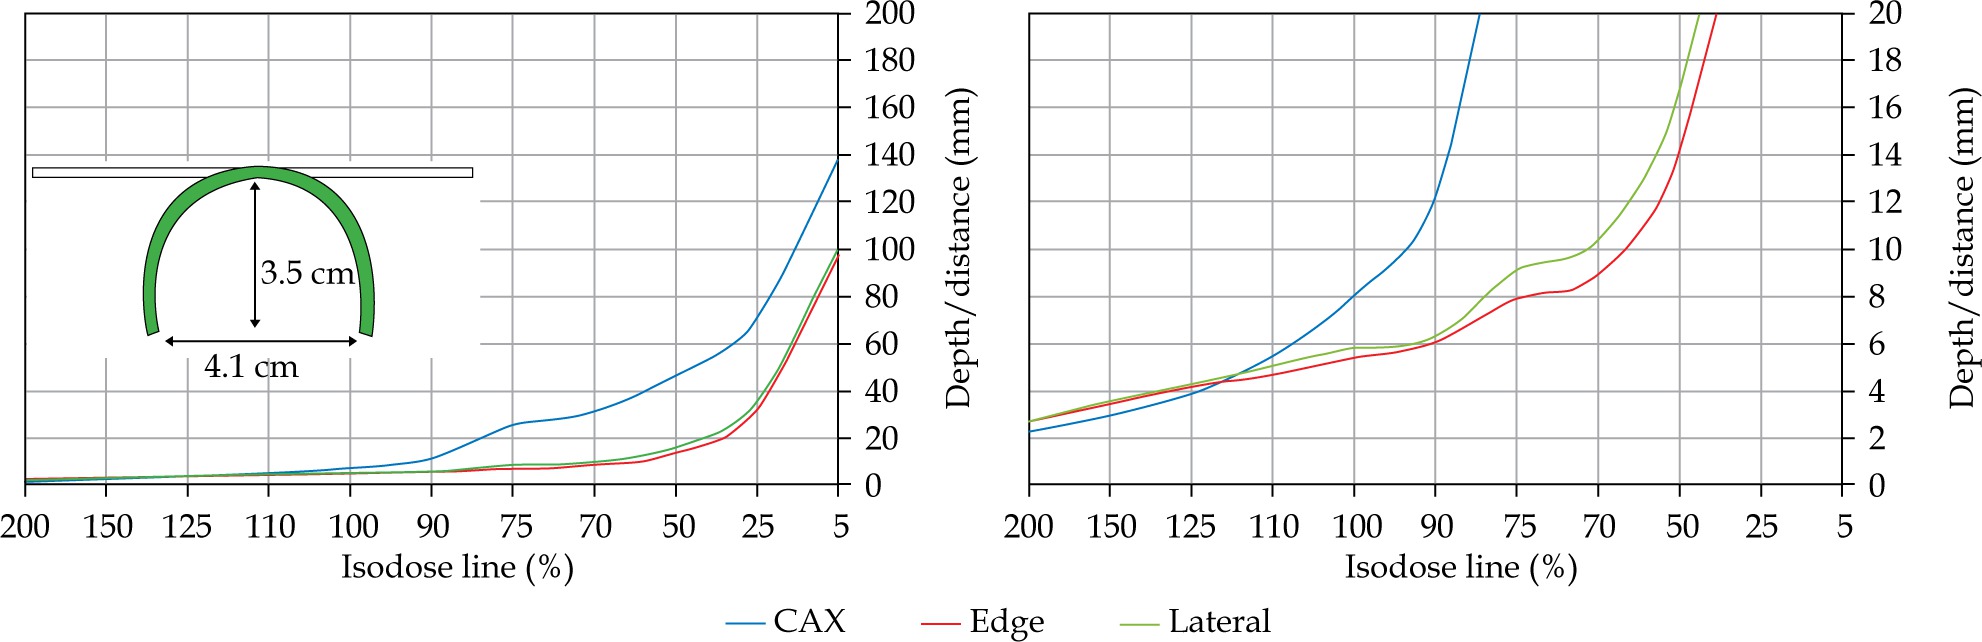
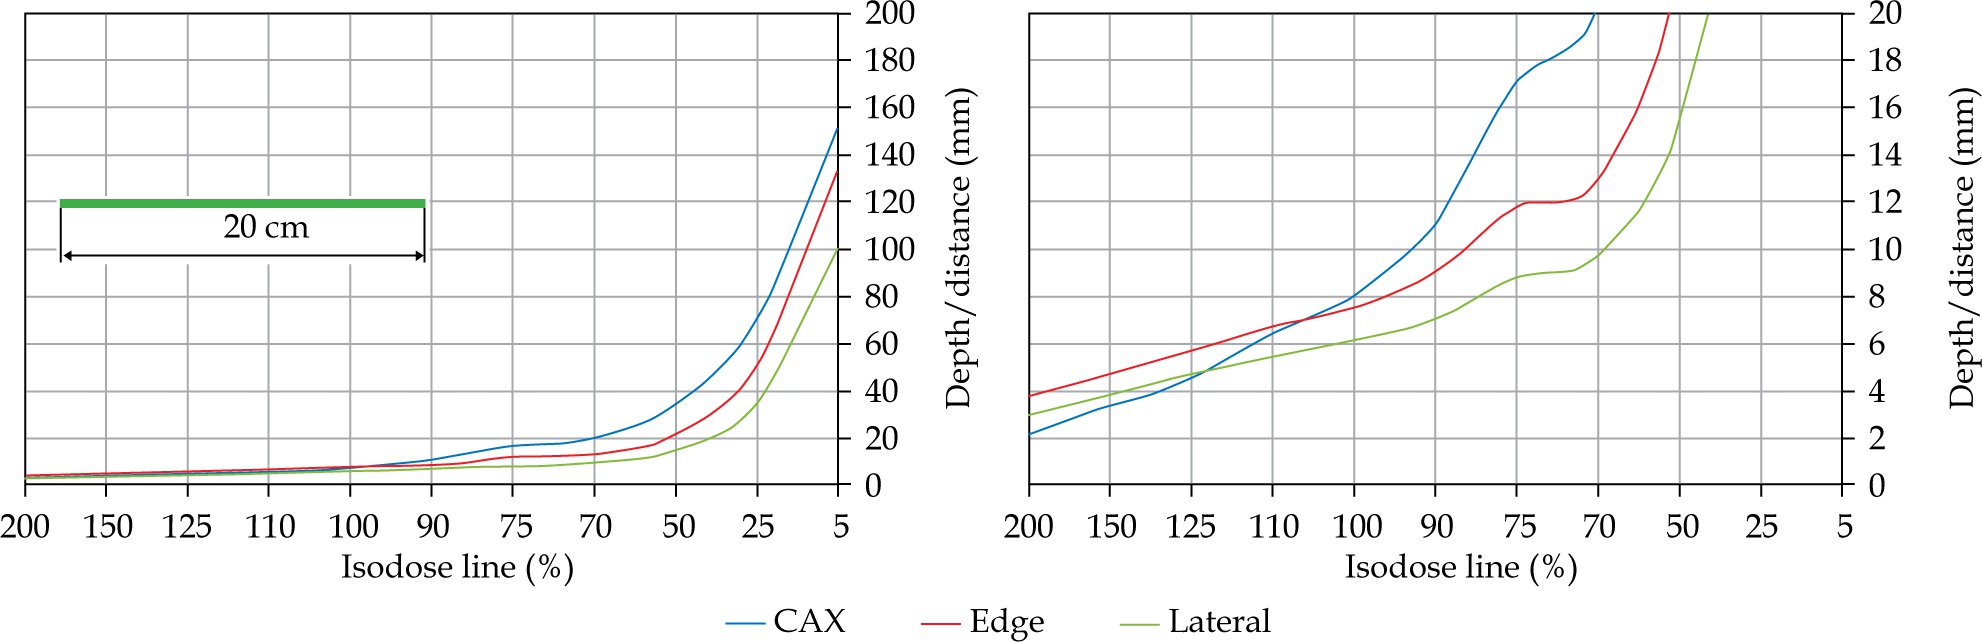
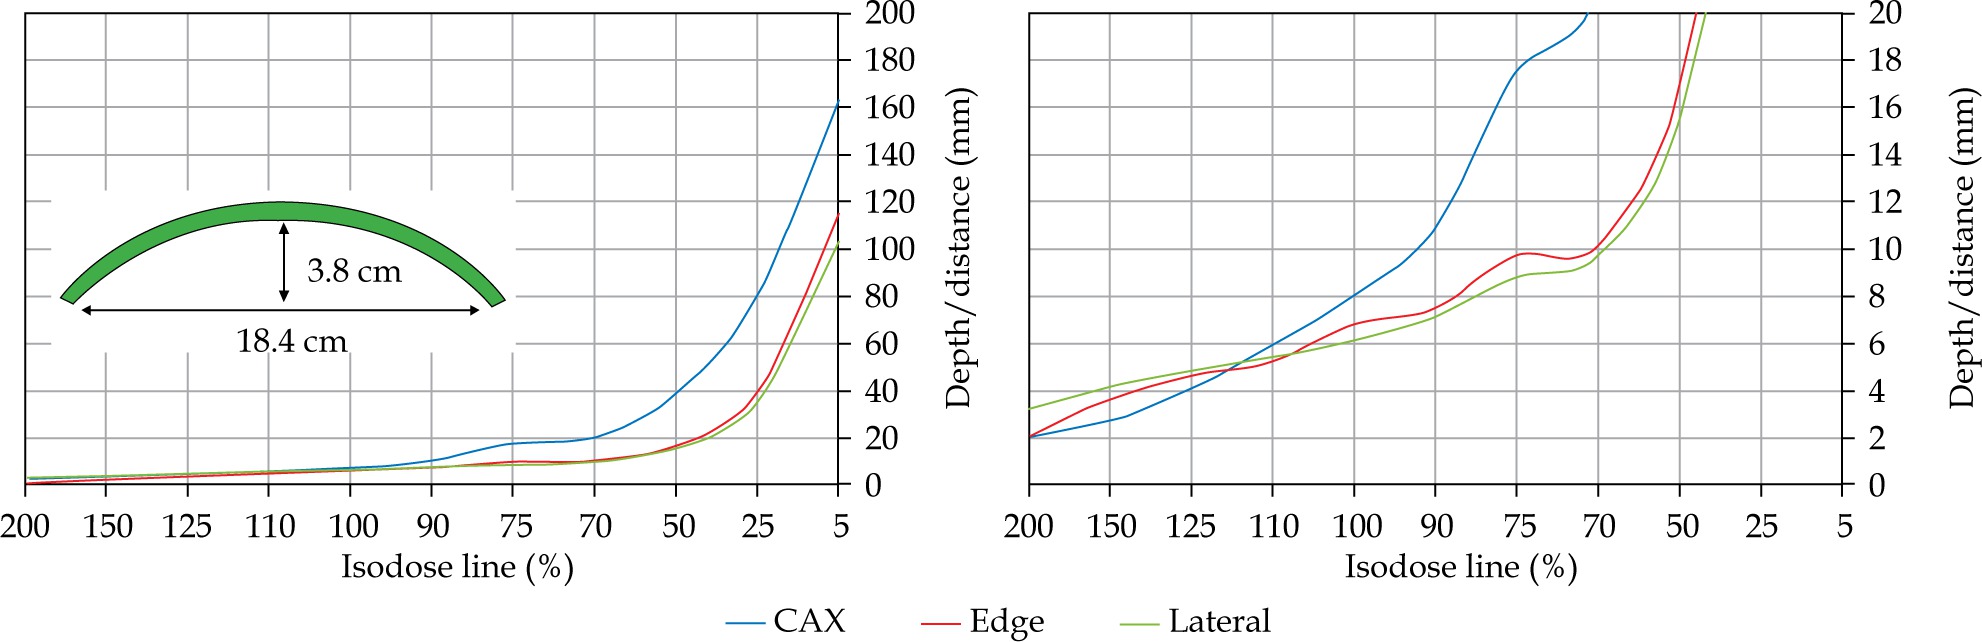
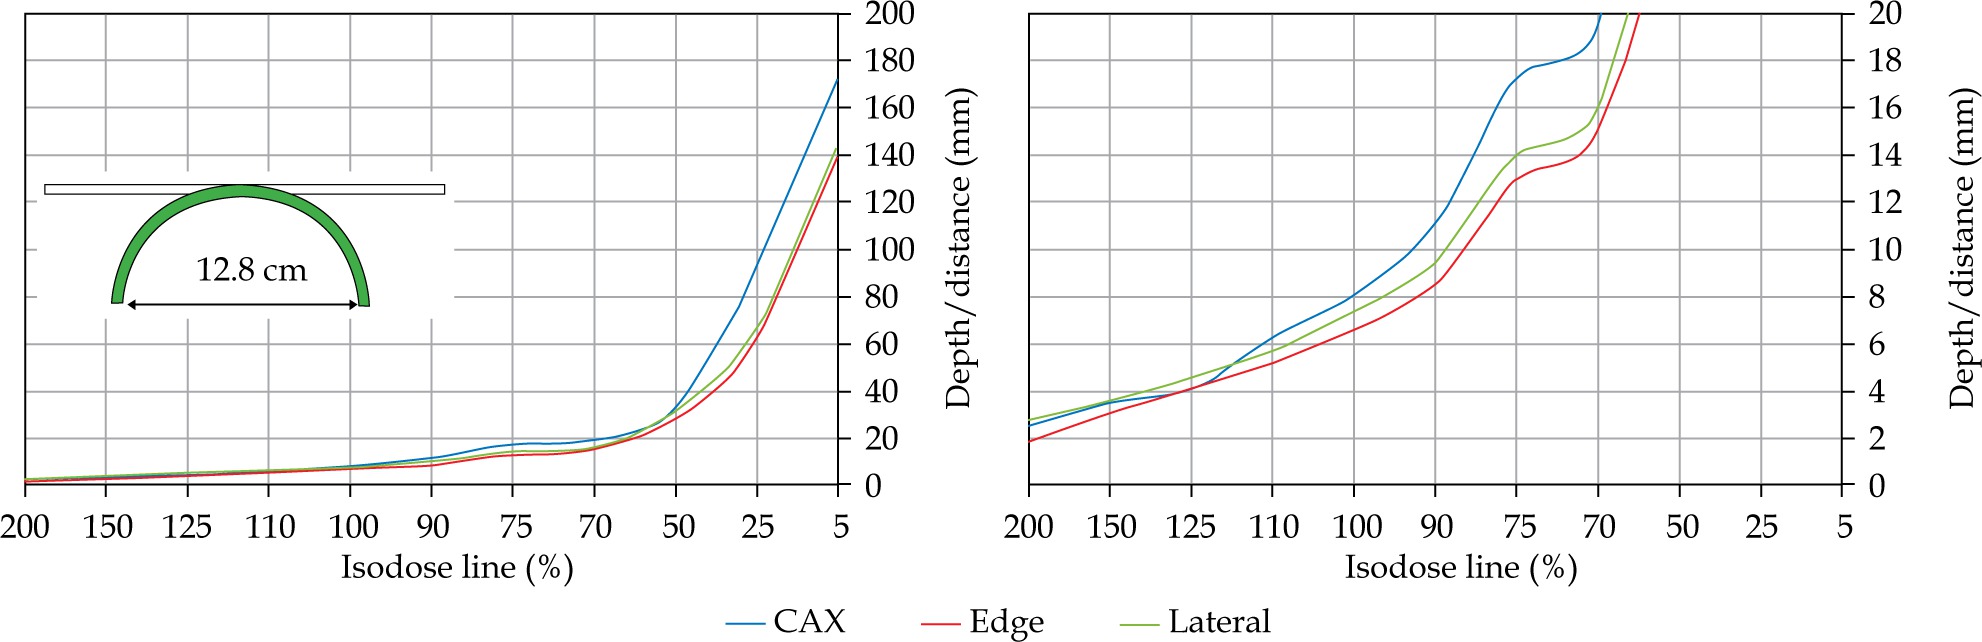
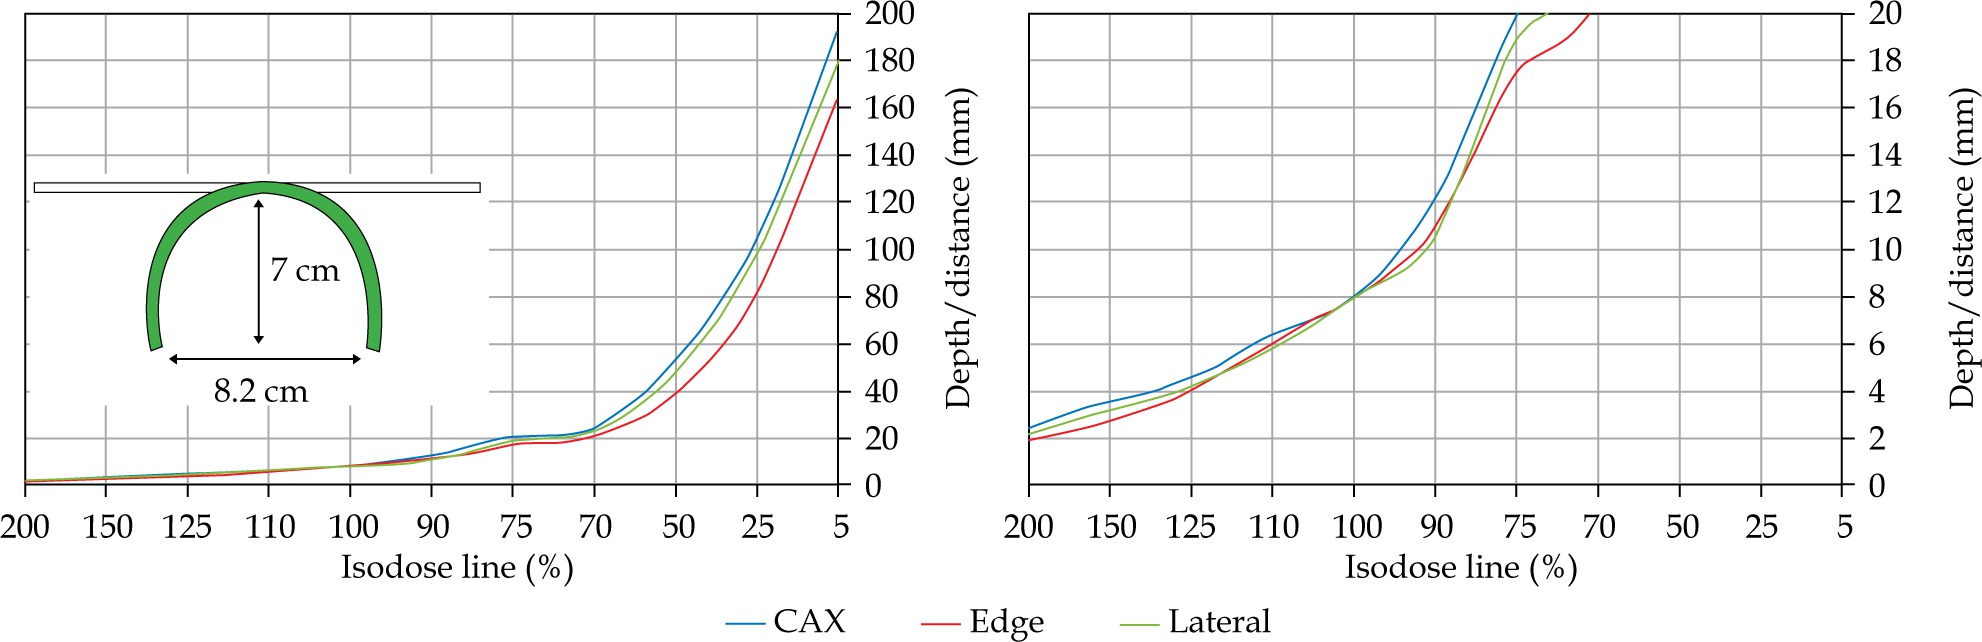
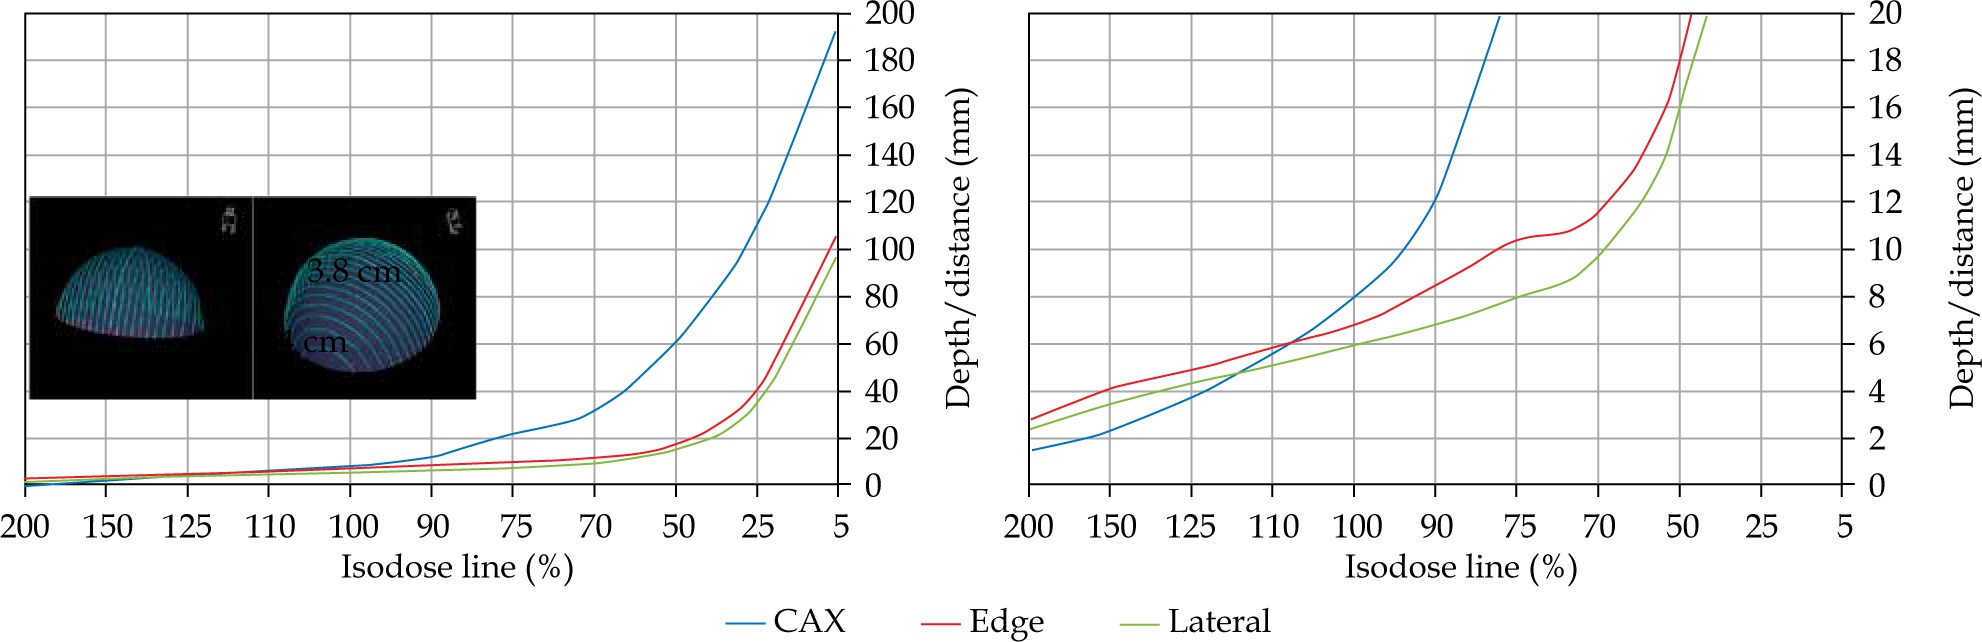
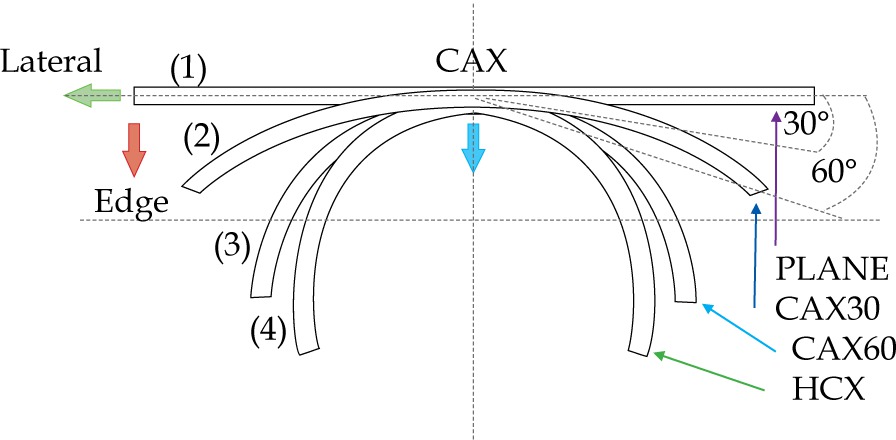
In the second part of this study, the dose distribution for a total of 9 HDR-BT cases was created for CTVs of 10 × 10 cm2 and 20 × 20 cm2, with a step size of 1 cm and a prescription depth of 3 mm, to generate a predictive model of dose distributions in surface brachytherapy. The geometry of applicators was planar with no curvature (PLANE), curved to 30° and 60° with respect to CAX (CAX30 and CAX60), and half-cylinder (HCX). These treatment plans were used to emulate typical treatments of the skin on a patient’s abdomen, flank, arm, forearm, neck, breast scar, chest wall, etc. The geometry of targets is presented in Figure 1. The dose fall-off was recorded in three regions: a) on the CAX of applicator, b) at the edge of applicator on the axis parallel to CAX (CAXE), and c) at the edge of applicator on the axis perpendicular to CAX (CAXL), as shown in Figure 1. This choice was made to be able to evaluate and predict dose distributions at depth (case a and b) and lateral spread of the dose with respect to the surface applicator or custom mold.
Fig. 1
The following applicators were designed to create dose distributions for the most common geometries: planar (PLANE) with no curvature, curved to 30°, and 60° with respect to the CAX (CAX30 and CAX60), hyperbolic arc with central angle of 215° (HCX)
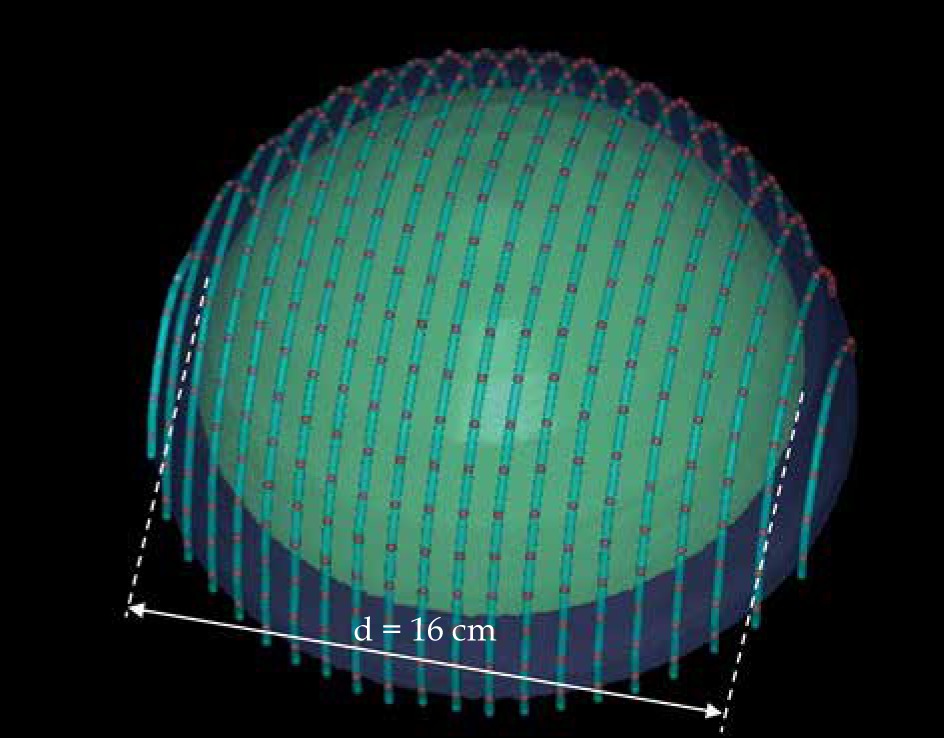
An additional dose distribution was created, in which the applicators formed a dome shape (DS) with a diameter of 16 cm (Figure 2). This treatment plan was used to emulate the treatment of an average-sized scalp. All treatment plans were optimized to deliver a prescription dose at 8 mm equidistantly from parallel planes including dwell positions. This optimization was equivalent to the clinical arrangement since the source-to-surface distance for the flap applicators was 5 mm and the prescription depth was 3 mm in most of the clinical cases.
HDR treatment planning
The HDR planning was performed using Oncentra Brachy planning system (Elekta Brachytherapy version 4.5.3, Veenendaal, The Netherlands). The HDR-BT treatment planning method was clinically proven to be efficacious and effective [6]. The general planning details were summarized: a) in most cases, it was not necessary to contour the clinical target area (equivalent to the CTV); b) there was no need to contour the skin, either; c) skin markers (wires) delineated the CTV; they were crucial for planning and they had to be contoured in planning images; d) 100% of the prescription dose was 3 mm under the skin (to reach the dermis) or deeper up to 8 mm to reach the depth of the target. It was possible to generate the plan with a non-constant depth, i.e., the depth of central part of the target could be up to 8 mm in depth, whereas the depth at the target periphery could be 3 mm; e) the 125% isodose line stayed off or just touched healthy skin (OAR) (to spare stem cells and vasculature). In rare situations, the skin dose can be up to 135% of prescription dose for a treatment depth of 3 mm. Commercial flap applicators and custom-made applicators were used for HDR treatments. The prescription dose used in these treatments complied with published guidelines [8] for both palliative and definitive treatments.
The catheters were reconstructed either from the tip or connector end, maintaining consistent approach within each plan. Additional planes (paraxial, parasagittal, and paracoronal) were used for accurate catheter reconstruction to detect as many catheters as possible on a single slice. This technique was particularly used for catheter reconstructions in large CTVs with more than 30 catheters per plan. Only the dwell position inside or at the margin of CTV was activated to obtain adequate coverage. The treatment plans were initially normalized with respect to multiple dose points 3 mm into the target, to span the dose distribution evenly. Further optimization of the isodose lines fine-tuned the prescription dose. The process started with global optimization and ended with local adjustments of the isodose lines. Special attention was paid to dose distribution at the edges of applicators, so that local high-dose regions and poor coverage of targets could be avoided.
EBRT treatment planning
The EBRT planning was performed using EMC-10028 Electron Monte Carlo planning module of Eclipse (Varian Medical Systems, Inc., Palo Alto, USA). Single and matched beam techniques were used. The electron plans were generated using 6 MeV energy and 1 cm bolus to achieve an optimal dose distribution at the prescription depth. The electron beams were set perpendicular to the largest possible surface area.
Results
The results of the study were presented in two major sections: the first, compares the dosimetric effects of EBRT and HDR-BT plans over a clinically relevant range of topographies, and the second, investigates the predictive capability for OARs metrics from an HDR-BT plan at varying levels of depth and laterality.
HDR vs. EBRT: plan comparisons
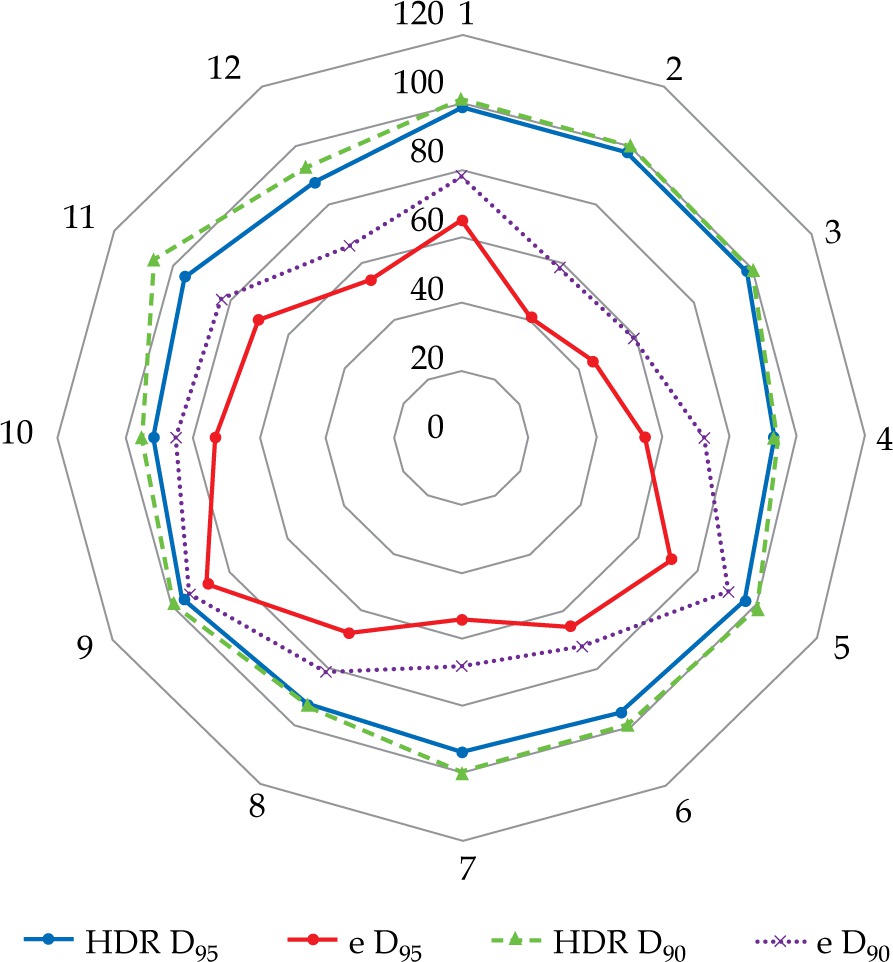
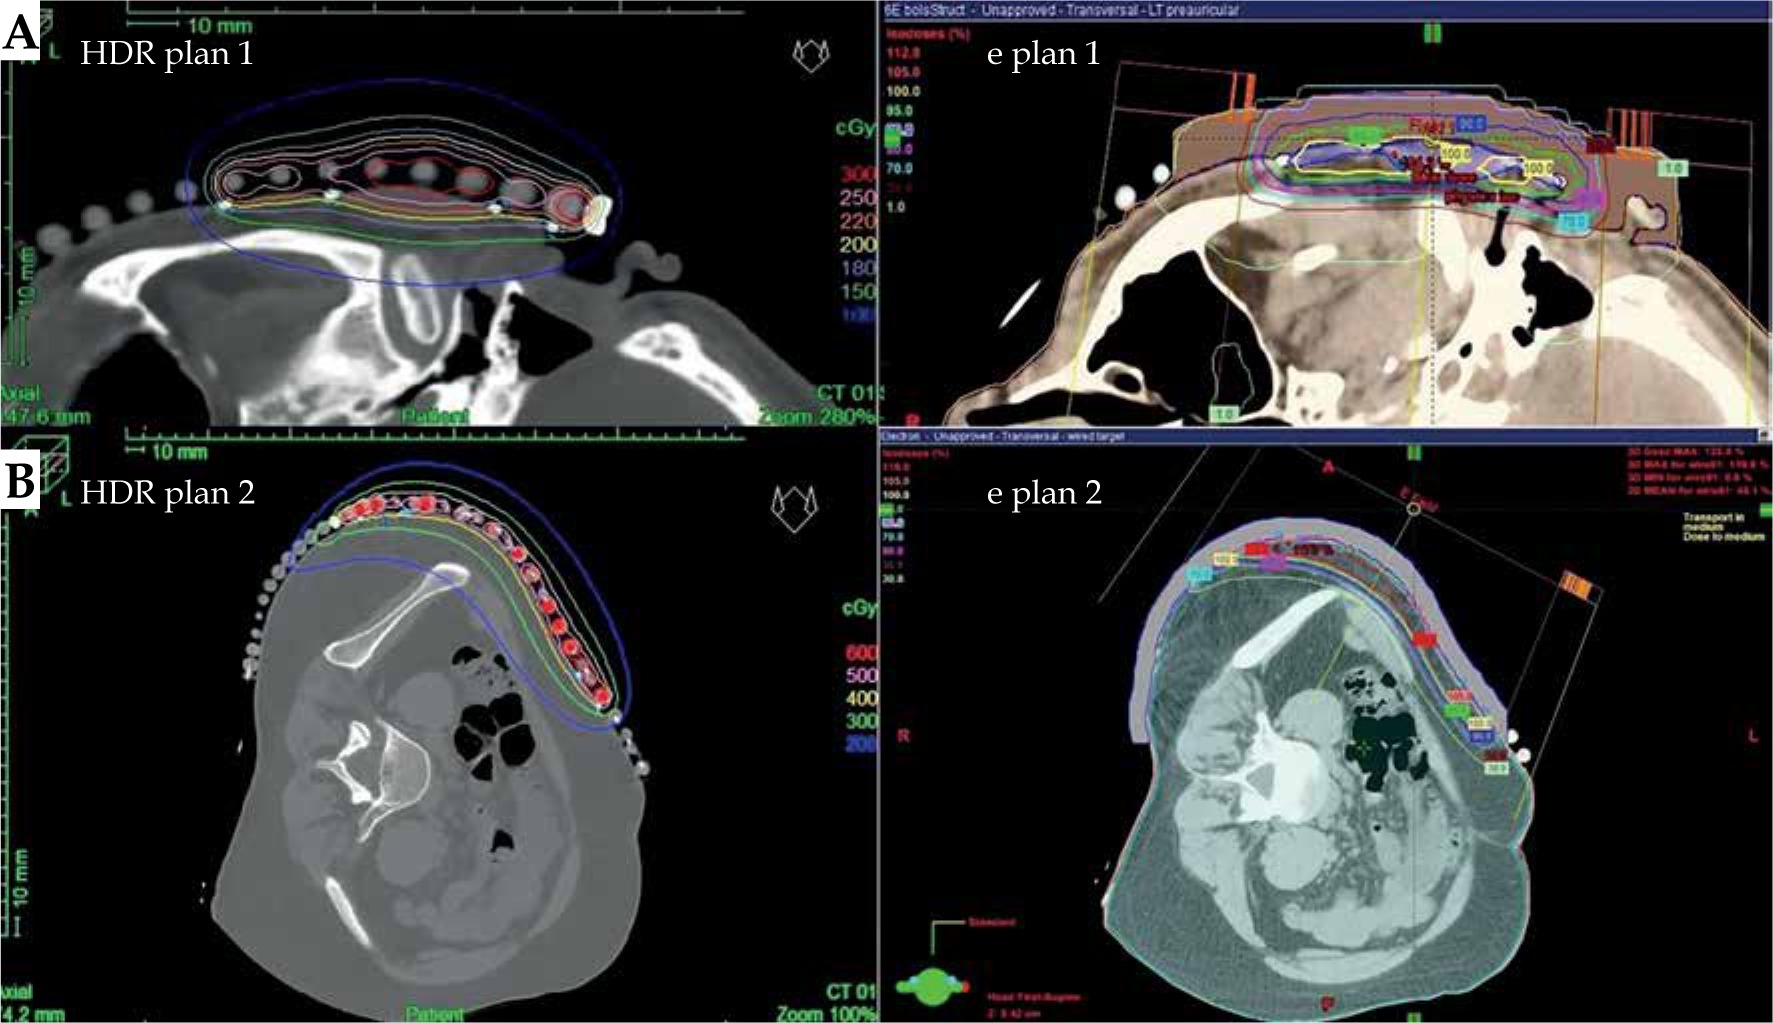
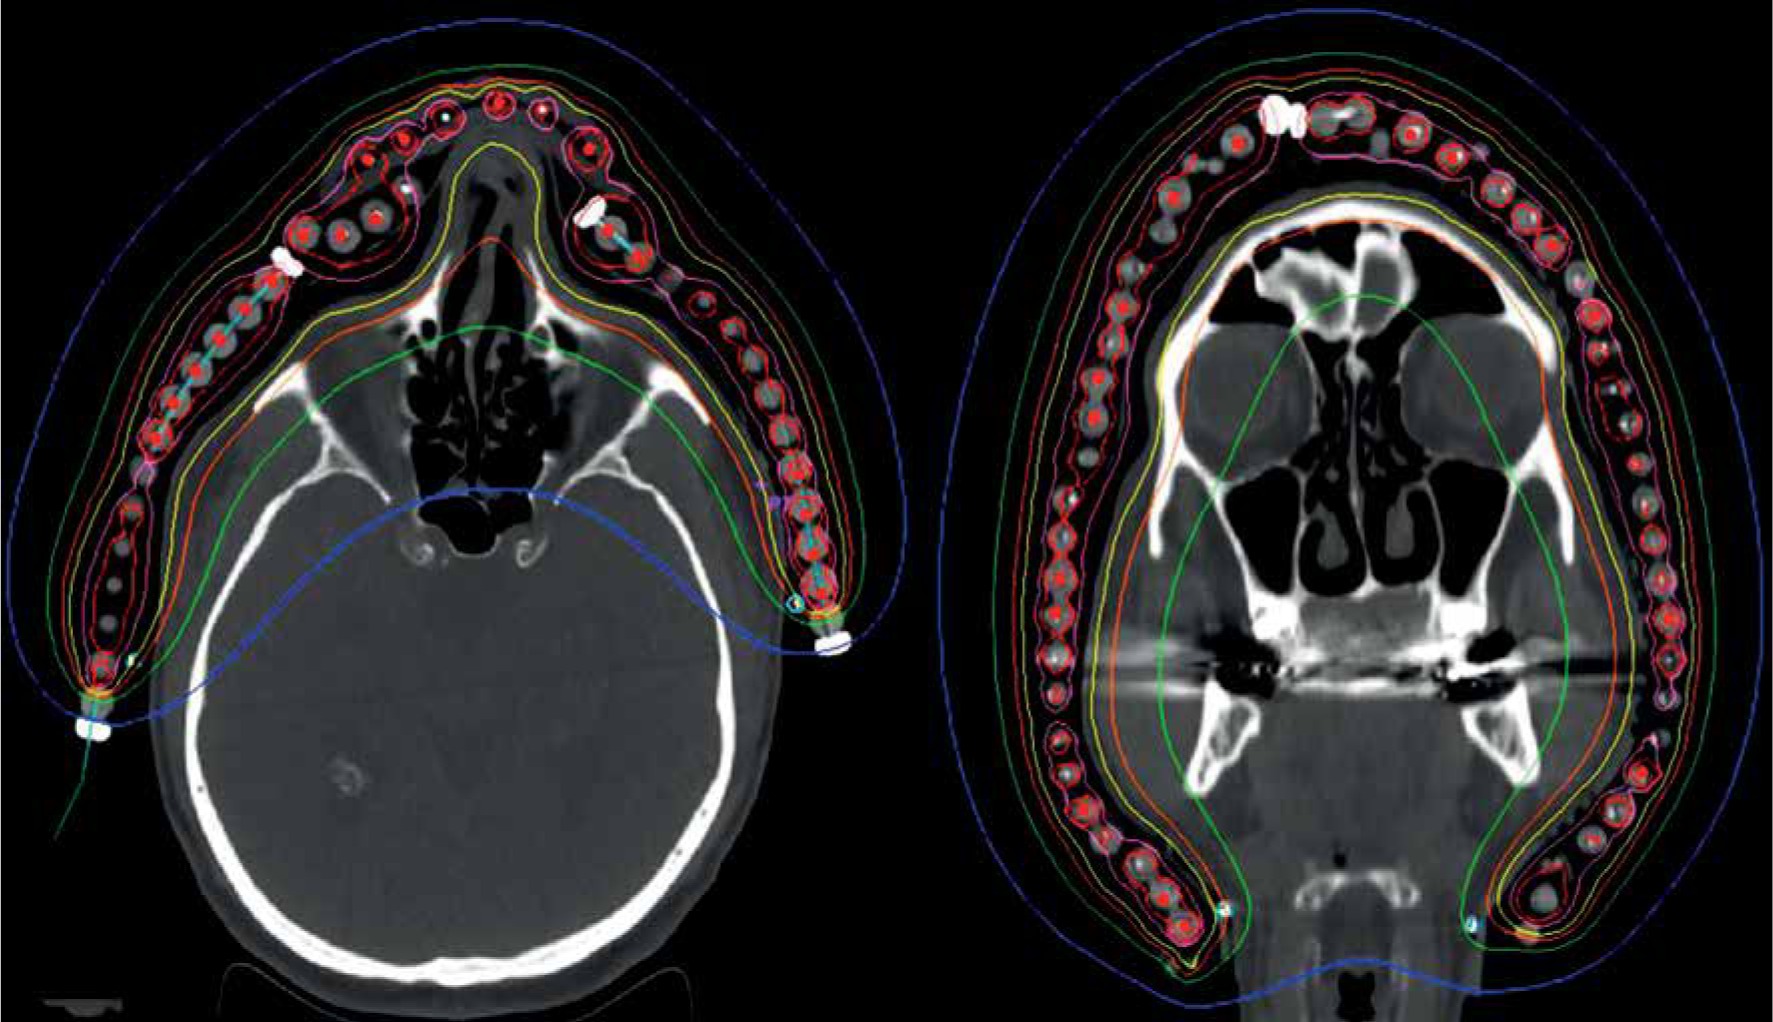
The significant degradation of CTV coverage for electron plans (D90) was recorded as 41.5% to 20% when the anterior-posterior CAX distance increased from 24 mm to 58 mm (as the curvature increased). Therefore, a decrease of CTV coverage for the electron plans was noted when the applicator formed an angle greater than 30°, according to the notation from Figure 1. When the CAX distance was increased further, the loss of CTV coverage remained nearly constant. The D50 for both HDR-BT and the electron plans was similar. The D95 and D100 degraded similarly as the D90 did for the electron plans as the applicator angle increased (Figure 3). The values for D2 cm3 for both plans were comparable and were in the range of –8% to 7.5% of the prescription dose. An increase in higher doses (D0.5 cm3 and D0.1 cm3) was noted in HDR-BT plans, and it was even greater for larger targets. The average increase was 4% for D0.5 cm3 and 12% for D0.1 cm3. When the CTV was approximately flat (that is, the CAX distance was less than 10 mm), the electron plans were comparable to the HDR plans, having a lower D2 cm3, D0.5 cm3, and D0.1 cm3 of 8% on average. It was observed that surface dose (d = 0) was lower for the electron plans in the range of 6-20% of the prescription dose. However, this advantage cannot be used to improve the loss of CTV coverage for the electron plans, because whenever the surface dose increased to the predefined limits, the prescription dose was delivered deeper than desired. Irradiated volumes for the electron plans were up to two times greater if the plans were normalized, to obtain an adequate CTV coverage. In general, the degradation of quality of the electron plans was found to be more dependent on the target curvature than on the CTV size. Figure 4 shows two representative cases planned with EBRT and HDR-BT. It was possible to achieve equivalent coverage and dose distributions in case 1 (small and almost flat surface) with both modalities; however, this was not feasible with a large CTV with curvy geometry (complex topology). The electron plans for the whole face and scalp treatments (11 patients in total) were suboptimal, and their statistical data were excluded from the numerical comparative analysis. In such cases (Figure 5), clinically acceptable plans were generated only with HDR-BT; no substitution with EBRT planning was feasible.
Fig. 3
Significant loss of the coverage for the electron plans was noticed as the applicator angle increased over 30° (purple and red lines). The green and blue lines represent the coverage for the HDR-BT plans, indicating that HDR-BT can adapt the dose to complicated topologies. The graph presents D90 and D95 data from 12 representative cases
Dose distribution in HDR skin brachytherapy
In this section, a dose distribution prediction model was presented using relevant distributions (Table 2) for various applicator shapes and sizes as shown in Figures 1 and 2. Corresponding figures (Figures S1-S9) were presented in the Supplement section of this paper. Isodose distributions were calculated using TG-43 formalism, and they were confirmed with Monte Carlo calculations. Issues related to the presence of bone and lungs in surface brachytherapy [9] and the lack of backscatter [10] have previously been analyzed. CAX and CAXE can be used to visualize and quantify the dose at depths along the CTV. CAXL represents dose distributions at the surface outside the CTV. For instance, CAXL can be used to evaluate the dose at the breast if the patient’s flank is treated or to evaluate the dose to the eyes if the patient’s cheek is treated. This can be done prior to generation of treatment plan; thus, a physician/physicist can establish a priori understanding of dose distributions for different clinical scenarios. Similarly, DS dose distribution can be used for evaluation of the dose to the brainstem, optic nerves, and other related structures prior to HDR-BT scalp treatment.
Table 2
Dose distributions in HDR surface brachytherapy. Depths were calculated from the source position (not from the skin)
Verification of the prediction model
Verification of the prediction model was performed on the same cohort of 37 patients involved in the first part of this study. After categorizing all patients based on their CTV geometry, it was found that the overall accuracy of this model was 1.9% (SD = 3.2%). An example of the validation was presented for CBCL of the abdomen (Figure S10A) and whole scalp treatment of angiosarcoma (Figure S10B). The accuracy of position of the isodose lines at the depths was 1.1 mm for the 50% isodose line, and 1.9 mm for the lower isodose lines. Figure S10 is presented in the Supplement section.
Discussion
In this study, we aimed to answer a common question in the treatment of skin malignancies (when resources are available for both options): should brachytherapy or electrons be used for a specific treatment? The study consists of two principal parts.
The first part was a dosimetric comparison between EBRT and HDR-BT of 37 representative cases with various CTV geometries. Since the prescription depth for treatments was 3 mm, at least 1 cm bolus had to be used for 6 MeV treatment plans. However, it was not always possible to maintain constant depth along the target with EBRT. This effect became pronounced when the CTV started curving for 30° or more with respect to the CAX (the CAX distance in the axial slices became greater than 20 mm). In such cases, a decrease of CTV coverage (D90 and D95) up to 40% was observed. Therefore, it was confirmed that the curvature of the target played a crucial role in such treatments. As the curvature increased, the degradation of EBRT plans also increased. As a result, HDR-BT showed superior results in these cases since this modality could ‘curve’ the dose and adapt to the target. In these cases, the matched-field EBRT might be a better plan option than single-field EBRT. However, this would raise a well-known concern about electron field matching [11]. The degradation of D90 and D95 for EBRT plans stayed constant as the curvature increased; however, this finding did not have relevant clinical implications. The trend of decreasing D90, D95, and D100 was found to be similar between HDR-BT and EBRT. Hot-spots and high-dose regions inside the CTV (evaluated through D0.1 cm3, D0.5 cm3, and D2 cm3) were found to be within the same range (approximately of ±7%) for D2 cm3. However, the EBRT plans showed better homogeneity than the HDR-BT plans, since the D0.1 cm3 and D0.5 cm3 were lower, approximately 4% and up to 12%, respectively. Another dosimetric advantage of the EBRT plans was lower skin dose in the range of 6-20%. Similarly, the irradiated volume for the EBRT plans was lower, up to 50%. Therefore, this indicates that the EBRT plans resulted in comparable or even better dosimetry when the target was flat. The above dosimetric benefits were still noted when the CTV started curving above 15-20°; however, their relevance was low in these situations, since the coverage of CTVs became insufficient for the treatment. When the size of CTV started increasing, a similar trend was observed. It was noted that the HDR-BT plans were more suitable for clinical use when the CTV became large enough; often, it was necessary to generate matched-beam EBRT plans. However, it was noticed that curvature of the CTV was a more important factor in modality selection than the size of CTV.
Once the initial choice between EBRT and HDR-BT was made based on target geometry, the question remains what HDR-BT dosimetry for complicated topology targets can be achieved. When dose distributions for a standard CTV of 10 × 10 cm2 and various curvatures (PLANE, CAX30, CAX60, and HCX) were analyzed, a strong similarity in dose distributions along the CAX was noted for 5% isodose lines and below (at a depth of 140 mm) as well as for isodose lines, ranging between 95 and 200%. The most prominent differences were revealed for isodose lines of a) 50%, ranging between 27 and 47 mm for PLANE and HCX, respectively, and b) 70% ranging between 16.5 and 39 mm for PLANE and HCX, respectively. These isodose lines for CAX30 and CAX60 were within the same range. The 5% isodose line for the DS custom-made applicator reached 194 mm along the CAX, whereas isodose lines above 70% were comparable with the one in HCX. The CAXE distribution was found to have a smaller range than the one presented along the CAX. For example, the range of depths was greatest at 25% isodose line (44 mm for PLANE and 3 mm for HCX). In this case, differences in depth were noted for all high isodose lines (90% and above), except for the CAX distributions. A strong similarity in dose distribution was noted outside the field (CAXL) for isodose lines of 50% and greater. For example, the 25% isodose line was noticed at a depth of 29.5 mm for PLANE and 35 mm for HCX. As the CTV increased (20 × 20 cm2), the range of lower isodose lines increased along the central axes (151 mm for PLANE, and 192 mm for HCX), maintaining a high range even close to the prescription depth (for 90% isodose lines, the difference in depth was 1.2 mm for given applicators). There were similar trends for the CAXL dose distribution of 20 x 20 cm2 applicator, but not for 10 × 10 cm2 one. Apart from some site-specific studies, such comparisons have not yet been reported. Some partial findings and initial results of this study had been reported previously [12].
Conclusions
In this article, the selection criteria between two radiation modalities (EBRT and HDR-BT) used in the treatments of surface targets were presented. The general conclusion was that both techniques could be successfully used in the treatments of superficial targets. The quality of treatment for each technique and the outcome were dependent on the target geometry, i.e., size, curvature, and topology. The decrease in quality of electron plans was found to be more dependent on target curvature than on CTV size. It was shown that HDR-BT provided superior CTV coverage in comparison with EBRT when the surface was very large, complex, curvy, or rounded (arm, leg, flank), and when the topology was complicated (fingers, whole face). A notable advantage of HDR-BT plans was the ability to deform and adjust dose over large irregular surfaces using commercial flap applicators or custom-made applicators. However, for flat, smaller, and medium-sized targets (with an area of less than 12 × 12 cm2), EBRT yielded comparable plans and improved dose homogeneity. A predictive model using dose distributions was developed for improved understanding of isodose line distributions for various clinical scenarios to assist in deciding on which modality to deploy.