
Introduction
Hepatocellular carcinoma (HCC) is one of the most common cancers worldwide and is highly prevalent in Egypt. Unfortunately, most HCC patients in Egypt are first diagnosed in the intermediate or advanced stages [1]. For early diagnosis and to reduce HCC-related mortality, new HCC diagnostic and prognostic biomarkers are crucial [2]. Multiple risk factors are correlated with HCC, including alcohol abuse, hepatitis B virus (HBV) or hepatitis C virus (HCV) infection, aflatoxin exposure, nonalcoholic steatohepatitis, and metabolic diseases [2].
The transmembrane 6 superfamily member 2 (TM6SF2) gene is located on chromosome 19 and encodes a protein composed of 351 amino acids [3]. Expression pattern analysis has shown that TM6SF2 is mainly expressed in the kidney, small intestine and liver, all of which are tightly associated with lipid metabolism; the expression levels of TM6SF2 are lower in most other tissues [3]. TM6SF2 gene E167K variant (rs58542926) was identified in an exome-wide association study as a non-synonymous single nucleotide polymorphism (SNP) associated with non-alcoholic fatty liver disease. SNPs can influence gene expression, protein function and disease susceptibility [5]. The E167K variant helps regulate liver fat metabolism, influencing triglyceride secretion and hepatic lipid droplet content, and has been associated with increased hepatocytic triglyceride content, dyslipidemia, and cardiovascular risk, advanced hepatic fibrosis, and cirrhosis [4]. We determined the association between the TM6SF2 gene SNP rs58542926 and HCC occurrence and progression in Egyptian CLD patients to evaluate its utility as a diagnostic and prognostic biomarker of HCC.
Material and methods
The study was conducted in the Clinical Pathology and Hepatology and Gastroenterology Departments at the National Liver Institute, Menoufia University, Egypt, between January 2019 and March 2020. A total of 120 subjects were enrolled in this case-control study, including 40 patients with HCC and 40 patients with CLD with no radiological evidence of HCC. Infections associated with hepatitis types C or B were the cause of chronic liver disease in this group in addition to 40 healthy age- and sex-matched individuals as a control group, with no previous history of liver or malignant diseases and negative for hepatitis viral markers. Patients with HCC were diagnosed according to definitive criteria detected by triphasic computed tomography with contrast (which showed arterial enhancement and delayed venous washout). Patients were excluded if they had been diagnosed with an inflammatory disease, hematological malignancy, and cancer of any organ other than the liver. The study protocol was approved by the local ethics committee of the National Liver Institute, Menoufia University, Egypt. Informed consent was collected from all participants after receiving information about the study.
Relevant clinical data were collected from all participants. Laboratory blood analyses included those for liver and renal function. The Cobas 6000 autoanalyser (Roche Diagnostics, Germany) was used to determine aspartate aminotransferase (AST), alanine aminotransferase (ALT), γ-glutamyl transferase (GGT), alkaline phosphatase (ALP), total bilirubin, direct bilirubin, serum albumin, creatinine and urea. Alpha-fetoprotein (AFP, Cobas e411 immunoassay analyzer, Roche Diagnostics, Germany), prothrombin time (Coagulometer CA-1500, Siemens, Germany), and hepatitis serology (HBsAg and HCVAb) (Cobas e411 immunoassay analyzer, Roche Diagnostics, Germany) were also assessed.
SNP genotyping for the TM6SF2 rs58542926 polymorphism was performed using a real-time PCR assay (Applied Biosystems, USA). Total DNA was extracted from EDTA-treated blood samples using the QIAamp DNA Mini Kit (Thermo Fisher Scientific, Lithuania).
After ethanol precipitation, the DNA was purified and dissolved in double-distilled water and stored at –20°C until analysis [6]. The TM6SF2 gene polymorphism (rs58542926) was genotyped by real-time PCR fluorescence detection on an ABI 7500 Real-Time PCR system using fluorescence-labeled probes. Context Sequence [VIC/FAM]: The PCR primers (Thermo Fisher Scientific) were as follows: forward 5’GTGAGGAAGAAGGCAGGCCTGATCT3’ and reverse 5’GGAGCTGTATTTGCCTTCCATGGTG3’.
Preparation of solution reaction (Total volume 20 µl): [Master Mix (2X) 10 µl, TaqMan assay 20 k 0.5 µl, Template DNA 5 µl, Water and nuclease-free 4.5 µl]. PCR cycling conditions were 95°C for 10 min, then 40 cycles of amplification of 95°C for 10 s, 60°C for 30 s, and 68°C for 15 s.
Automatic or manual allele calls were marked. The software analyzed the before and after fluorescence levels and calculated normalized dye fluorescence (ΔRn) as a function of cycle number for Allele1 (wild-type) or Allele2 (mutant). Based on this number (the relative number of the possible outcomes), the software makes an automatic call of Allele1 (homozygous 1/1), Allele2 (homozygous 2/2), or heterozygous (1/2).
Statistical analysis
Statistical analysis of the data was conducted using SPSS version 22 (SPSS Inc., USA). Data were analyzed descriptively and quantitatively using a χ2 test, one-way ANOVA, Kruskal-Wallis test, Fisher’s exact test, odds ratio (OR), and confidence interval (CI) test. P-values < 0.05 were considered statistically significant.
Results
There were no significant differences between the groups in terms of age (p = 0.06) or gender (p = 0.750) (Table 1). There were significant differences between the three groups regarding liver cirrhosis, ascites, portal vein thrombosis and Child-Pugh score (p ≤ 0.001), but no significant differences regarding smoking habits (p = 0.39) and diagnosed diabetes mellitus (p = 0.55) (Table 2). Blood concentrations of AST, ALT, GGT, ALP, total bilirubin, direct bilirubin, serum albumin, creatinine, urea, AFP and international normalized ratio (INR) were significantly different between the groups (p ≤ 0.001) (Table 3).
Table 1
Sociodemographic data of the studied groups
Table 2
Comparison between the two studied groups according to risk factors
Table 3
Comparison between the different studied groups according to laboratory data
AST – aspartate aminotransferase, ALT – alanine aminotransferase, ALP – alkaline phosphatase, γ-GT – γ-glutamyltransferase, TP – total protein, INR – international normalized ratio
χ2– chi-square test, F – F for ANOVA test, Pairwise comparison between each 2 groups was done using a post hoc test (Tukey), H – H for Kruskal-Wallis test, pairwise comparison between each 2 groups was done using a post hoc test (Dunn’s test for multiple comparisons)
The frequency distributions of the different genotypes for the TM6SF2 polymorphism were significantly different between HCC patients and the other groups (Table 4). HCC patients had a higher incidence of TT and TC genotypes than CLD patients and healthy controls (p = 0.001 and p = 0.008, respectively). A statistically higher incidence of the T allele was observed in HCC than in the CLD and healthy control groups (p < 0.001) (Table 4, Fig. 1).
Table 4
Comparison of genotype and allele frequencies of rs58542926 between HCC patients, CLD and control group
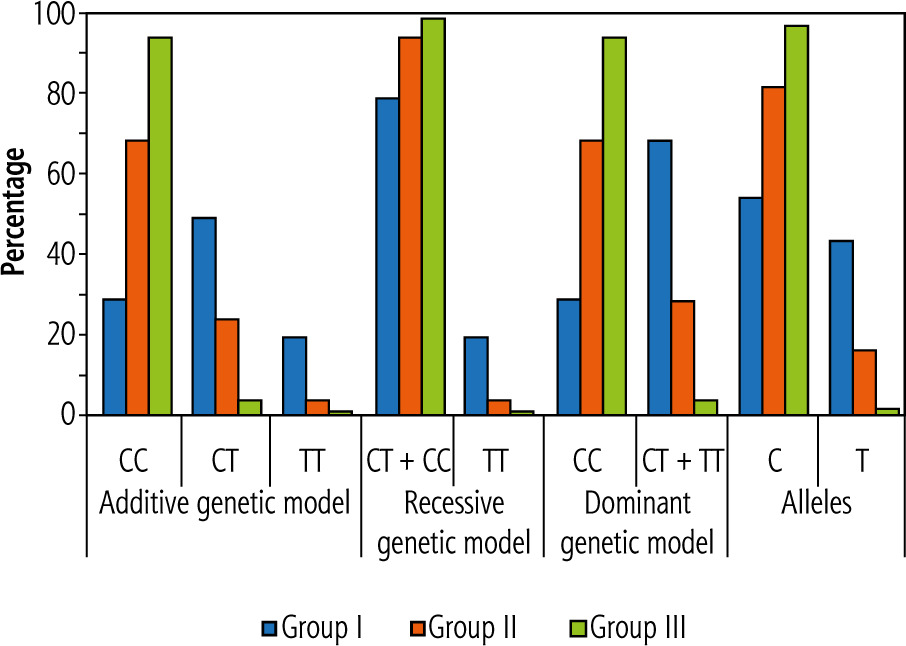
In evaluating the risk of HCC according to TM6SF2 genotype, we identified significantly higher TC and TT genotype frequencies in the HCC group (50% and 20%, respectively) than in the other groups (Table 4, Fig. 1). In contrast, the CC genotype frequency was significantly higher in the control group (95%) than in the other groups (p < 0.001).
In the additive genetic model, CLD patients with the CT genotype had a significantly higher risk of HCC development (OR = 4.67, 95% CI: 1.67-12.90). Individuals carrying the TT genotype had a significantly increased risk of HCC (OR = 9.33, 95% CI: 1.72-50.61) (Table 4, Fig. 1). Furthermore, HCC patients had a significantly higher frequency (p < 0.001) of the T allele (45.0%) than CLD and control groups (17.5% and 2.5%, respectively).
The dominant genetic model combination of TC and TT genotypes was significantly greater in the HCC group (70.0%) than in the CLD and control groups (30% and 5%, respectively; p < 0.001). Also, CLD patients carrying the T allele (TC + TT) had a 5.44-fold increased risk for HCC development (OR = 5.44, 95% CI: 2.09-14.17) (Table 4, Fig. 1).
In the control group, the study results were in accordance with the Hardy-Weinberg law of disequilibrium (χ2 = 0.026, p = 0.87).
Univariate analysis of potential HCC risk factors indicated that age and presence of the T allele (CT + TT) were associated significantly with a higher risk of HCC than in the control group (OR = 1.088, 95% CI: 1.011-1.171 and p = 0.025; OR = 44.333, 95% CI: 9.182- 214.062 and p < 0.001, respectively) (Table 5). Univariate analysis of potential HCC risk factors of HCC against CLD indicated that splenomegaly and T allele in the homozygous and heterozygous genotypes (CT + TT) were associated significantly with an increased risk of HCC against CLD (OR = 7.429, 95% CI: 2.703-20.419 and p < 0.001; OR = 5.444, 95% CI: 2.092-14.168 and p = 0.001, respectively) (Table 6).
Table 5
Univariate and multivariate logistic regression analysis for the parameters affecting the HCC group compared to the control
Table 6
Univariate and multivariate logistic regression analysis for the parameters affecting the HCC group (n = 40) compared to the chronic liver disease group (n = 40)
Multivariate analysis showed that the T allele in homozygous and heterozygous forms (CT + TT) was associated significantly with a higher risk of HCC than the control group (OR = 42.359, 95% CI: 8.560-209.598 and p < 0.001) (Table 5). Multivariate analysis conducted on potential risk factors of HCC against CLD also showed that splenomegaly and the presence of the T allele in homozygous and heterozygous forms (CT + TT) were associated significantly with an increased risk of HCC against CLD (respectively, OR = 5.131, 95% CI: 1.763-14.937 and p = 0.003; OR = 3.409, 95% CI: 1.203-9.660 and p = 0.021) (Table 6).
Discussion
Hepatocellular carcinoma is the most common primary malignancy of the liver and the third leading cause of cancer mortality worldwide. The incidence of HCC is increasing, presenting a major global health challenge [7]. In Egypt, HCC is the second most common cancer in men and the sixth most common cancer in women [8]. Furthermore, it is associated with a low 5-year survival rate and an increased mortality rate [9].
The mean age (±SD) of HCC patients in our study was 55.23 ±7.13 years. These results are similar to those of Mohammed et al. [10], who studied an HCC patient cohort with a mean age of 55.4 ±9.757 years, and Sang-Wook et al. [11], who studied an HCC cohort with a mean age of 53.0 ±9.7 years. However, Fotos et al. [12] found that HCC is more frequent in patients ≥ 65 years of age.
The mean age of patients with CLD was 52.40 ±7.10 years. This was consistent with Banait et al. [13], who reported that CLD was more frequent in patients ≥ 50 years. In contrast, Abdelmenan et al. [14] found that the mean age of CLD patients was between 30 to 40 years.
We found a statistically significant difference between HCC patients and the other two groups in values of AST, ALT, ALP, GGT, AFP, albumin, total and direct bilirubin and INR. These results are consistent with Zekri et al. [15], who found a statistically significant difference between the HCC patient group and control group in AST, ALT, albumin, bilirubin and INR values. Similarly, Redwan [16] obtained the same result. In contrast, Sarwar et al. [17] found no significant difference in serum albumin and INR between the HCC group and the non-HCC group.
The TM6SF2 gene E167K variant (rs58542926) is associated with non-alcoholic fatty liver disease, a disease frequently associated with metabolic disorders and fat deposition in liver cells. Some studies have demonstrated that this variant increases the risk of developing liver fibrosis and steatohepatitis [18]. Furthermore, it has emerged as a predictor of fibrosis progression and hepatocellular carcinoma occurrence [18].
The TM6SF2 E167K variant features a C-to-T substitution at nucleotide 499, encoding a glutamate-to-lysine change at codon 167, resulting in a misfolded protein, accelerated protein degradation and reduced protein levels in the body [19].
The present study was designed to evaluate the role of rs58542926 and the development of HCC in an Egyptian cohort. Multiple studies have focused on the role of a common non-synonymous polymorphism in TM6SF2 (rs58542926, E167K) in lipid metabolism and chronic liver disease, and multiple studies have focused on the role of the TM6SF2 rs58542926 variant in chronic liver disease and HCC.
Genotyping will permit more precise HCC risk stratification of patients with chronic liver diseases, and genotype-guided screening algorithms would optimize patient care [20]. Assessing genetic risk factors associated with the development of HCC may allow for earlier diagnosis of malignancy and could potentially lead to decreased disease-specific mortality rates.
Current studies have shown that the (TM6SF2) rs5854292 gene polymorphism is associated with non-alcoholic fatty liver disease. Meanwhile, multiple investigators in China and other countries have conducted many studies to assess the relationship between the TM6SF2 rs5854292 gene polymorphism and liver cancer. Some studies concluded that the TM6SF2 rs5854292 variant was associated with the risk of developing liver cancer [21]. Other studies, however, demonstrated that the presence of the TM6SF2 variant did not appear to be associated with a further increased risk of developing HCC [22].
We found in this study that the genotype distribution among the studied groups was significantly different between HCC patients and the other groups. HCC patients had a higher incidence of TT and TC genotypes than CLD patients and healthy controls. The T allele frequency in HCC patients was higher than in CLD patients and healthy controls.
The TC and TT genotype frequencies were significantly higher in the HCC group (50% and 20%, respectively) than in the other groups, while the CC genotype was significantly higher in the control group 95% than in other groups. The dominant genetic model combination of TC and TT genotypes was statistically significantly higher in the HCC group (70.0%) than in the CLD and control groups (30% and 5%, respectively).
These results were similar to those of the metanalysis of Tang et al. [21], who found that the pooled risk of liver cancer was higher in the TT + CT genotype than in the CC genotype (CC vs. CT + TT, OR = 1.675, 95% CI: 1.413-1.985, p = 0.000).
We found that in the additive genetic model, CLD patients with the CT genotype correlated with an increased risk of HCC development (OR = 4.67, 95% CI: 1.67-12.90). Patients with the TT genotype had a significantly higher risk of HCC (OR = 9.33, 95% CI: 1.72-50.61). This was consistent with the results of Stickel et al. [20] (OR = 1.66, 95% CI: 1.30-2.13, p = 5.13 × 10⁻⁵), who used an additive model controlling for sex and age.
In our cohort, HCC patients had a significantly higher frequency of the T allele (45.0%) than the CLD and control groups (17.5% and 2.5%, respectively). Also, in the dominant genetic model, CLD patients carrying the T allele (TC + TT) had an increased risk for HCC development (by 5.44-fold). Our results were similar to the results obtained by Tang et al. [21] and Raksayot et al. [23], who found that patients with the T allele were at increased risk for HCC (OR = 1.621, 95% CI: 1.379-1.905, p = 0.000; and OR = 2.22, 95% CI: 1.34-3.65, p = 0.002, respectively).
Conclusions
The TM6SF2 gene E167K variant (rs58542926) polymorphism was found to be associated with an increased risk of HCC in our Egyptian cohort. More studies are needed that include larger sample sizes and more ethnic groups. Knowledge of the mechanisms involved in HCC carcinogenesis may help to identify targets for the development of chemoprevention or therapeutic strategies.


