
Introduction
Increases in fat mass and weight are specifically linked to the menopausal phase [1]. Conditions such as obesity, especially the amount of abdominal fat, are often associated with cardiovascular diseases and risk factors such as plasma lipids, hyper-insulinemia, and insulin resistance [2]. Deterioration of physiological activities, associated with aging and inactivity, may also intensify during menopause [3]. Exercise, which is believed to be associated with improvements in insulin sensitivity, can aid in visceral fat reduction, especially in the central regions of the body [4]. The underlying molecular and cellular mechanism is not clearly understood, but research tells us that the muscle contractions lead to high secretions of myokines, which are assumed to mediate the positive effects of exercise [5].
As such, physical exercise stimulates the expression of the fibronectin type III domain containing 5 (FNDC5) gene, which leads to high levels of eponymous protein successors. FNDC5 is the pro-protein of irisin, a type of myokine, which engenders the transformation of white to beige adipocytes via uncoupling protein 1 [6]. Subsequently, the body’s energy expenditure and thermogenesis also rise in response to the secretion of irisin. This event has an enriching effect on metabolic traits (such as decreased insulin sensitivity, high fasting blood sugar, hyperlipidemia, reduced HDL, impaired adipose tissue function) linked to overweight and obesity [6, 7].
Based on existing studies, exercise type (endurance/resistance), exercise time (acute/chronic), exercise intensity, and personal training prior to participation in studies count as factors affecting the circulating irisin level. Indeed, different studies have reported physical exercise influences are significant in irisin circulation levels [8-10], while other studies show that exercise, acute and/or chronic, has no substantial effect on blood irisin level [11-13]. Therefore, the role of exercise on irisin activity has been a controversial subject[14-17]. Furthermore, inconsistent results have come into view regarding irisin concentrations caused by exercise. In another study, a significant increase in irisin levels after a session of high-intensity interval training (HIIT) was observed, while Pilates seems to have no influence on overweight women [18]. Likewise, there is very little knowledge about how high-intensity concurrent training might affect metabolic functions in the middle-aged woman’s well-being.
Despite conflicting data, the effect of irisin on metabolic traits linked to obesity appears favorable. However, it must be mentioned that post-training irisin measurements in postmenopausal women were not performed. Therefore, the concrete effect of exercise in promoting expression and secretion of irisin in the human body remains uncertain. On the other hand, as hypothesized by the authors, circulating levels of myokines may fluctuate differently under the influence of different types of exercises. The selected protein was chosen because it was newly discovered as a plasma myokine. Irisin and its metabolic functions have not been previously studied in postmenopausal women.
Based on the favorable effects of aerobic and resistance training on health, the current research intends to examine the effects of two concurrent exercise training programs on insulin sensitivity status, serum levels of irisin andabdominal fat distribution (visceral vs. subcutaneous) and total abdominal fat in postmenopausal women.
To achieve more accurate results, two control groups were selected: one for the potential effects of daily exercises and the second to account for any additional factors. The training program lasted for ten weeks. Our hypothesis herein is that high-intensity concurrent interval exercise will have a greater influence on improving most metabolic-related parameters than moderate-intensity concurrent interval exercise.
Material and methods
Participants
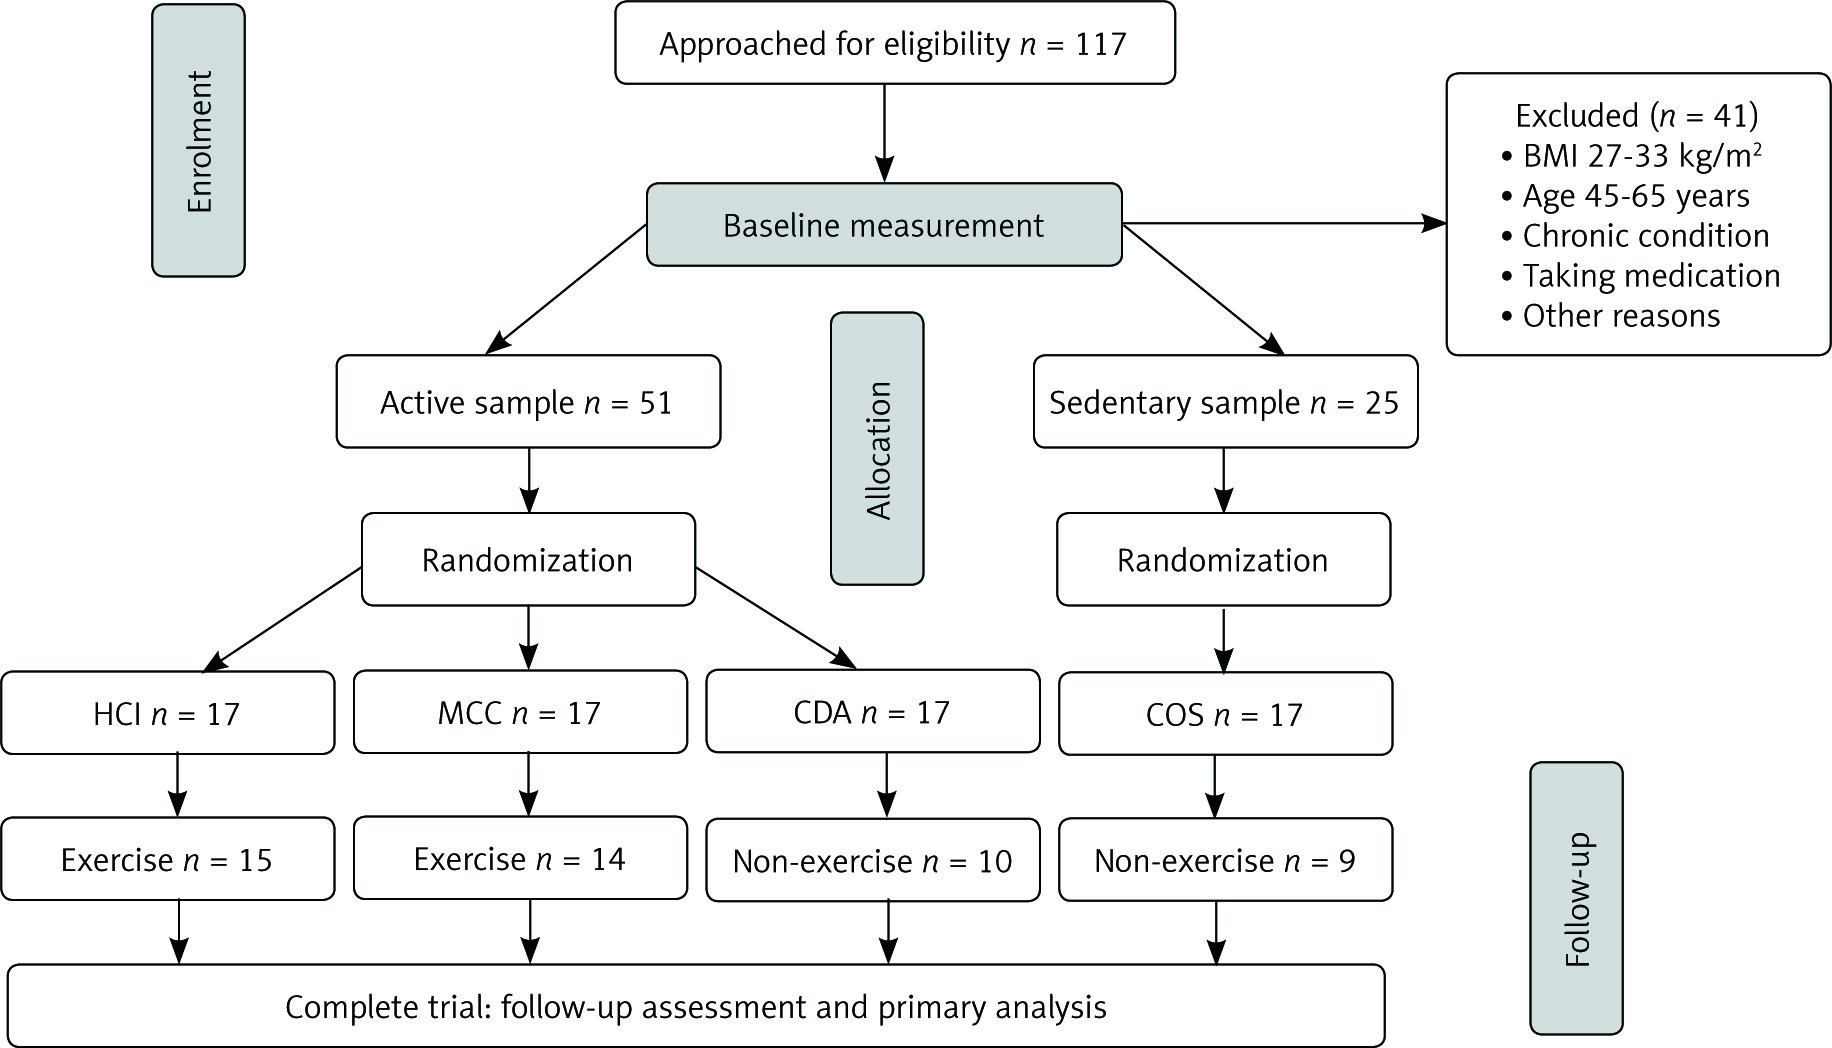
One hundred and seventeen postmenopausal participants within the ages of 45-65 years were recruited to the study via notices at Rasht area City Park and clubs. Being at least one year in menopausal stage and no alcohol or drug addiction were the criteria for women to be a part of the study. All participants were matched for age and body mass index (BMI; calculated as weight in kilograms divided by the height in meters squared). Subjects of the study signed written consent, filled out a medical questionnaire, and received a thorough description of the research methods before participation in the study.
Individual levels of physical activity were evaluated via the International Physical Activity Questionnaire (IPAQ). A detailed questionnaire was used to assess physical activity on which participants answered on a scale of 0 (none) to 10 (exercise > 1 hour four times/week). A random selection of samples was made according to the results and they were divided into four groups: a control sedentary group (< 5 on the scale) and three active groups (≥ 5 on the scale) [19]; high-intensity concurrent interval exercise (HCI; n = 15), moderate-intensity continuous concurrent exercise (MCC; n = 14), control daily active (CDA; n = 10), and control sedentary (COS; n = 9) were enlisted. Participants of the control sedentary group, although physically active, did not perform any resistance training or any other type of regular exercise for 6 months before the start of the study (Fig. 1). The study followed the Declaration of Helsinki, which was approved by the research committees of the Universities of Guilan, Rasht, Iran.
Research consideration
Participants’ physical activity and demographic backgrounds were determined through a series of interviews. Subsequent to gaining consent, four groups visited the clinical research center twice: at baseline, and post-test after 10 weeks. Participants’ physical activity and demographic backgrounds were determined through a series of interviews. As the next step, height (cm) and body weight (kg) measurements were carried out by calibrated devices in a standardized manner. Next, BMI was calculated using the equation body mass/height squared. Additionally, a fasting blood sample was collected, and participants performed a 24-hour food recall. Finally, HRmax measurements were carried out by a telemetric heart rate monitor (Polar Electro Oy, Kempele, Finland) and the Brzycki equation was used for the estimation of the one repetition maximum (1RM) [20]. At baseline and endpoint measurements were performed by physicians and exercise physiologists at the same time of day.
Concurrent exercise training protocol
The training interventions lasted for 10 weeks and the participants exercised three times per week for 50-65 min/session with a minimal interval of 48 hours between them. During the 2 weeks, both groups (HCI and MCC) performed three times resistance and endurance concurrent training (CT) sessions. Endurance and resistance training (RT) were not done on the same days and in the same session. The HCI (RT + HIIT) and MCC (RT + CT) groups received either the HIIT or CT and RT (moderate or high training) protocols as described above; all participants expended energy up to the 500-kcal goal (Table 1).
Resistance training program
The RT protocol was used to complete a resistance circuit containing specific exercises including (upper and lower muscle groups; nine exercises) leg press, chest press, lat pull-down, leg extension, leg curl, cable crossover, biceps curl, triceps extension, and abdominal crunches. The RT program was based on the recommendations of the American College of Sports Medicine (ACSM) for RT in healthy adults including 3-4 sets, 8-15 repetitions, 30-60 second rest interval between 2 sets, and 2-3 minute rest between exercises [21]. Total training time ranged from 35 to 45 minutes, based on the number of exercises assigned (Table 1). The study group’s warm-up and cool-down were performed prior to and after each session (both of 5-10 minutes duration, and consisting of walking and light, static stretching [avoiding muscle pain] in most muscle groups). In order to involve the major muscle groups, the RT procedure was followed, using a full range of motion that is considered an accurate method for the studies [21, 22]. To avoid potential risks, as a rule, the following activities were avoided: 1) events associated with Valsalva’s mechanism, 2) ballistic and plyometric movements, and 3) positions of extreme muscular tension.
Continuous aerobic training program
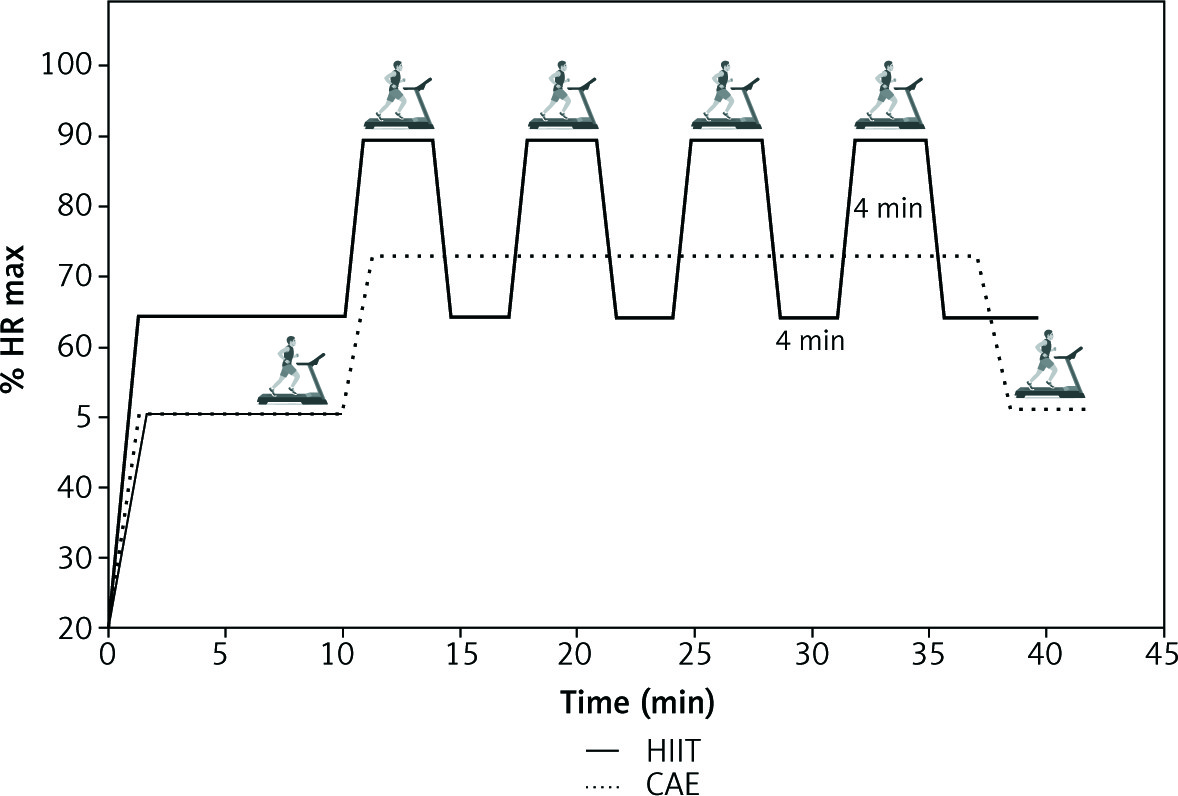
The continuous aerobic training (CAT) session included walking/running on a treadmill, a warm-up period of 5-10 minutes at 50% of HR max, followed by 45-50 minutes of walking/running at 60-75% of HR max. Participants then completed the workout with a cooling-off period of 5-10 minutes at 50% of HR max for a total duration of 45-55 minutes (Fig. 2).
High-intensity interval training
HIIT sessions began with 5-10 minutes of warm-up. Subsequently, participants were engaged in training sessions of 4 × 4 minutes intervals at 85-95% HR max (with the target zone maintained for at least 2 minutes) interspersed with a 4-minute recovery period at 65% HR max, concluding with a cool-down (5 minutes), with an overall training time ranging between 40 and50 minutes [22, 23] (Fig. 2).
Study subjects assigned to the control groups avoided any participation in circuit training sessions. They were requested to keep up with their routine exercises and diet throughout the study. Each training session was performed under the supervision of a researcher, to guide, aid, and to ensure the proper performance rate and load. All these sessions were carried out at Guilan Talent Discovery and Profession Athletic Center, Rasht, Iran.
Magnetic resonance imaging
Visceral adipose tissue (VAT), subcutaneous adipose tissue (SAT), and total abdominal fat volumes were measured by magnetic resonance imaging (MRI; premenopausal images: 1.5-T whole-body scanner, General Electric, Waukesha, WI; postmenopausal images: 1.5-T whole-body scanner, Philips Intera, Andover, MA). Slice thickness was 1 cm, with approximately 12-24 consecutive slices per scan. An automatic fat separation program was used for image analysis (Slice-O-Matic, Tomovision Inc., Montreal, Canada) [24]. A thorough description and model of the methods used for various tissues segmentation are shown in a different location [28]. Every image was analyzed twice with the subject’s name concealed from the operator to avoid any potential errors. A single researcher was held responsible for analyzing both pre- and post-test images. The range from the superior part of the head of the femur up to the inferior most part of the kidneys was set as the abdominal fat calculation area. The sum of overall fat contents of all slices was used to evaluate total belly fat. In order to calculate subcutaneous fat, the visceral fat value in each slice was subtracted from total fat.
Blood sampling
Blood samples (5 ml at each time) were retrieved from the left antecubital vein in both pre-training, following a 12-hour overnight fast, and post-training, following a 12-hour overnight fast and a 24-hour period of no exercise. For both groups, this procedure was performed at 7:30 A.M. by the laboratory practitioner with the subject in a sitting position.
Thereafter the samples remained at room temperature for clotting purposes for about half an hour. Next, the samples were centrifuged at 3000 rpm (1500 g) for 15 minutes, and plasma was removed and frozen at –80°C plasma levels of the irisin levels.
Serum irisin levels were measured by enzyme immunoassay (BioVendor, USA) following the user’s manual. Assay range: 0.001 µg/ml, 5 µg/ml. Irisin levels range in human plasma and serum from 0.2 µg/ml to > 2 µg/ml. Special kits, utilizing enzymatic colorimetric techniques, were used for glucose level measurements. The insulin serum level measurement was carried out via an enzyme-linked immunosorbent assay (ELISA) kit. The quantitative insulin sensitivity check index (QUICKI) was determined using the formula described by Katz et al. [25]:
QUICK = 1 / (log (fasting insulin µU/ml) + log (fasting glucose mg/dl))
Statistical analyses
The Shapiro-Wilk test was applied to test the data normality, and homogeneity of variance was examined using Levine’s test. ANOVA measures were used to compare data of the four groups, using the Bonferroni method to locate means that were significantly different. Additionally, comparisons were made of variances among four groups using the independent t-test at a different time of measurements. Spearman’s rank correlation test was used to test the relationship between insulin sensitivity, irisin level, weight loss and abdominal fat distribution. Data are expressed as mean ±SD; p-values below 0.05 were considered significant. Statistical analyses were performed using the software SPSS version 20.
Results
Pre-intervention subjects’ characteristics and changes over the intervention period
Forty-eight participants (age; 54.8 ±4.17 years, weight; 72.62 ±8.45 kg, BMI; 29.73 ±3.59 kg/m2 mean ±SD) completed the 10-week program without any problems. The subjects showed tolerance to both HCI and MCC, and all the exercise sessions ran smoothly without any interruptions due to health issues. Baseline and post-test characteristics of the study group are summarized in Table 2. No significant differences were noted in any demographic parameter between the four groups at pre-test.
Table 2
Baseline and post-training anthropometric factors, clinical characteristics and abdominal fat of subjects who under went study
| Group \ Variable | HCI (n = 15) | MCC (n = 14) | CDA (n = 10) | COS (n = 9) | ||||
|---|---|---|---|---|---|---|---|---|
| Pre | Post | Pre | Post | Pre | Post | Pre | Post | |
| Age, years | 4.13±57.11 | – | 54.10 ±5.08 | – | 54.10 ±5.08 | – | 56.66 ±3.92 | – |
| Weight, kg | 70.32 ±6.49 | 67.38 ±5.87** | 74.45 ±6.17 | 72.65 ±6.67** | 72.45 ±12.36 | 74.39 ±11.7 | 73.34 ±9.66 | 72.88 ±10.88 |
| BMI, kg/m2 | 28.31 ±2.20 | 27.00 ±1.80** | 30.62 ±3.08 | 30.02 ±3.83* | 29.92 ±4.15 | 29.77 ±3.83 | 30.48 ±5.15 | 30.36 ±5.27 |
| WHR | 0.91 ±0.04 | 0.89 ±0.02** | 0.03±0.92 | 0.91 ±0.03* | 0.91 ±0.02 | 0.91 ±0.03 | 0.93 ±0.02 | 0.93 ±0.02a |
| Glucose, mg/dl | 97.00 ±7.24 | 92.73 ±5.93 | 94.14 ±7.89 | 93.21 ±8.18 | 93.60 ±9.89 | 93.00 ±7.55 | 99.66 ±10.12 | 102.33 ±10.28a |
| QUICKI | 0.35 ±0.02 | 0.37 ±0.02* | 0.35 ±0.02* | 0.36 ±0.02 | 0.36 ±0.02 | 0.35 ±0.02 | 0.34 ±0.02 | 0.34 ±0.02 |
| Irisin, µg/ml | 1.33 ±0.36 | 2.20 ±0.42** | 1.30 ±0.28 | 1.56 ±0.51a | 1.35 ±0.42 | 1.34 ±0.40a | 1.38 ±0.45 | 1.26 ±0.41a |
| Subcutaneous abdominal fat, cm2 | 97.13 ±21.75 | 93.25 ±20.87** | 102.43 ±21.75 | 101.22 ±21.62* | 99.44 ±16.33 | 99.37 ±16.46 | 108.6 ±31.58 | 108.68 ±32.43 |
| Visceral abdominal fat, cm2 | 11.05 ±2.74 | 10.14 ±2.62** | 11.90 ±3.05 | 11.68 ±2.88 | 11.75 ±1.89 | 11.93 ±1.84 | 12.31 ±4.02 | 12.62 ±4.10 |
| Total abdominal fat, cm2 | 105.51 ±24.32 | 94.66 ±19.59** | 115.62 ±24.78 | 110.89 ±20.95 | 111.20 ±17.98 | 111.30 ±18.03 | 120.20 ±35.59 | 121.30 ±36.34 |
All data are presented as means ±standard deviations; HCI – high-intensity concurrent interval exercise, MCC – moderate-intensity continuous concurrent exercise, CDA – control daily active, COD – control sedentary, BMI – body mass index, WHR – waist-to-hip ratio, QUICKI – quantitative insulin sensitivity check index,
Baseline changes in circulating irisin over the intervention period
Mean baseline irisin concentration was 1.33 ±0.36 µg/ml for HCI, 1.28 ±0.29 µg/ml for MCC, 1.35 ±0.42 µg/ml for COD, and 1.38 ±0.45 µg/ml for COS, with no differences between groups (p = 0.61), as shown in Table 2. Individual changes in plasma irisin concentration illustrate the analysis of changes in parameters for the HCI or MCC cohorts [2]. Plasma irisin significantly increases by 2.20 ±0.42 µg/ml (p< 0.001) following HCI training but remains unchanged after MCC training.
Quantitative insulin-sensitivity check index
The mean baseline insulin sensitivity QUICKI concentration did not differ significantly between different groups (p = 0.80). Two-way mixed ANOVA and Bonferroni follow-up test demonstrated a significant increase from pre- to post-exercise for HCI (4.71%, p< 0.05) and MCC (3.83%, p< 0.05), as shown in Table 2. There was no significant difference in the control groups’ insulin sensitivity level (p > 0.05).
Abdominal fat distribution (visceral vs. subcutaneous) and total abdominal fat
Inter-group changes indicated that subcutaneous abdominal fat was significantly decreased in HCI and MCC groups (3.99%; p < 0.001 and 1.18%; p = 0.011, respectively). There was no significant difference in the control groups’ subcutaneous abdominal fat (p > 0.05). The inter-group evaluation showed a significant reduction for visceral and total abdominal fat in the HCI group (8.27%, 10.27%; p < 0.001, respectively), as shown in Table 2. It should also be noted that there was no significant difference between the MCC, COS and CDA groups in visceral and total abdominal fat.
Discussion
The results of the present study suggest that postmenopausal active women can improve most of the metabolic health-related parameters by concurrently undergoing HIIT and RT. Moreover, the extent of the improvements achieved seems to be affected by volume and/or intensity of the endurance training because different gains were observed for the RT + CT (MCC) and RT + HIIT (HCI) groups.
To our knowledge, this study is the first of its kind to make a comparison between the influences of HCI, MCC, along with two control groups in a 10-week training period, on serum irisin level, insulin sensitivity status and abdominal fat in postmenopausal women.
The new findings of the current study include promising effects that HCI promoted increased plasma levels of irisin, and decreased visceral, subcutaneous and total abdominal fat. Additionally, the increased QUICKI decreased with a positive change in body fat, visceral abdominal fat compared to the MCC group.
One must acknowledge that various concurrent training protocols have been examined in this study. Endurance and RT do not have to be executed on the same day and in the same session. The relative improvement in blood irisin observed in the HCL group could be partially due to the training sequence. However, not all studies report considerable changes[12, 26, 27] or decline[28, 29] in baseline irisin concentrations, whereas studies on older subjects presented mixed results[16, 28]. Some studies suggest that the release of irisin as a myokine into the circulation during training may be an endocrine function of the body to control metabolism. Numerous studies have demonstrated that exercise drives irisin secretion in the skeletal muscle that leads to the expression of FNDC5 protein, thus elevating the irisin formation levels[30]. Once in circulation, this myokine transforms white adipose tissue (WAT) into brite (brown in white)/beige fat cells by upregulating the genes responsible for changing with browning (such as uncoupling protein – UCP-1, peroxisome proliferator-activated receptor γ – PPARγ, and PR domain containing 16 – PRDM16) [31]. Once converted from white to brown, adipose tissue takes on the function of dispersing heat energy, while white adipose tissue is responsible for storing energy. This event, in turn, causes an increase in total body energy expenditure[32].
Therefore, a rise in irisin and FNDC5 levels in response to HCL would be rational as it is largely characterized by heightened oxidative capacity and mitochondrial functions. Such influences of irisin are probably facilitated by pathways associated with phosphorylation of p38 mitogen-activated protein kinase (p38 MAPK) and extracellular signal-regulated kinase (ERK) [33]. An increase in energy expenditure and glucose homeostasis is a good reflection of irisin’s role in metabolism [6].
The transformed beige adipocytes are specific for heat generation and energy expenditure due to their rich mitochondrial UCP-1 content [34]. Irisin upregulates lipolysis related genes, such as hormone-sensitive lipase (HSL), adipose triglyceride lipase (ATGL), and fatty acid binding protein 4 (FABP4), ultimately increasing glycerol release and reducing lipid accumulation in adipocytes. Furthermore, the glucose uptake capacity of beige fat cells is also boosted as their glucose transporter type 4 (GLUT4) expression increases.
Taken together, our findings support the hypothesis that insulin sensitivity of peripheral tissues could be more closely linked to irisin values, specifically in striated muscles. This is a difference that can be detected even in basal conditions, independently of physical activity. Irisin, as a myokine secreted by striated muscles, has been known to shift glucose for energy expenditure in muscles to maintain glucose homeostasis. Moreover, insulin resistance associated with aging has also been linked to abdominal obesity [35] and Rice et al. [36] suggested that improved insulin sensitivity observed after resistance exercises may decrease visceral and abdominal subcutaneous adipose tissue or abdominal obesity. In the present study, HCI led to reductions in both abdominal fat distribution (visceral vs. subcutaneous) and total abdominal adipose tissue (Table 2). Thus, it can be said that equipped with such extraordinary properties, irisin perhaps is a strong likely candidate to be used against obesity and likewise other metabolic conditions.
A limitation of the present study which should be noted is the small sample size in control and experimental groups at the end of the experiment. Therefore, further studies with a large sample size are needed to clarify the relationship between irisin and insulin resistance in postmenopausal women.
One of the most significant steps in any future investigation is to determine whether irisin has a receptor for characterizing its mode of action. This would aid us in our understanding of irisin’s functions as well as the cascading signals involved in its effect. Likewise, it is important to provide a clear explanation of the mechanism of how muscle tissue secretes irisin during exercise. Such information will be crucial in explaining what distinguishes the effects of acute and chronic training on irisin blood levels, and to discover whether there are other stimulants of irisin release.
Conclusions
According to the results, the HCI results in an increased irisin level and decreased visceral abdominal fat. Also, the insulin sensitivity status was significantly increased, and subcutaneous abdominal fat significantly decreased in the MCC group. In contrast, the MCC did not produce a significant effect on irisin level, and decreased visceral and total abdominal fat.
Finally, we hypothesized that active participants in the HIC group would experience a greater response to irisin circulation, in addition to visceral, subcutaneous, and total abdominal fat and QUICKI after 10 weeks, compared to the MCC group. This may be of great significance when it comes to designing an optimal training program for women experiencing menopause.