Summary
Optical coherence tomography (OCT)-derived fractional flow reserve (FFR) (virtual flow reserve) promises combined anatomical and physiological lesion assessment from a single intracoronary acquisition, but its real-world reliability – and its dependence on operator review of lumen contours and side-branch recognition – has not been well characterized. In 14 patients (19 vessels), operator-reviewed FFR-OCT correlated moderately with wire-based FFR (r = 0.614), yet manual correction substantially changed the automated value (0.68 to 0.75; p = 0.016) and ischemia classification was discordant in approximately one-fifth of vessels near the 0.80 threshold. These findings indicate that current FFR-OCT is not yet interchangeable with pressure-wire physiology for revascularization decisions and still requires expert operator supervision. FFR-OCT may nonetheless aid procedural planning and optimization, and larger prospective studies with prespecified, blinded image analysis are warranted to define its clinical role.
Introduction
Wire-based fractional flow reserve (FFR) remains the clinical standard for qualifying stable coronary stenoses for intervention, with a value of 0.80 or lower indicating ischemia [1, 2]. However, alternative methods for assessing lesion significance continue to be developed [3]. Following the angiography-based quantitative flow ratio (QFR) [4, 5] and computed tomography-based FFR (FFR-CT) [6], an optical coherence tomography-based FFR (FFR-OCT), computed as virtual flow reserve [7–9], was introduced. Like the preceding methods, it does not require pharmacological hyperemia. Unlike the angiography- and CT-based methods, FFR-OCT is derived from intracoronary imaging, so a single OCT acquisition can yield plaque morphology, vessel dimensions for procedural planning, and a physiological estimate together, without an additional pressure wire [10]. This modality derives physiology from vessel lumen geometry, modeling pressure loss along the reconstructed lumen to simulate flow reduction under hypothetical hyperemic conditions and thereby estimate the significance of a narrowing [7–9].
Accurate lumen reconstruction is therefore essential, but it can be distorted by residual blood in the vessel [11, 12]. In addition, side branches must be correctly identified, as bifurcations account for natural, non-lesion loss of the lumen area [13]. The reliability of automated FFR-OCT in routine practice – and the extent to which it depends on manual review of these features – has not been well characterized.
Aim
We therefore report our initial single-center experience with FFR-OCT using Ultreon 3.0 software, focusing on its agreement with wire-based FFR and the effect of operator correction.
Material and methods
This was a single-center, retrospective study conducted at a high-volume tertiary center. We included all consecutive patients who underwent clinically indicated wire-based FFR assessment and OCT-guided percutaneous coronary intervention (PCI) within the same procedure between January 2024 and November 2024 and in whom an FFR-OCT value could be obtained. Inclusion criteria were presentation with chronic coronary syndrome, age under 80 years, and wire-based FFR and OCT performed during the same procedure. Vessels with OCT image quality precluding reliable analysis were excluded. Finally, a total of 14 patients (19 vessels) were analyzed. The original OCT pullbacks were retrospectively reprocessed with Ultreon 3.0 software in May–June 2026, after the software became available in Poland.
FFR was measured with a PressureWire X guidewire (Abbott) according to the local protocol. After intracoronary nitroglycerin, the pressure sensor was equalized to the guide-catheter pressure at the ostium and advanced at least 20 mm distal to the lesion. Hyperemia was induced with escalating intracoronary adenosine boluses up to a maximal dose of 600 μg until significant ischemia or full hyperemia was reached. FFR was recorded as the lowest mean distal-to-aortic pressure ratio, and sensor drift was verified on pullback (acceptable drift ≤ 0.02). An FFR ≤ 0.80 defined ischemia.
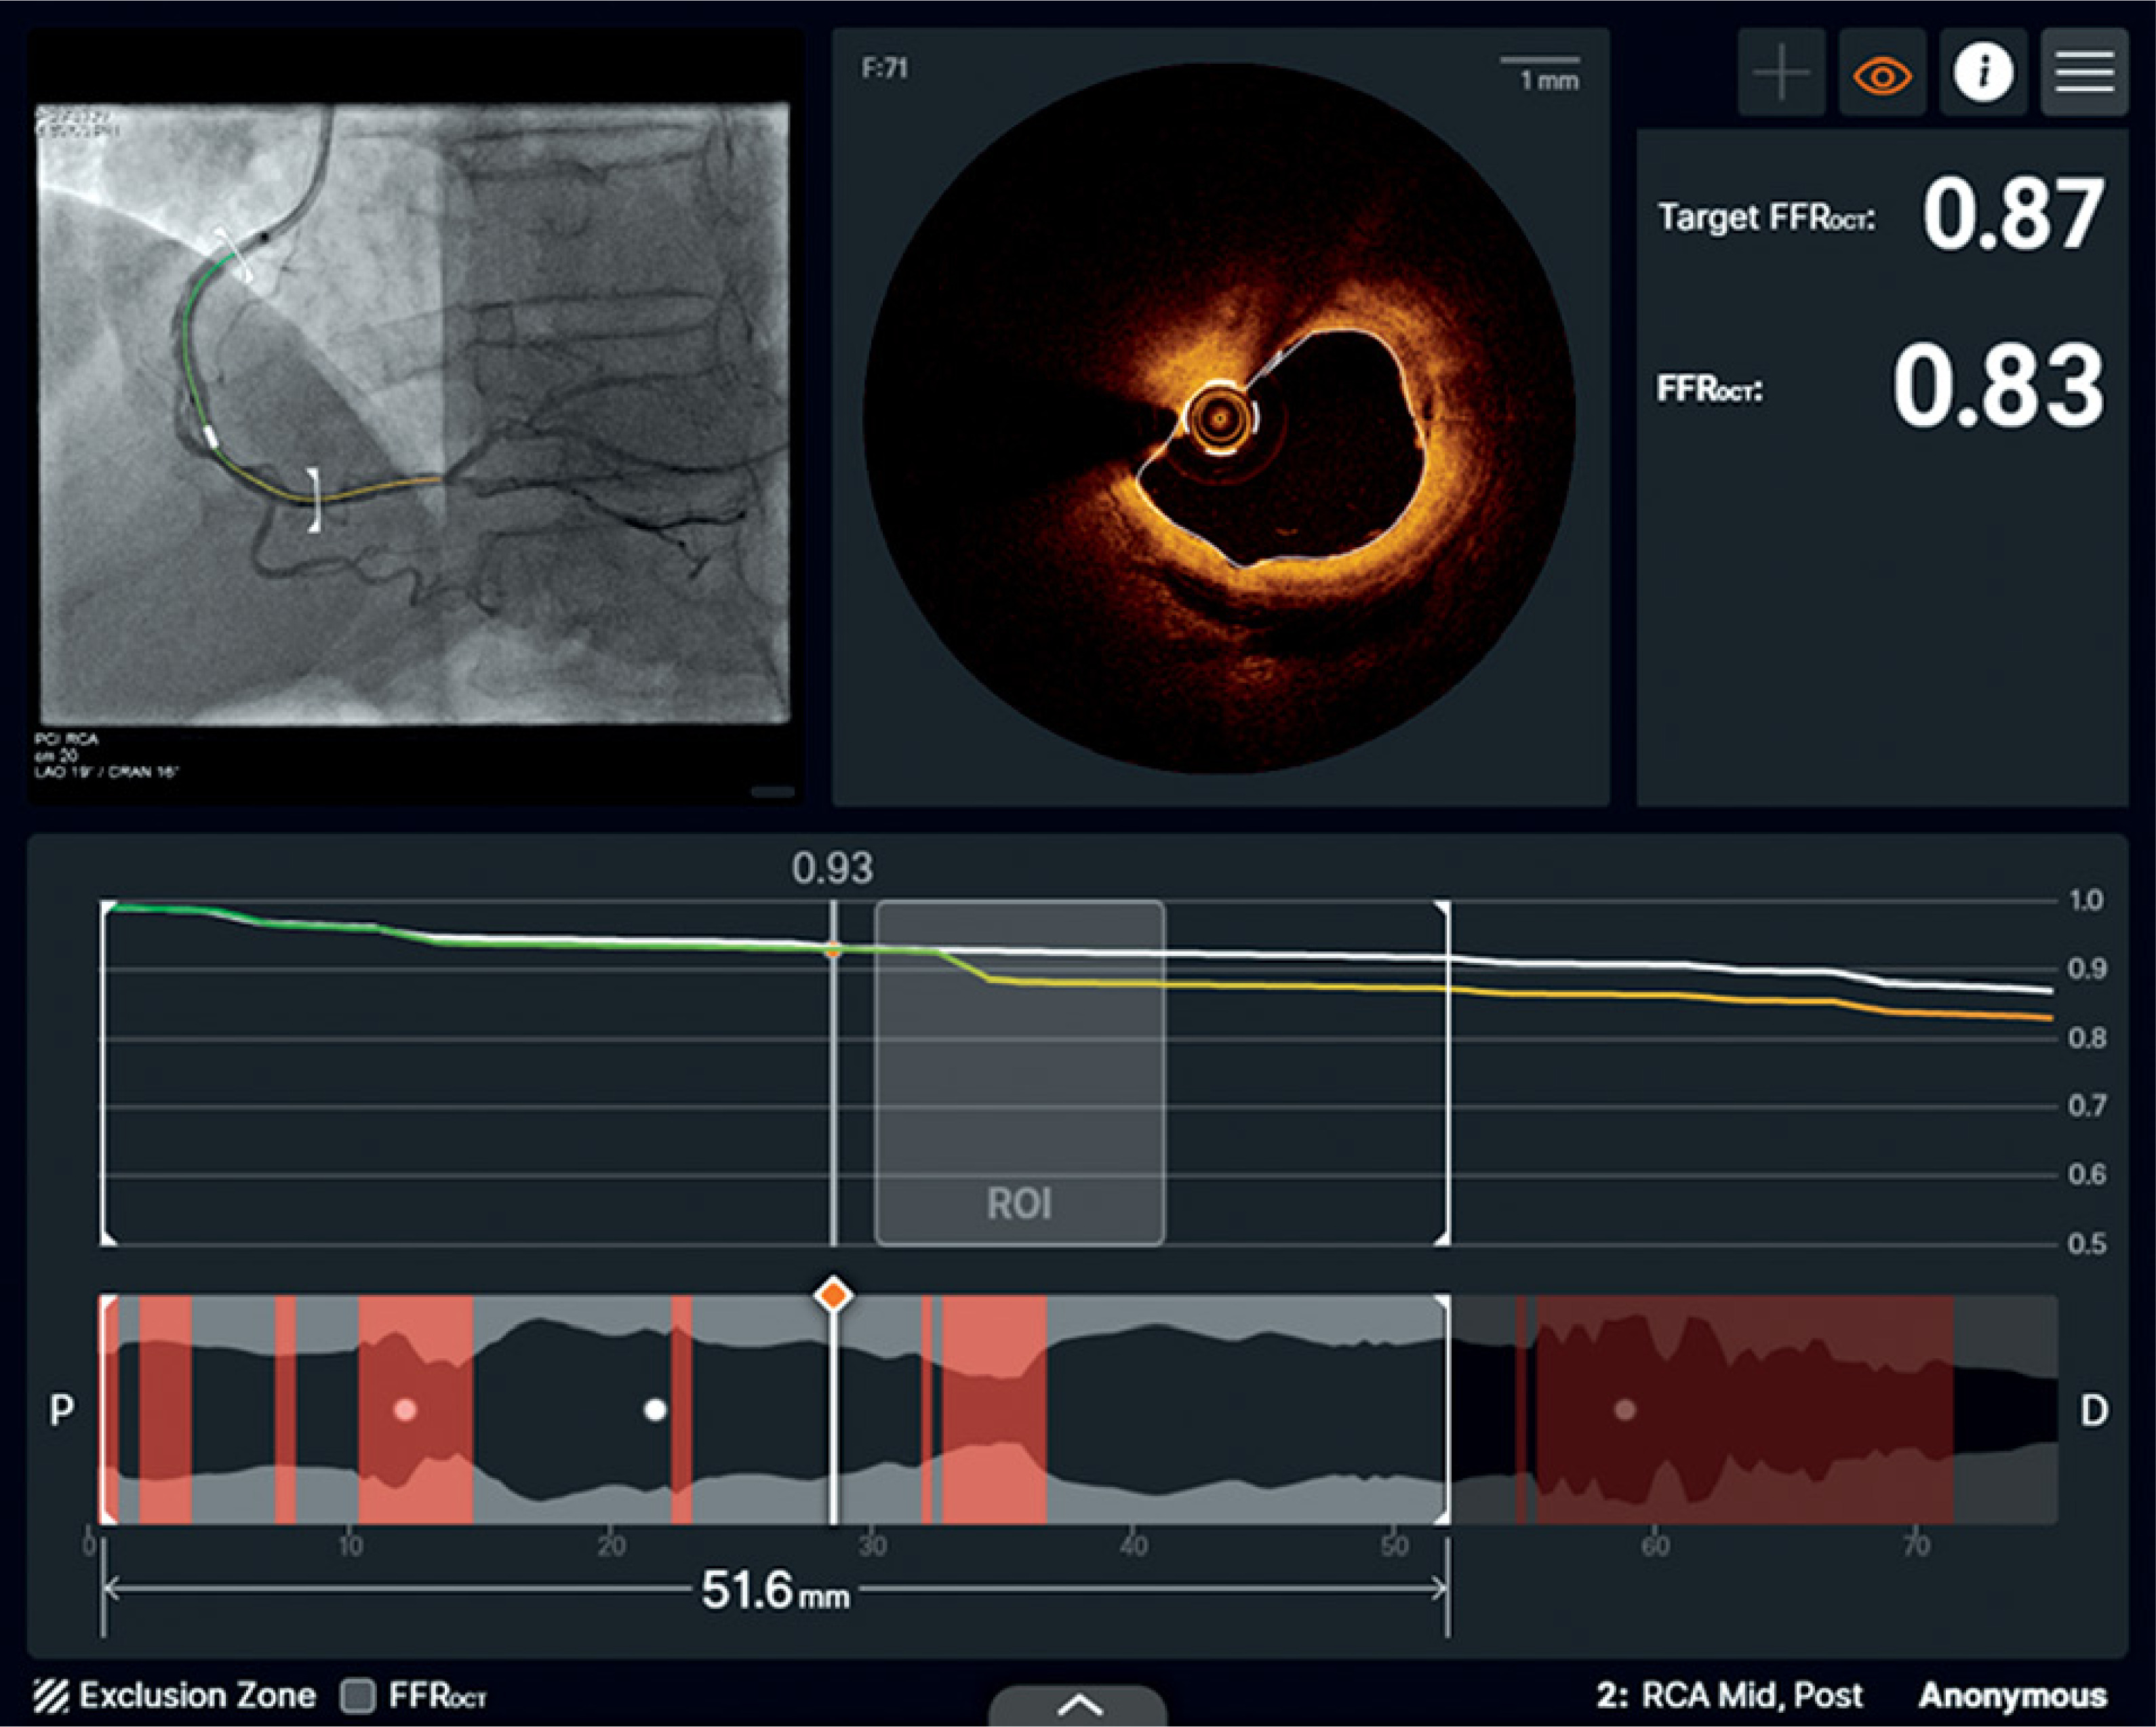
OCT was performed with the Dragonfly OpStar imaging catheter (Abbott) on the Ultreon platform, using a non-occlusive contrast flush of 10–20 ml per pullback. Pullbacks were processed with Ultreon 3.0 software (Abbott) to generate automated FFR-OCT values across the imaged segment. A senior interventional cardiologist experienced in OCT then reviewed each pullback and, where required, manually corrected lumen contours and side-branch recognition; the corrected value defined operator-reviewed FFR-OCT. The FFR-OCT value was taken at the distal segment corresponding to the wire-based FFR sensor position (Figure 1). The reviewing operator was blinded to the wire-based FFR result.
Figure 1
Representative example of OCT-derived fractional flow reserve (FFR) (virtual flow reserve) assessment using Ultreon 3.0 software in the right coronary artery. Top left: angiographic co-registration of the OCT pullback. Top center: OCT cross-section at the selected location. Top right: the calculated physiological output. Bottom: the FFR-OCT pullback profile (longitudinal Pd/Pa trace) with the longitudinal vessel reconstruction and the selected region of interest. In this example, FFR-OCT was 0.83 and the software-generated target FFR-OCT was 0.87
FFR-OCT – optical coherence tomography–derived FFR (virtual flow reserve).
Statistical analysis
Categorical variables are presented as counts (percentages) and continuous variables as mean ± standard deviation (SD) or median (interquartile range [IQR]), according to their distribution assessed using the Shapiro-Wilk test. Agreement between operator-reviewed FFR-OCT and wire-based FFR was assessed using Pearson’s correlation coefficient, Bland-Altman analysis (mean bias and 95% limits of agreement), and concordance of ischemia classification at the ≤ 0.80 threshold, expressed as overall agreement and Cohen’s κ. Automated and operator-reviewed FFR-OCT were compared using the Wilcoxon signed-rank test, as the paired differences were non-normally distributed. Exact Clopper-Pearson 95% confidence intervals were calculated for proportions. Because some patients contributed more than one vessel, all vessel-level analyses were considered exploratory and did not account for within-patient clustering. All tests were two-sided, and a p-value < 0.05 was considered statistically significant. Analyses and figures were generated in Python (version 3.13.5) using pandas (2.2.3), NumPy (2.3.5), SciPy (1.17.0), and Matplotlib (3.10.8).
Results
Fourteen patients contributing 19 vessels were analyzed. Most patients were male (13/14, 92.9%). The most frequent cardiovascular risk factors were current or former smoking (10/14, 71.4%; current 5/14, 35.7%; former 5/14, 35.7%), hypercholesterolemia (9/14, 64.3%), and hypertension (6/14, 42.9%). A history of prior myocardial infarction was present in 7 patients (50.0%). The left anterior descending artery was the most frequently assessed vessel (10/19, 52.6%), followed by the circumflex territory including marginal branches (5/19, 26.3%) and the right coronary artery (4/19, 21.1%). Baseline characteristics are shown in Table I.
Table I
Patient characteristics (n = 14)
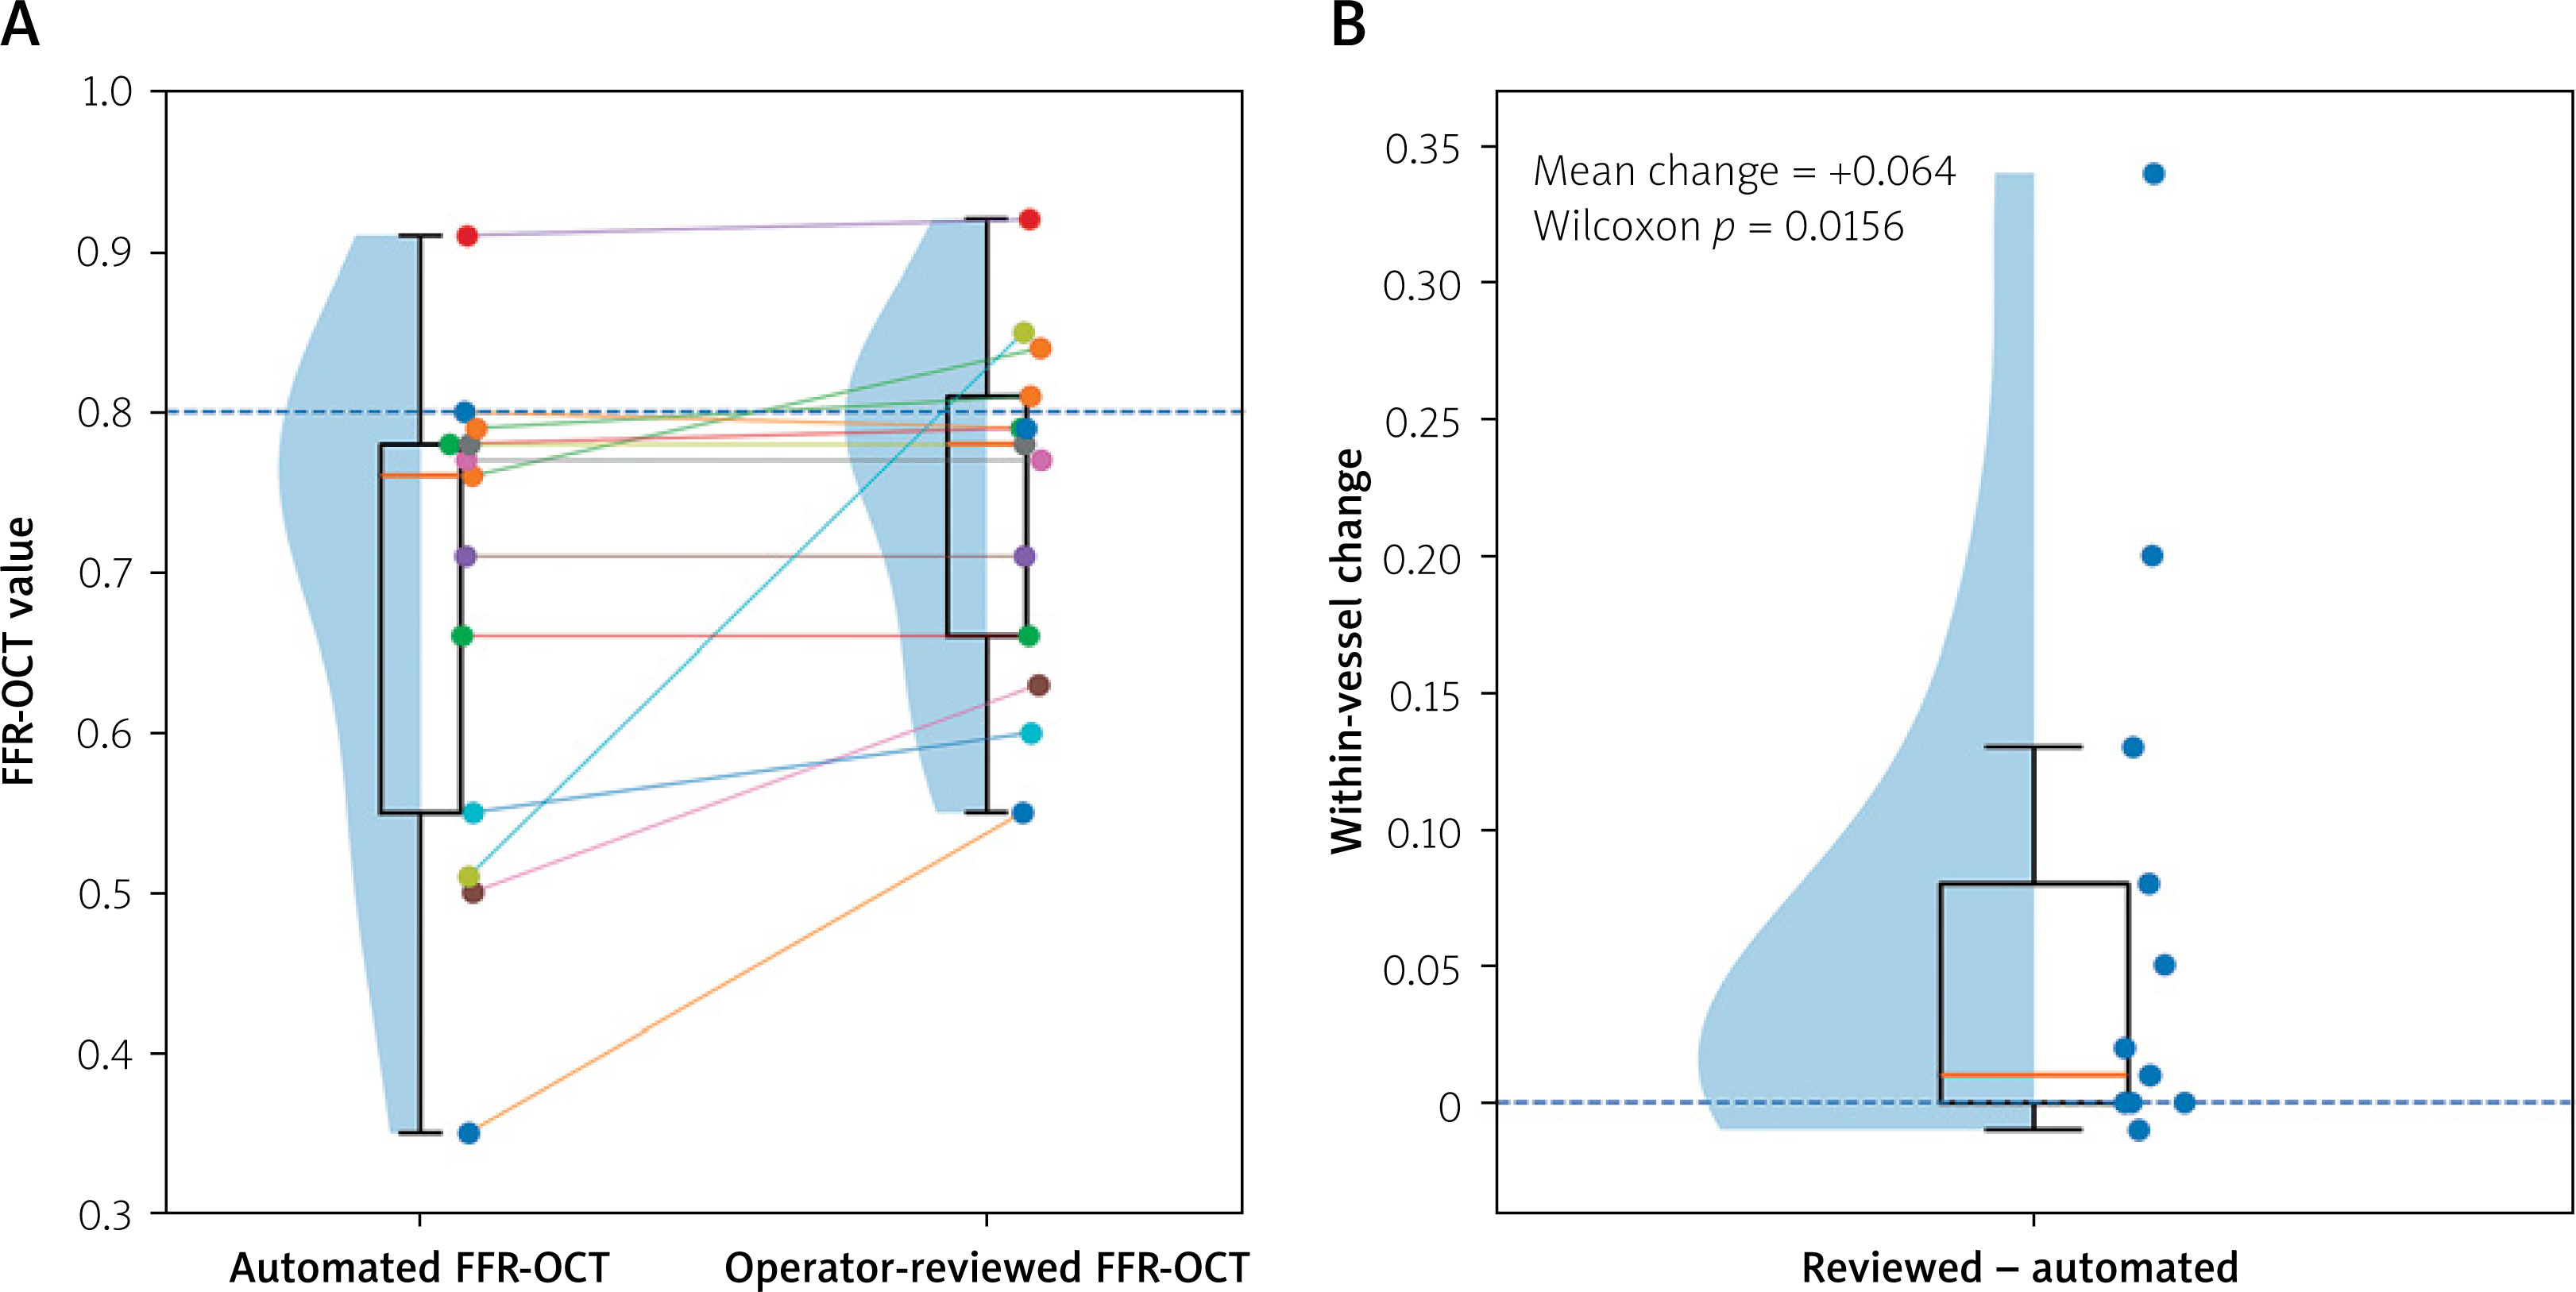
Manual editing of lumen contours was required in 15 of 19 vessels and addition or removal of side branches in 3 of 19. In the 13 vessels with both automated and operator-reviewed FFR-OCT available, automated FFR-OCT was 0.68 ±0.16 and increased to 0.75 ±0.11 after operator review (mean paired difference +0.064; Wilcoxon signed-rank p = 0.016). Manual correction changed ischemia classification at the ≤ 0.80 threshold in 3 of these 13 vessels (23.1%). The median analysis and correction time was 10 min (Figure 2).
Figure 2
Effect of manual correction (side-branch recognition and lumen delineation) on FFR-OCT (19 vessels). A – Paired comparison of automated and operator-reviewed FFR-OCT. B – Distribution of the within-vessel change (operator-reviewed FFR-OCT – automated). Abbreviations: as in Figure 1
Wire-based FFR was 0.79 ±0.10. Operator-reviewed FFR-OCT showed a moderate correlation with wire-based FFR (Pearson r = 0.614, 95% CI: 0.222–0.835; p = 0.005; Figure 3). On Bland-Altman analysis, the mean bias (wire-based FFR − operator-reviewed FFR-OCT) was +0.025, with 95% limits of agreement from –0.153 to +0.203 (Figure 4). Ischemia classification at the ≤ 0.80 threshold was concordant in 15 of 19 vessels (78.9%; Cohen’s κ = 0.568), while discordance occurred in 4 vessels (21.1%, 95% CI: 6.1–45.6%). All four discordant vessels were FFR-OCT–positive and wire-based FFR–negative; no vessel was FFR-OCT–negative and wire-based FFR–positive. Wire-based FFR in the discordant vessels was 0.84, 0.84, 0.90, and 0.91 (Table II).
Figure 3
Correlation between wire-based FFR and operator-reviewed FFR-OCT (n = 19). The solid line represents the linear regression, the shaded area indicates the 95% confidence band, and the dashed line represents the line of identity. Pearson’s r = 0.614 (95% CI: 0.222–0.835; p = 0.005). Abbreviations: as in Figure 1
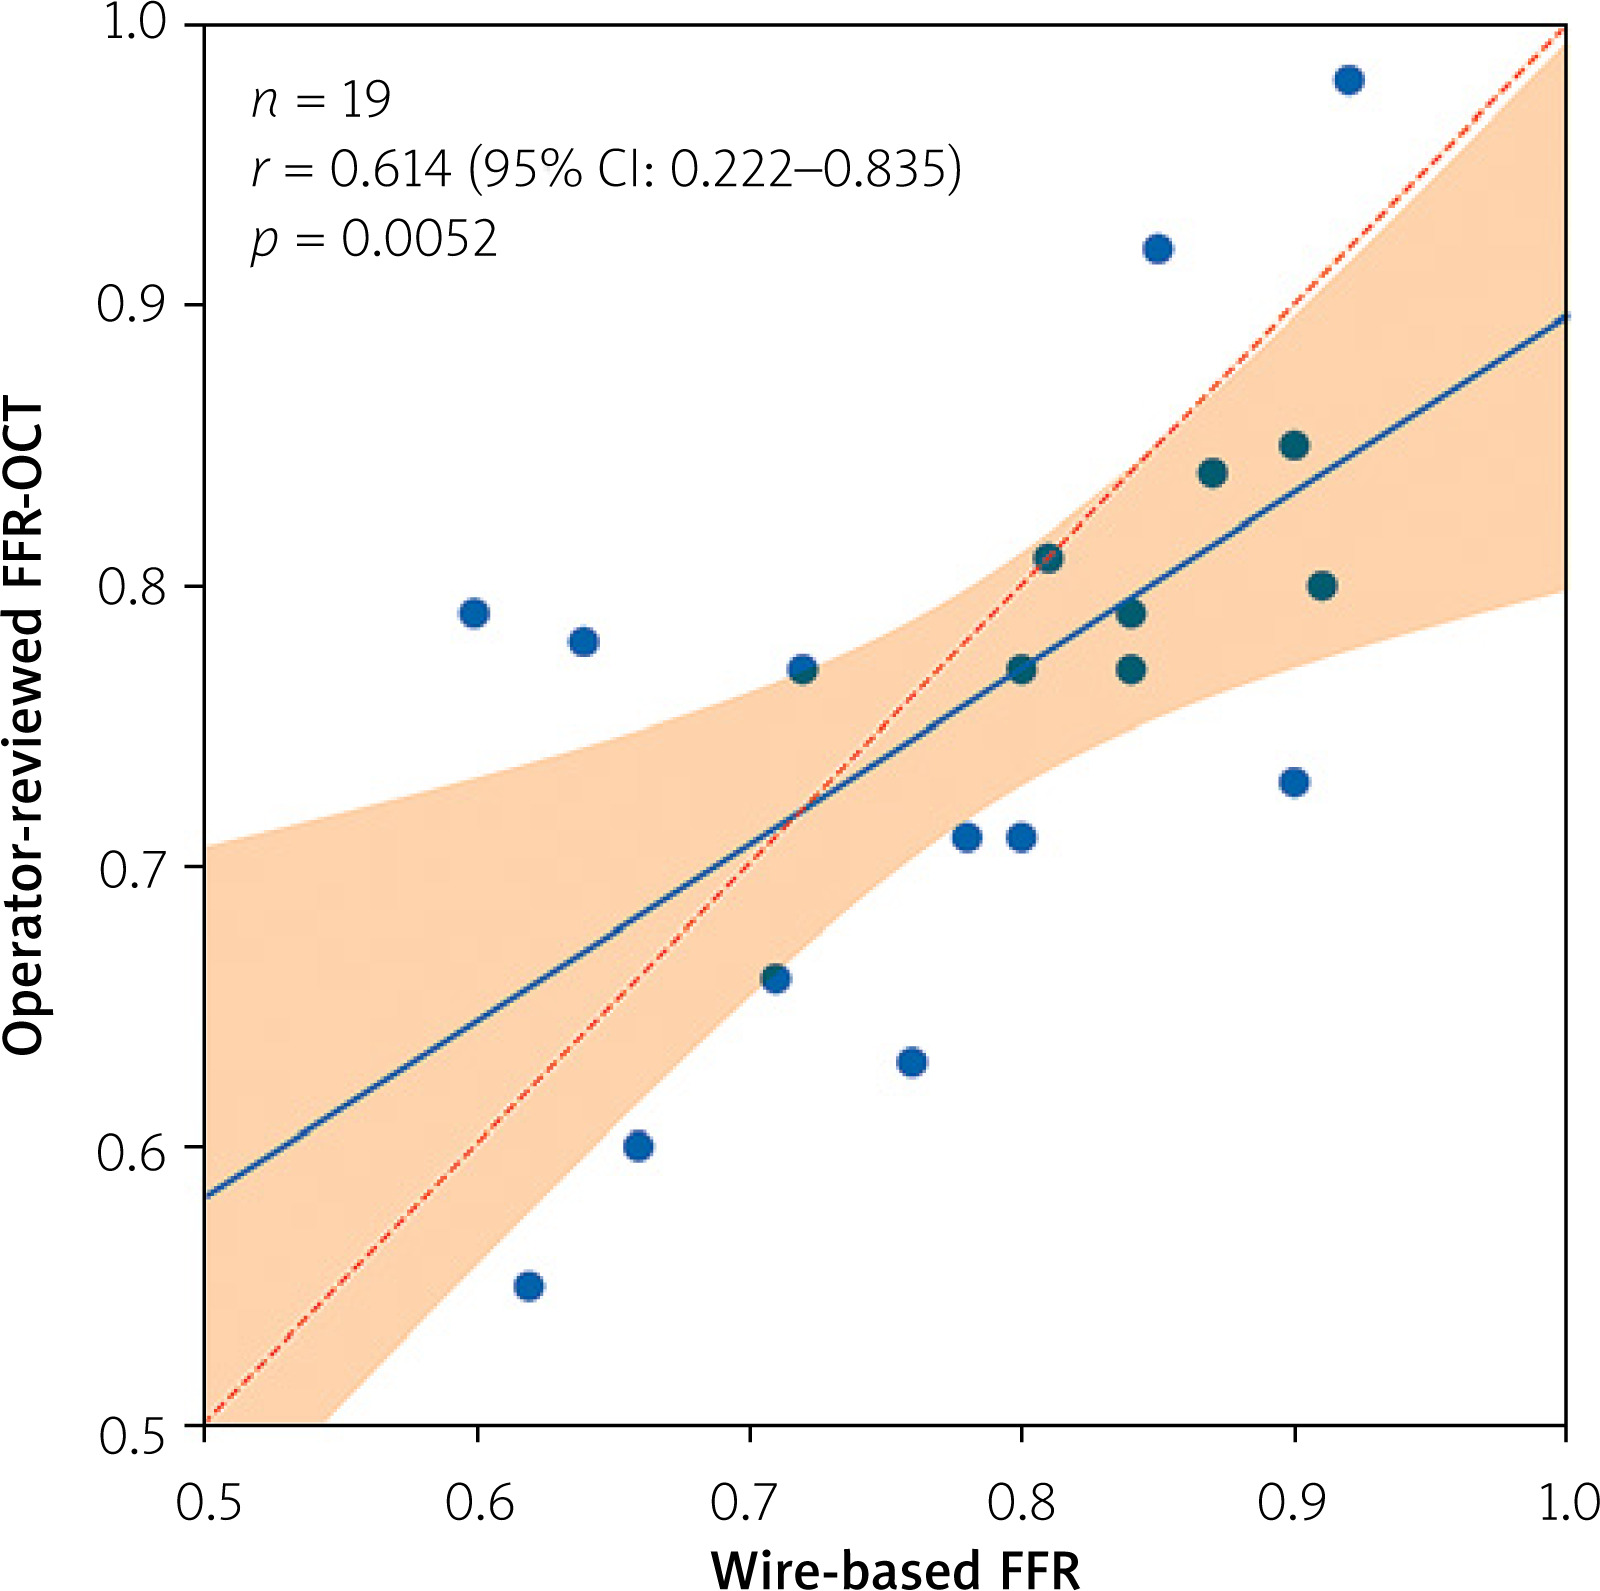
Figure 4
Agreement between wire-based FFR and operator-reviewed FFR-OCT (n = 19). A – Paired comparison of wire-based FFR and operator-reviewed FFR-OCT, showing individual vessel-level values, paired connections, box plots, and distribution density. The dashed horizontal line indicates the ≤ 0.80 ischemia threshold. B – Bland-Altman plot of the difference between wire-based FFR and operator-reviewed FFR-OCT against the mean of the two measurements. The solid horizontal line indicates the mean bias (+0.025), and the dashed horizontal lines indicate the 95% limits of agreement (−0.153 to +0.203). Abbreviations: as in Figure 1
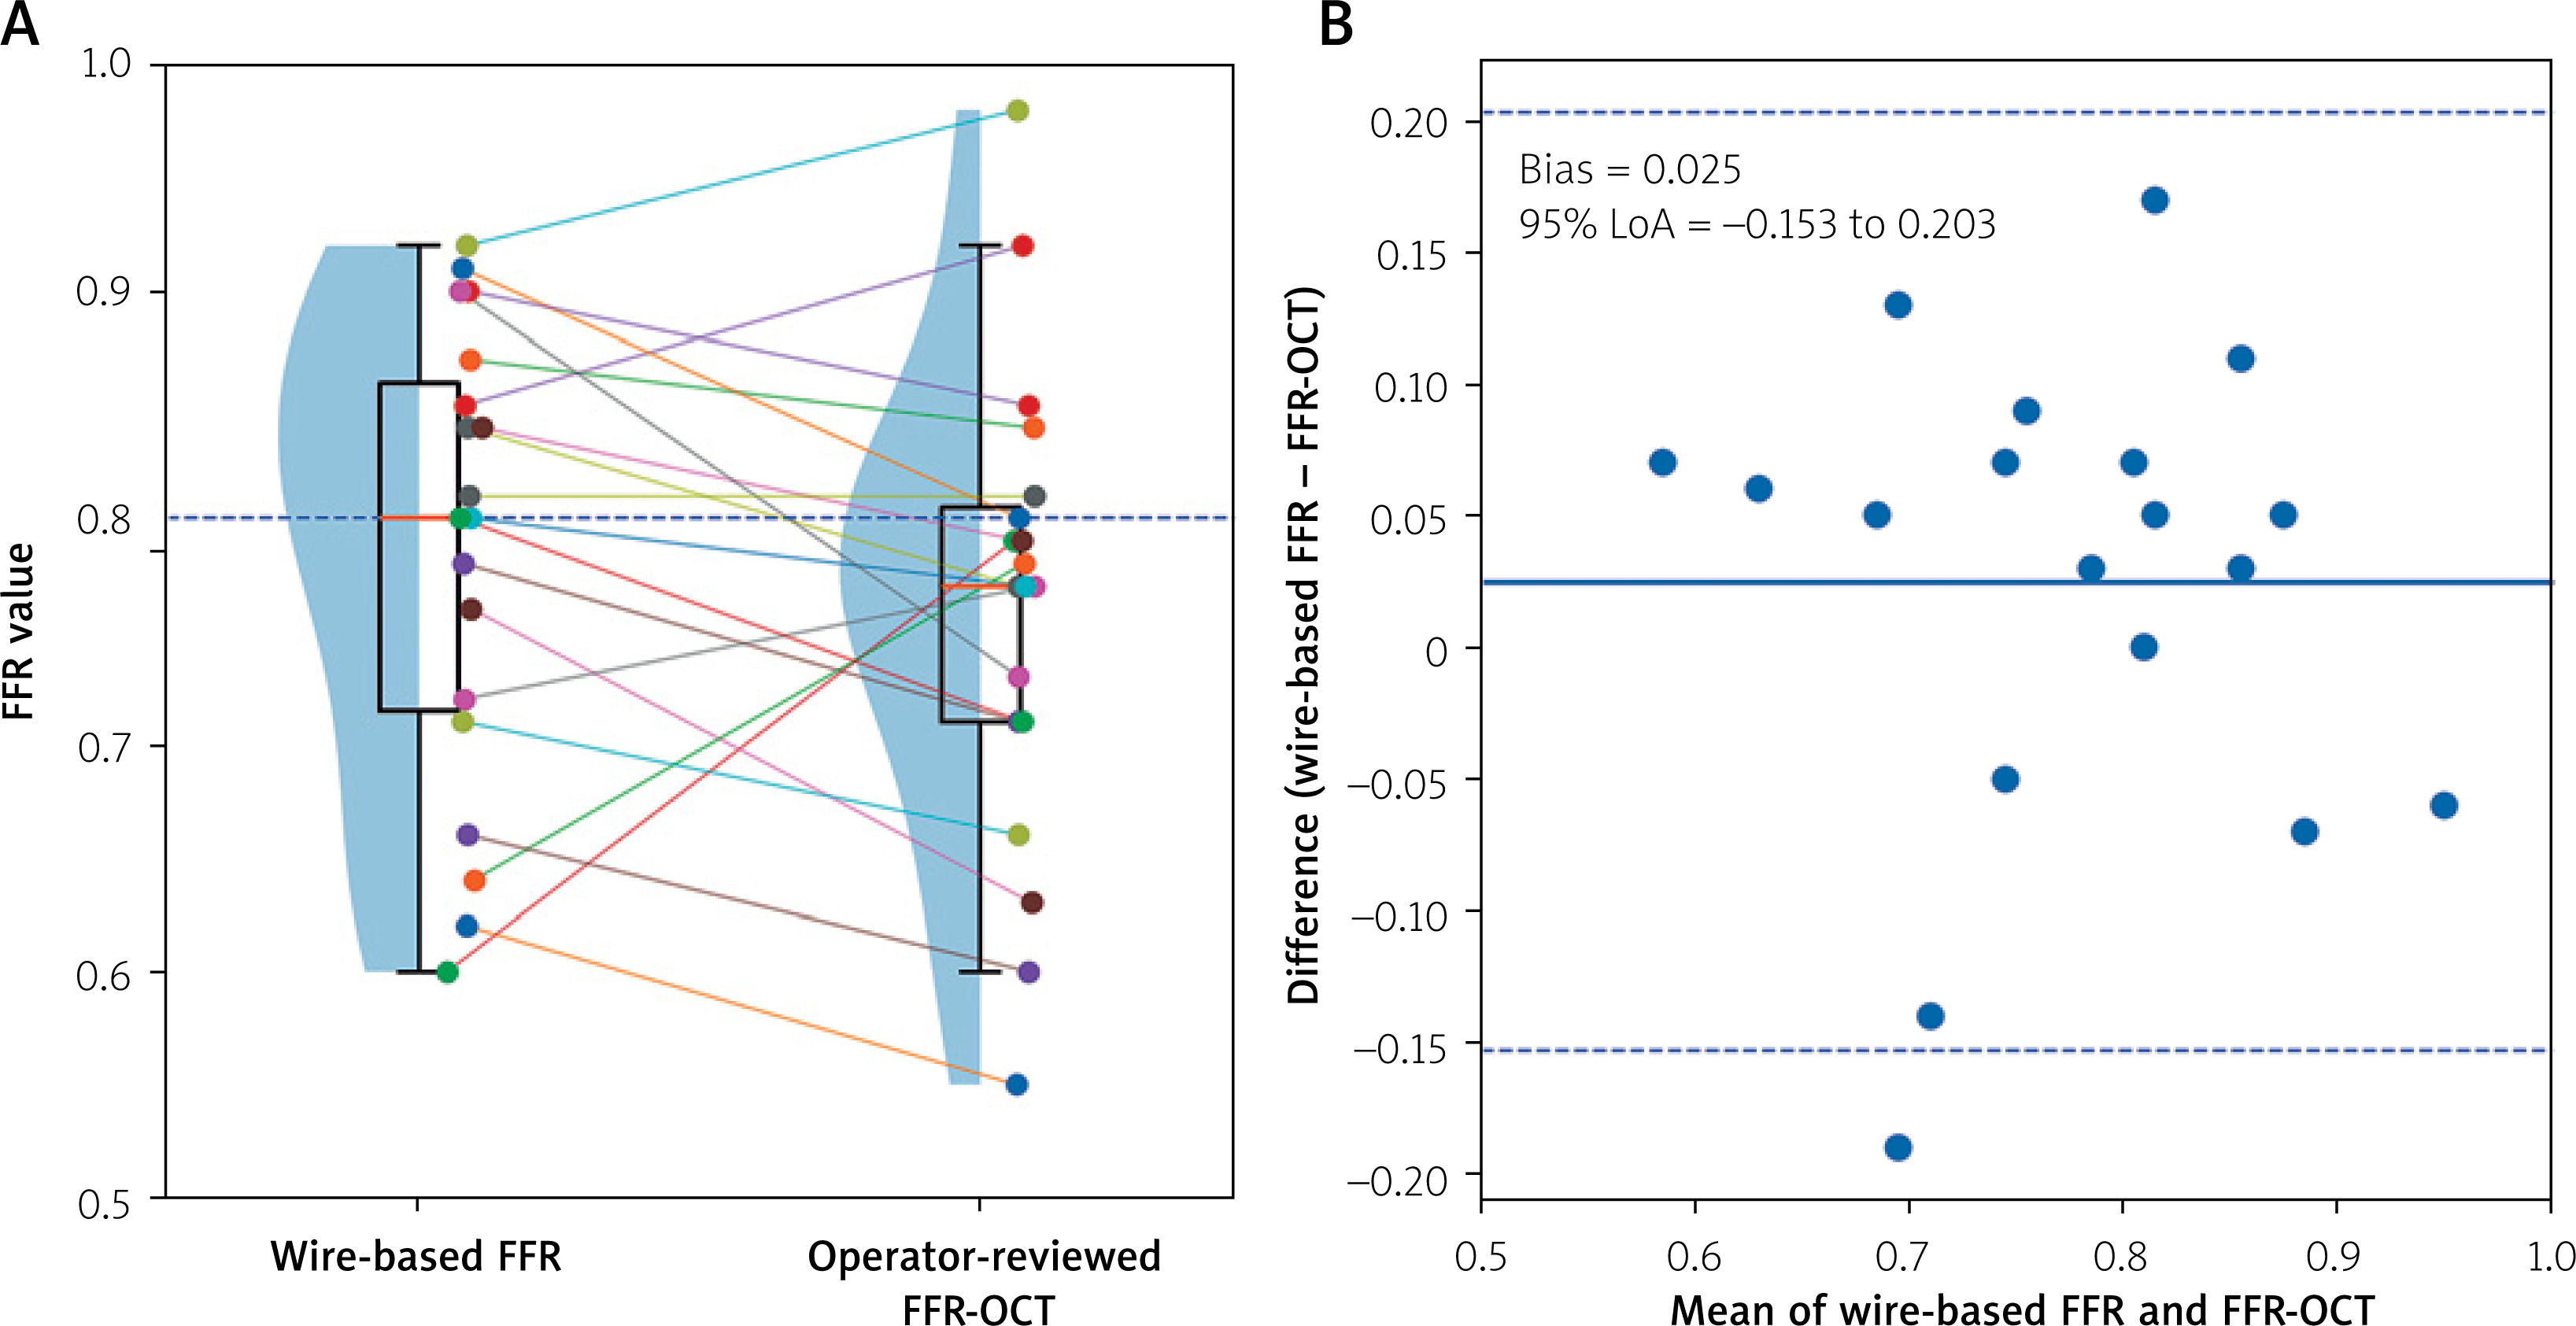
Table II
Vessel-level physiology and diagnostic comparison (n = 19)
Discussion
In this single-center real-world study, the most notable finding was that manual review of lumen contours and side-branch recognition substantially changed the automated FFR-OCT result, raising the mean value from 0.68 to 0.75 and bringing it closer to the wire-based FFR of 0.79. This indicates that the physiological output of contemporary OCT software depends not only on the computational model but also on image quality, lumen reconstruction, and correct identification of side branches – features that, in routine practice, frequently required operator intervention.
Despite a statistically significant correlation with wire-based FFR, agreement was incomplete: ischemia classification was discordant in 4 of 19 vessels (21.1%). Because revascularization decisions are threshold-based rather than continuous, this discordance is of greater practical relevance than the correlation coefficient itself. Notably, the disagreement was unidirectional: all four discordant vessels were classified as ischemic by FFR-OCT despite clearly non-ischemic wire-based FFR values (0.84–0.91), with no discordance in the opposite direction. Rather than borderline reclassification near the threshold, this pattern indicates a systematic tendency of FFR-OCT to overestimate stenosis significance, consistent with the small negative bias on Bland-Altman analysis (mean +0.025 for wire-based FFR minus FFR-OCT). The wide confidence interval around our discordance rate (6.1–45.6%) precludes precise comparison with larger cohorts; for context, the prospective multicenter FUSION trial reported an overall accuracy of 82% for OCT-derived virtual flow reserve (VFR) versus invasive FFR, corresponding to approximately 18% misclassification [7]. Our numerically similar but highly imprecise estimate is consistent with, but cannot confirm, that performance, and is compatible with limitations of contemporary OCT-derived physiological modelling, although center-specific workflow and case selection may also have contributed.
The concept of deriving physiology from intracoronary imaging has attracted growing interest [8]. Like QFR and FFR-CT, OCT-based assessment avoids pressure-wire manipulation and pharmacological hyperemia while simultaneously providing plaque morphology, vessel dimensions, and procedural planning within a single acquisition. In a subanalysis of the AQVA-I and II trials, a blinded operator planned PCI using angiography, angiography-derived FFR, OCT, and OCT-VFR; the OCT-VFR plan differed from the angiography-based plan in 48% and from the angiography-derived FFR plan in 30% of cases, indicating that adding OCT-derived physiology can alter procedural strategy [9]. The rationale for combining anatomy and physiology extends beyond ischemia: in COMBINE OCT-FFR, thin-cap fibroatheroma predicted adverse events despite negative FFR in diabetic patients [10], and the PREVENT trial subsequently showed that preventive PCI of non–flow-limiting vulnerable plaques reduced events relative to medical therapy alone [14]. These findings support combined morphological–physiological assessment as a direction worth pursuing, although they address plaque vulnerability rather than the diagnostic equivalence of FFR-OCT and wire-based FFR.
Beyond pre-PCI assessment, OCT-derived physiology may have a post-procedural role. In an ILUMIEN IV substudy, post-PCI OCT-VFR, together with minimal stent area, independently predicted the 2-year composite of cardiac death, target-vessel myocardial infarction, and ischemia-driven target-vessel revascularization [8]. This points to a potential prognostic application after stenting rather than a substitute for invasive FFR in revascularization decisions.
From a practical standpoint, FFR-OCT may be useful for procedural planning and optimization, informing the segment of interest, stent length, and the estimated post-PCI value. However, obtaining reliable values depended on good pullback quality and frequent manual interpolation of lumen contours and correction of side-branch recognition, which required close cooperation with catheterization-laboratory staff and added analysis time. Although increasing automation is a major advantage of contemporary OCT platforms, our experience indicates that operator supervision remains essential to ensure reliable output – a potential barrier to adoption outside highly experienced centers.
The moderate correlation (r = 0.614) is itself informative. Computational models are based largely on vessel geometry and assumptions about hyperemic flow, whereas invasive FFR integrates epicardial stenosis, diffuse atherosclerotic burden, microvascular function, collateral circulation, and individual hyperemic response [3]. Discrepancies between simulated and measured indices are therefore expected, particularly in complex disease. In routine practice, because the misclassification was exclusively in the direction of overcalling ischemia, the principal risk of using FFR-OCT as a standalone tool would be unnecessary intervention rather than inappropriate deferral. Although our sample is too small for definitive conclusions, this directional bias supports cautious interpretation of OCT-derived physiology and raises the question of whether a method-specific threshold or calibration may be needed to improve specificity – a hypothesis for future study.
Combining plaque characterization, procedural optimization, and physiological estimation within a single OCT acquisition remains an attractive goal. Improvements in image processing, computational flow modeling, and automated vessel reconstruction may enhance diagnostic performance; whether they will allow OCT-derived physiology to support independent clinical decision-making remains to be determined. Beyond a single per-vessel value, the gradient of FFR-OCT along the vessel could in principle distinguish focal from diffuse disease – analogous to the invasive pullback pressure gradient – and thereby inform whether a lesion is suitable for PCI; whether OCT-derived gradients carry comparable value remains to be tested [3, 15, 16].
Several limitations should be acknowledged. First, this was a single-center study with a small sample size, which limits statistical power and yields wide confidence intervals around all estimates, including the discordance rate (6.1–45.6%). Second, only patients undergoing both invasive physiological assessment and OCT-guided PCI were included, introducing potential selection bias, and the study was not powered to establish diagnostic performance parameters such as sensitivity, specificity, predictive values, or receiver-operating characteristic metrics. Third, 19 vessels were derived from 15 patients; because vessels within the same patient are not fully independent, all vessel-level analyses should be regarded as exploratory. Fourth, manual correction of lumen contours and side-branch recognition was performed by a single experienced operator without assessment of inter- or intra-observer reproducibility; although the operator was blinded to the wire-based FFR result, the absence of a second reader means the reproducibility of the correction process could not be quantified. Fifth, hyperemia was induced with intracoronary adenosine boluses rather than continuous intravenous infusion, which may not have produced steady-state maximal hyperemia in all cases and is a recognized source of FFR variability. Finally, the results are specific to the Ultreon 3.0 software version evaluated and may not generalize to other platforms or future software iterations.
Conclusions
In this initial single-center experience, operator-reviewed FFR-OCT showed a significant association with wire-based FFR but discordant ischemia classification in approximately one-fifth of vessels. Notably, manual review of lumen contours and side-branch recognition substantially changed the automated result, underscoring that current OCT-derived physiology depends on operator input and is not yet a turnkey measurement. These findings support FFR-OCT as a promising adjunct for procedural planning and optimization, while invasive physiological assessment remains the reference for revascularization decisions. Larger prospective studies with prespecified, blinded image analysis are needed before OCT-derived physiology can be considered interchangeable with pressure-wire assessment.