
Purpose
Gynecologic cancers, such as cervical, endometrial, and vaginal cancers, are the fourth leading cause of female cancer mortality worldwide [1]. External beam radiotherapy (EBRT) followed by intracavitary brachytherapy (ICBT) is the standard treatment protocol for cervical cancer [2]. In ICBT, the clinician places the applicator near the tumor to provide predetermined dwell positions for radioactive sources [3]. However, for some cases of advanced cervical cancer, in which the tumor cannot be encompassed by standard ICBT, interstitial needles are inserted to provide extra dwell positions and optimize dose distribution. Combined intracavitary/interstitial (IC/IS) treatment protocols have been shown to achieve satisfactory treatment effects for cervical cancer [4,5]. Sethi et al. designed a vaginal cylinder as the applicator, which included a central channel for a catheter and surface channels for interstitial needles [6]. Combined IC/IS applicators for gynecologic brachytherapy are helpful in improving target coverage and decreasing dose to organs at risk (OARs) compared with patients treated with ICBT [7,8].
Navigation is the combination of tracking and imaging technology to provide an intraoperative visualization of surgical instruments relative to the target region and surrounding anatomy structures [9], and to guide the surgical instruments to specified locations by intraoperative images. Due to excellent qualities of non-invasiveness, real-time application, affordability, and convenience, ultrasound (US) is the preferred modality to provide intraoperative images. For IC/IS gynecologic brachytherapy, precise needle insertions are critical in order to optimize local control and minimize major side effects [10]. Needle tips should extend beyond target region to ensure dose coverage in general [11]. During the needle insertion, in which the needle path is seen as entering an artifact without clearly exiting artifact region, the needle tip is assumed not visible. Such an artifact is considered as region of shadowing or air pocket [11]. Therefore, visualization of needle tips is essential during needle insertions. Furthermore, needle trajectories should avoid OARs like bladder, rectum, and blood vessels, damage to which can cause hemorrhaging into the peritoneal cavity or vagina [12]. An effective intraoperative guidance can satisfy these needs. Our study aimed to achieve an effective surgical navigation, in which the real-time needle trajectory was tracked and localized in a 3D preoperative image space. To realize effective image guidance, 2D US slices was registered to the patient’s underlying 3D anatomy, including relevant diagnostic information such as 3D magnetic resonance imaging (MRI) or X-ray computed tomography (CT) scans [13]. Matching degree between real-time needle trajectory and needle trajectory in registered US images determines the needle guidance accuracy by registered US images. Only when this accuracy is high, clinicians are able to acquire reliable updated anatomy information during visual needle insertion to achieve effective surgical navigation.
Medical image registration can be divided into rigid registration and deformable registration. Since the existing deformable registration algorithms are time-consuming and are not amenable to real-time application, the registration of US images usually applies rigid registration [14]. For rigid transformation, it is assumed that anatomical and pathological structures of the target do not deform or distort the process of image acquisition. The “rigid” hypothesis simplifies the complexity of registration and has the critical advantage of real-time ability. Based on the rigid registration between US images and preoperative images, there is no need to compare the 2D US image slices to the 3D anatomy of patient. Anatomic shifts can be easily visible and measured when preoperative images are displayed together with US images, thereby providing the updated anatomy information of patient to the medical team to realize image guidance [9]. The US and preoperative images can be unified into a common space to achieve the rigid registration by optical sensor or electromagnetic sensor attached to US probe. US probe calibration determines the location of US image in space relative to the tracking sensor attached to US probe, which is the transition in the process of rigid registration between the two modalities [15]. Toews et al. calibrated and assessed calibration quality of externally tracked 2D US probe by scanning arbitrary natural tissues [13]. Wang et al. identified the imaging plane of US probe and image features and estimated the calibration parameters by detecting and analyzing the temporal signal arising from ultrasound artifact when sweeping US probe across a phantom [16]. Additionally, based on the optical sensor or electromagnetic sensor attached to needles, the intraoperative locations of needle tips can be tracked, thereby the real-time needle trajectories in 3D preoperative image space can be localized by space registration.
In this article, the registration procedure between intraoperative US images and preoperative MRI images as well as the experimental verification of registration accuracy in a pelvic phantom were demonstrated. We designed an IC/IS applicator and proposed a method to localize the real-time needle trajectory. Additionally, we presented an experimental verification of registration accuracy between real-time needle trajectories and needle trajectories in registered US images in a pelvic phantom to evaluate needle guidance accuracy by US images registered to MRI images.
Material and methods
US probe calibration
Calibration procedure
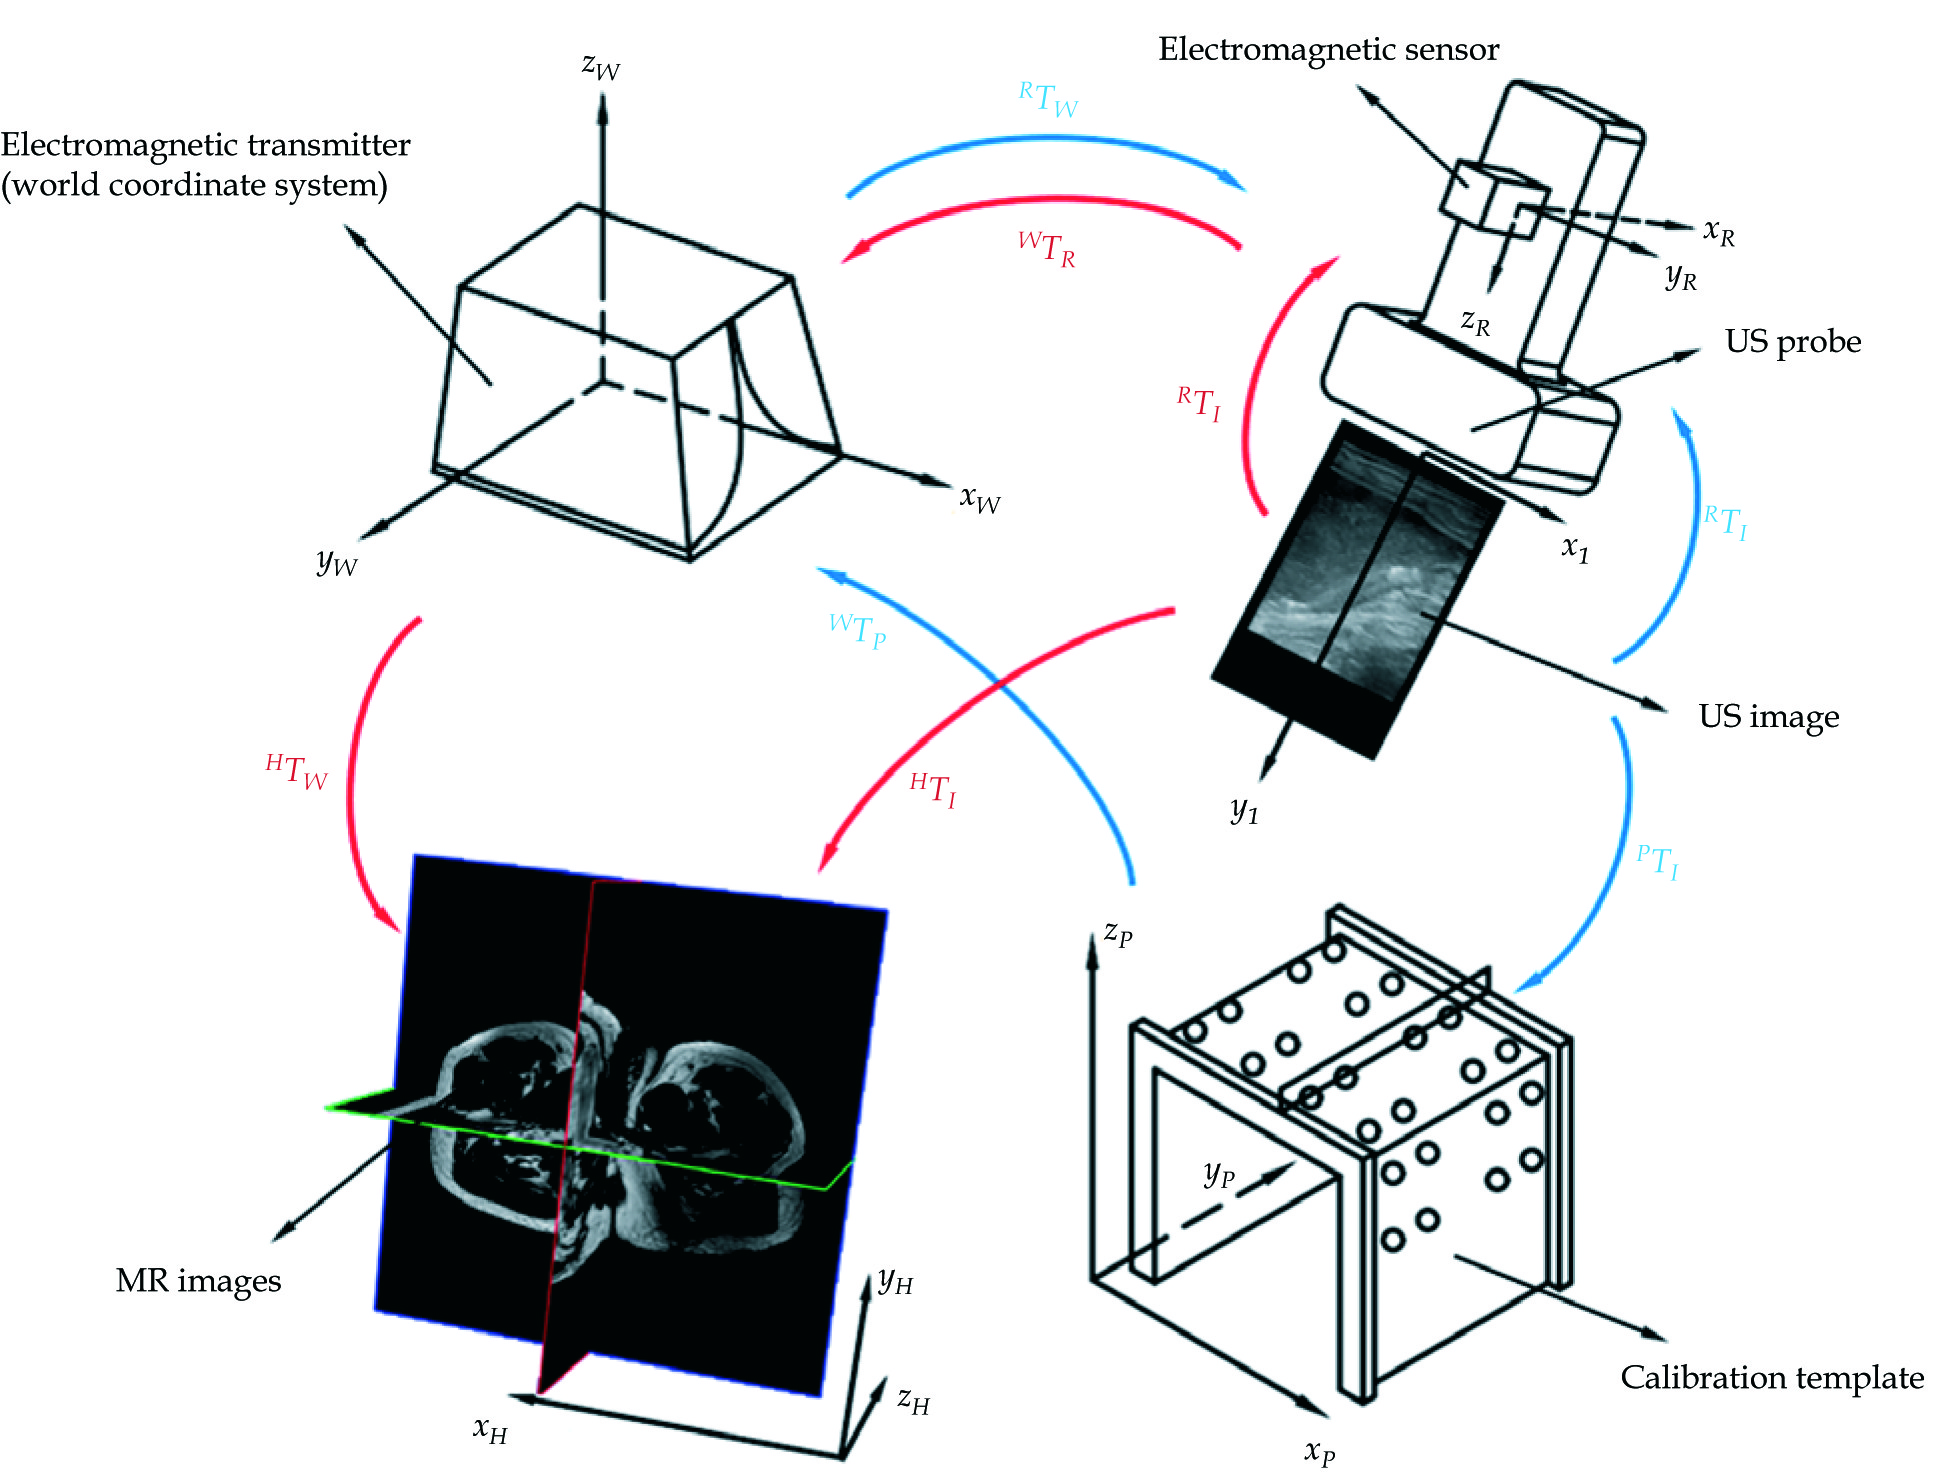
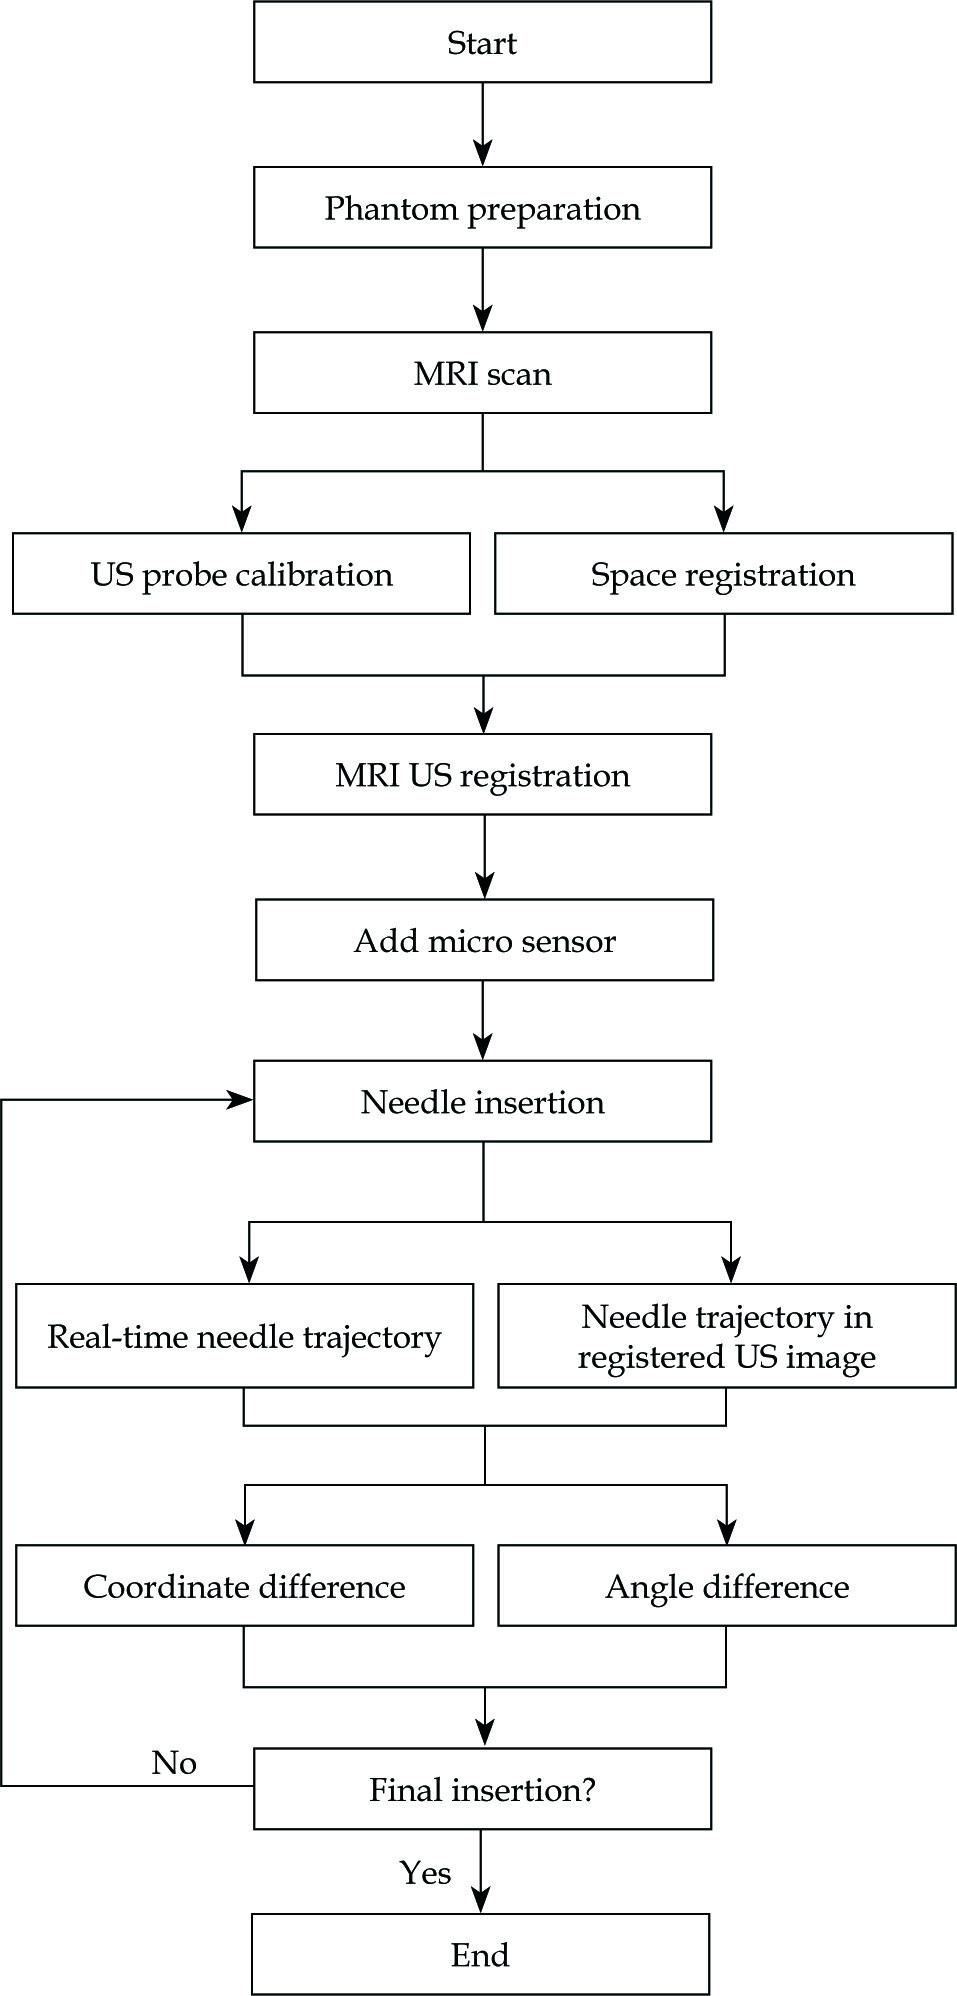
Figure 1 shows the calibration procedure with blue arrows. In the US probe calibration, an electromagnetic transmitter (mid-range transmitter, Ascension Technology Corporation, USA) was used to locate the space, meaning that the electromagnetic transmitter coordinate system was the world coordinate system (system W). The US probe used was the transabdominal ultrasound linear probe. The tracking sensor attached to the US probe was an electromagnetic sensor (Model 800 sensor, Ascension Technology Corporation, USA). The calibration template consisted of three acrylic plates connected to regularly distributed plastic pellets (Φ 6 mm), and two parallel threads were in the template. The plane constructed by the threads was perpendicular to the upper plate and passed through the sphere centers of a row of pellets. Three kinds of coordinate systems were in system W: the US image coordinate system (system I), the electromagnetic sensor coordinate system (system R), and the calibration template coordinate system (system P). US probe calibration was to estimate the similarity transformation RTI, which maps 2D US image coordinates to 3D electromagnetic sensor coordinates. Assuming that a point was in system I as well as system R, the following equation can be obtained:
XR= RTITSXI(1)
where XR = (x, y, z, 1)T is the homogeneous coordinates of a point in system R, and XI = (u, v, 0, 1)T is the homogeneous pixel coordinates of the point in system I. TS is a 4 × 4 diagonal scaling matrix converting US spatial units (pixels) to world distance units (mm), which has the following form:
where Su and Sv are scaling parameters along with x and y directions of US image, provided by ultrasonic instrumentation. RTI is a 4 × 4 homogenous transform matrix, which has the following form:
where RTW, WTP, and PTI are 4 × 4 homogenous transform matrices; R1, R2, and R3 are rotation matrices; t1, t2, and t3 are translation vectors. RTW is a 3D rigid transform mapping of 3D world coordinates to 3D electromagnetic sensor coordinates, which is provided by the electromagnetic tracker. WTP is a 3D rigid transform mapping of 3D calibration template coordinates to 3D world coordinates. PTI is a 3D similarity transformation mapping of 2D US image coordinates to 3D calibration of template coordinates. Solutions of WTP and PTI are the necessary premises to solve RTI.
Solution of WTP
The solution of 3D transform matrix is taken to explore the optimal rotation of matrix R and translation of vector t to minimize the distance between homologous points in two different coordinate systems. For WTP:
where Q Pi = (xi, yi, zi)T is the calibration template coordinates of a point, which can be obtained by its position in system P; Q Wi = (xi, yi, zi)T is the world coordinates of this point, which can be obtained by using the tip of a rotation calibrated needle probe to touch it. The highest spherical points of pellets in the calibration template, which are marked in advance, are selected points. Assuming that two-point sets of the selected points in system P and system W are A = {a1, a2,..., an} and B = {b1, b2,..., bn}, the two-point sets are decentralized in matrix X and matrix Y, which can produce:
By using SVD to decompose matrix XYT, the rotation of matrix R and translation of vector t of WTP can be solved. The following formulas show this procedure:
XYT= UΣVT(7)
R = UVT(8)
Solution of PTI
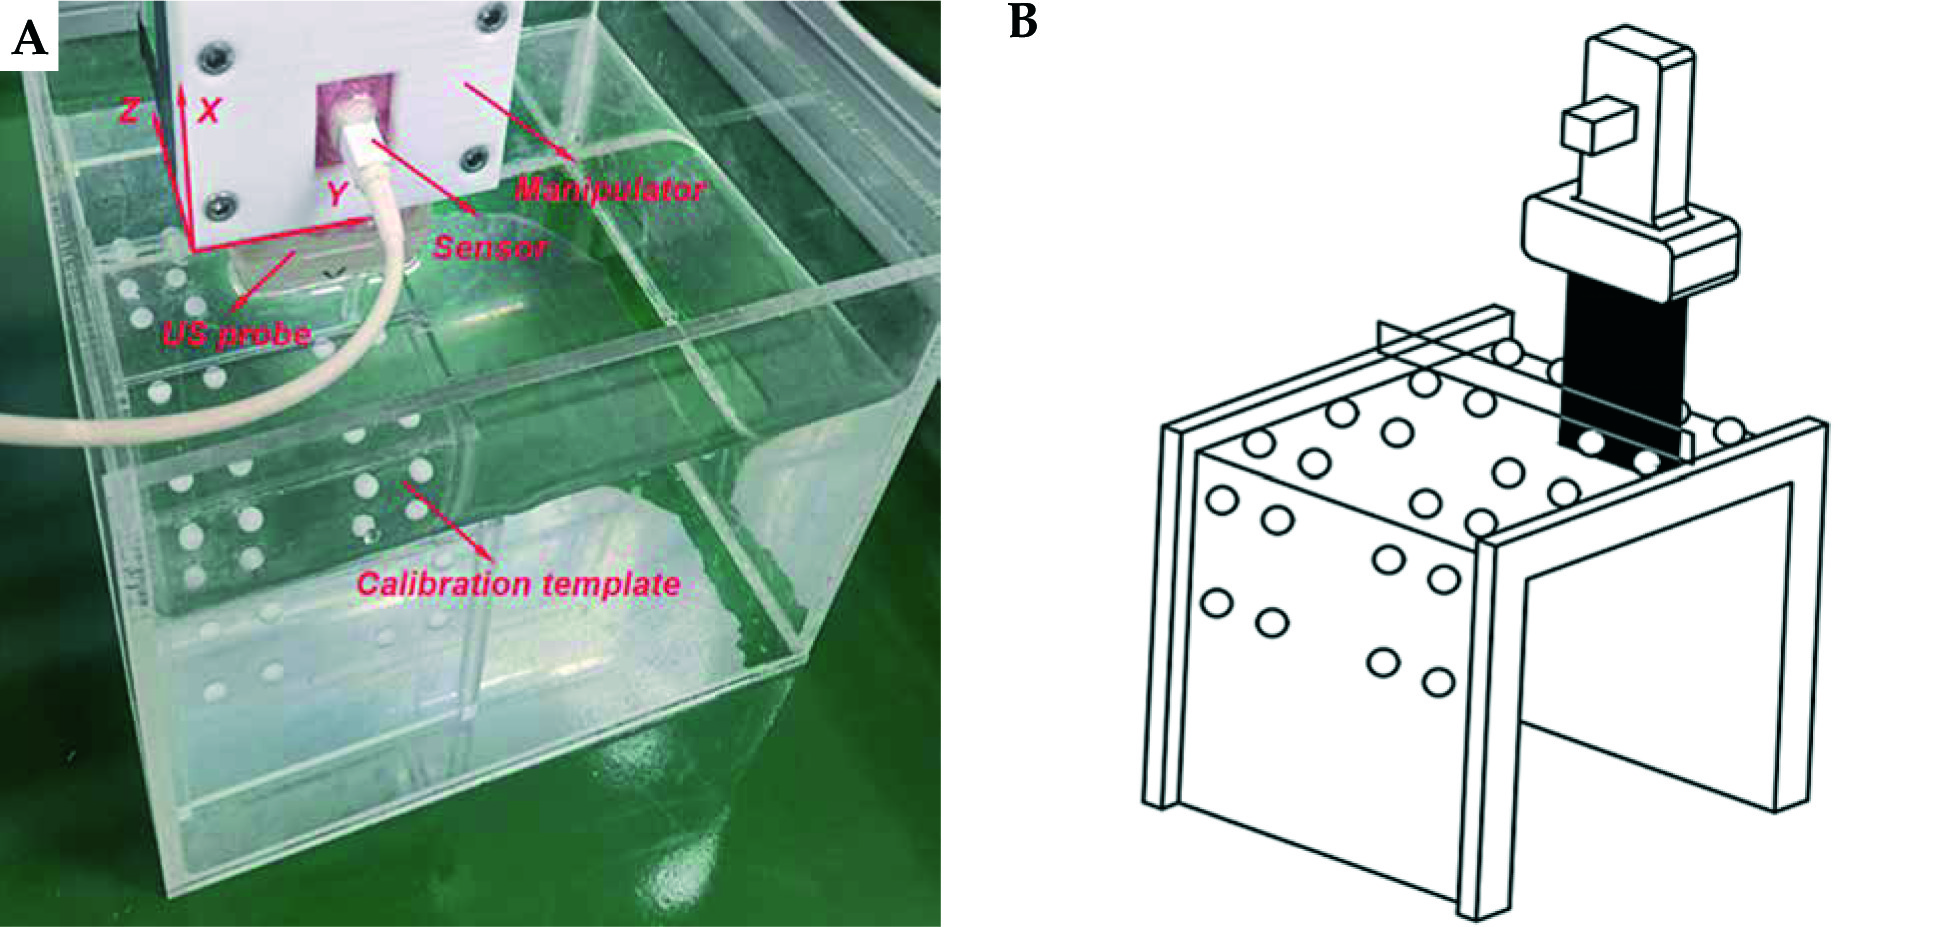
The solution of PTI is the critical step in US probe calibration. We filled a container with glycerin solution containing 60 ml glycerol per 1 l distilled water such that the speed of sound was approximately 1540 m/s and then, the calibration template against the sidewall was placed. The US probe attached with electromagnetic sensor was fixed on a 3-DOF space manipulator, as shown in Figure 2A. Since metallic objects in the working space could induce perturbations of the electromagnetic field, a non-metallic manipulator was used in our study. The US image depth, image width, and focus depth were set as 10 cm, 4 cm, and 3 cm, respectively. We first moved the manipulator against the container’s sidewall and then moved it in the Y axis until the US probe was above the two columns of pellets. The distance in the Y axis was recorded. Next, we lowered the height of the US probe in the X axis until it touched the upper plate and then raised by 30 mm. We ensured that the US probe was immersed in the glycerin solution. Then, we moved the manipulator in the Z axis slowly until the US image provided the maximum visibility of the two threads, which meant that the US image slice coincided with the plane constructed by the two threads, as illustrated in Figure 2B. We captured this image and scaled it to convert US spatial units (pixels) to world distance units (mm), and RTW was obtained by the electromagnetic sensor. The top center of the US image was set as the coordinate origin of system I to ensure the PTI was unchanged regardless of the scan width and depth values. The two circular cross-sections in the captured US image corresponded to the maximum cross-sections of the two pellets in calibration template, which was the registration condition between system I and system P. Based on the movement distances of the US probe in the X axis and Y axis, PTI was solved by a SVD-based algorithm. From the principle of ordered multiplication of RTW, WTP, and PTI, RTI and completed US probe calibration were obtained.
Registration between US images and preoperative images
Figure 1 shows the registration procedure with red arrows. For the modality of preoperative image, MRI images are helpful in precise identification of the accurate extent of tumor, which has been shown to be superior to CT images in soft tissue delineation, although CT images can be used for HDR BT [17,18,19]. Therefore, MRI images were used as the modality of preoperative images in our study. The registration between US images and MRI images bring the US images into the 3D MRI image coordinate system (system H) by space transformation. This is to estimate the similarity transformation HTI, which maps 2D US image coordinates to 3D MRI image coordinates. HTI has the following form:
where HTW is a 3D rigid transform mapping of 3D world coordinates to 3D MRI image coordinates. By using the tip of a rotation calibrated needle probe to touch points in system W and picking up the corresponding points in system H, HTW can be solved by a SVD-based algorithm. These points are often external markers in clinical trials. WTR is the inverse matrix of RTW, which can be provided by the electromagnetic tracker. RTI can be solved by US probe calibration. From the principle of ordered multiplication of HTW, WTR, and RTI, HTI and the completed rigid registration between US images and preoperative MRI images were acquired.
Combined IC/IS applicator
Figure 3A shows the combined IC/IS applicator designed by our group. We made a circular vaginal template by 3D printing using vero-clear material. The vaginal template (Φ 30 mm) had a central channel for intrauterine tube (Φ 2.2 mm, φ 1.6 mm) and peripheral channels for interstitial needles (Φ 2.2 mm, φ 1.6 mm). The intrauterine tube had a curved part, which was used for insertion into the uterus. Both the intrauterine tube and interstitial needles were PEEK tubes, as plastic needles are standardly available and have been used in EM applications [20]. Additionally, for smooth needle insertion, we generated needle tapers by 3D printing using vero-clear.
Fig. 3
A) Combined IC/IS applicator. B) The small ring positions the micro sensor at the center of needle shaft
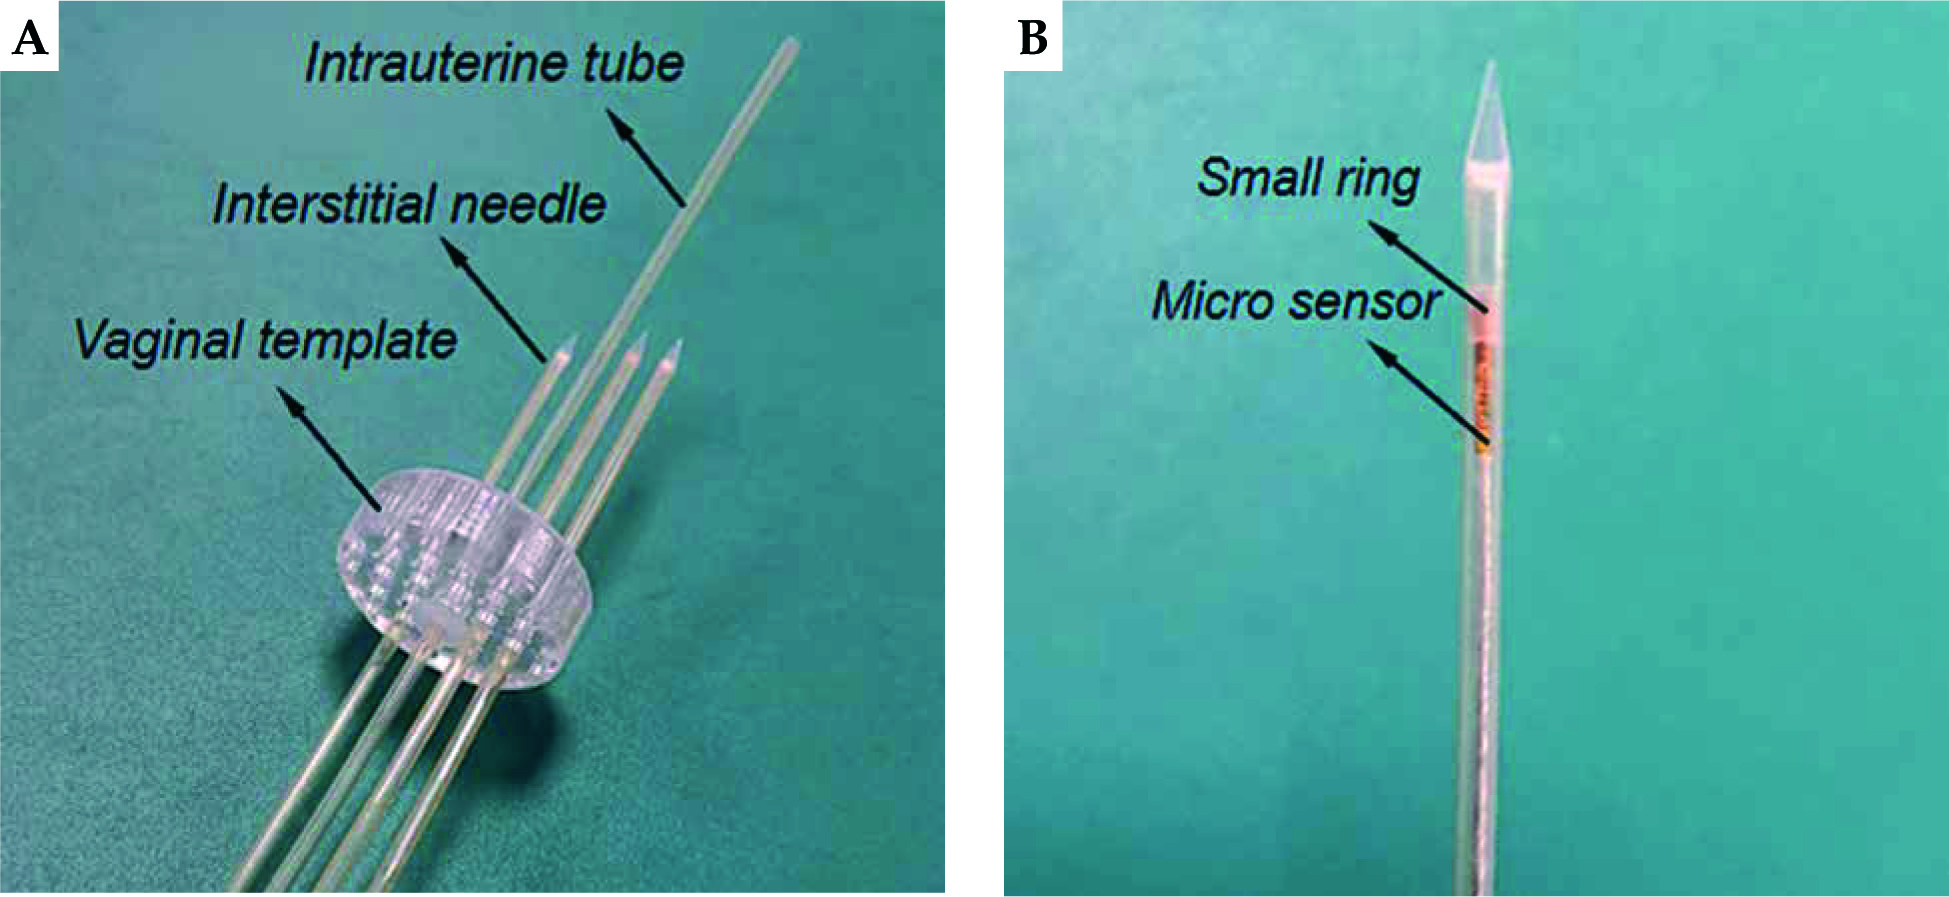
To track the real-time needle trajectory, a micro electromagnetic sensor (model 90 sensor, Ascension Technology Corporation, USA) was threaded through the needle shaft to the interface between the shaft and taper. As the micro sensor’s diameter was 0.9 mm, a small ring was set outside the micro sensor to position it at the center of needle shaft, as demonstrated in Figure 3B. The origin of the micro sensor coordinate system (system Q) was at the center of the head end, and the X axis of system Q was along the cylinder axis. Therefore, the needle tip position in the 3D MRI image coordinate system had the following equation:
where Xtip = (x, y, z, 1)T is the homogeneous coordinate of the needle tip in system H. WTQ is the inverse matrix of QTW, which is provided by the electromagnetic tracker. “h” is the height of the needle taper. Based on the coordinate data of the micro sensor that was at the bottom of needle taper, the real-time model of needle taper was drawn in 3D MRI image space during needle insertion to show real-time needle trajectory.
Marker validation
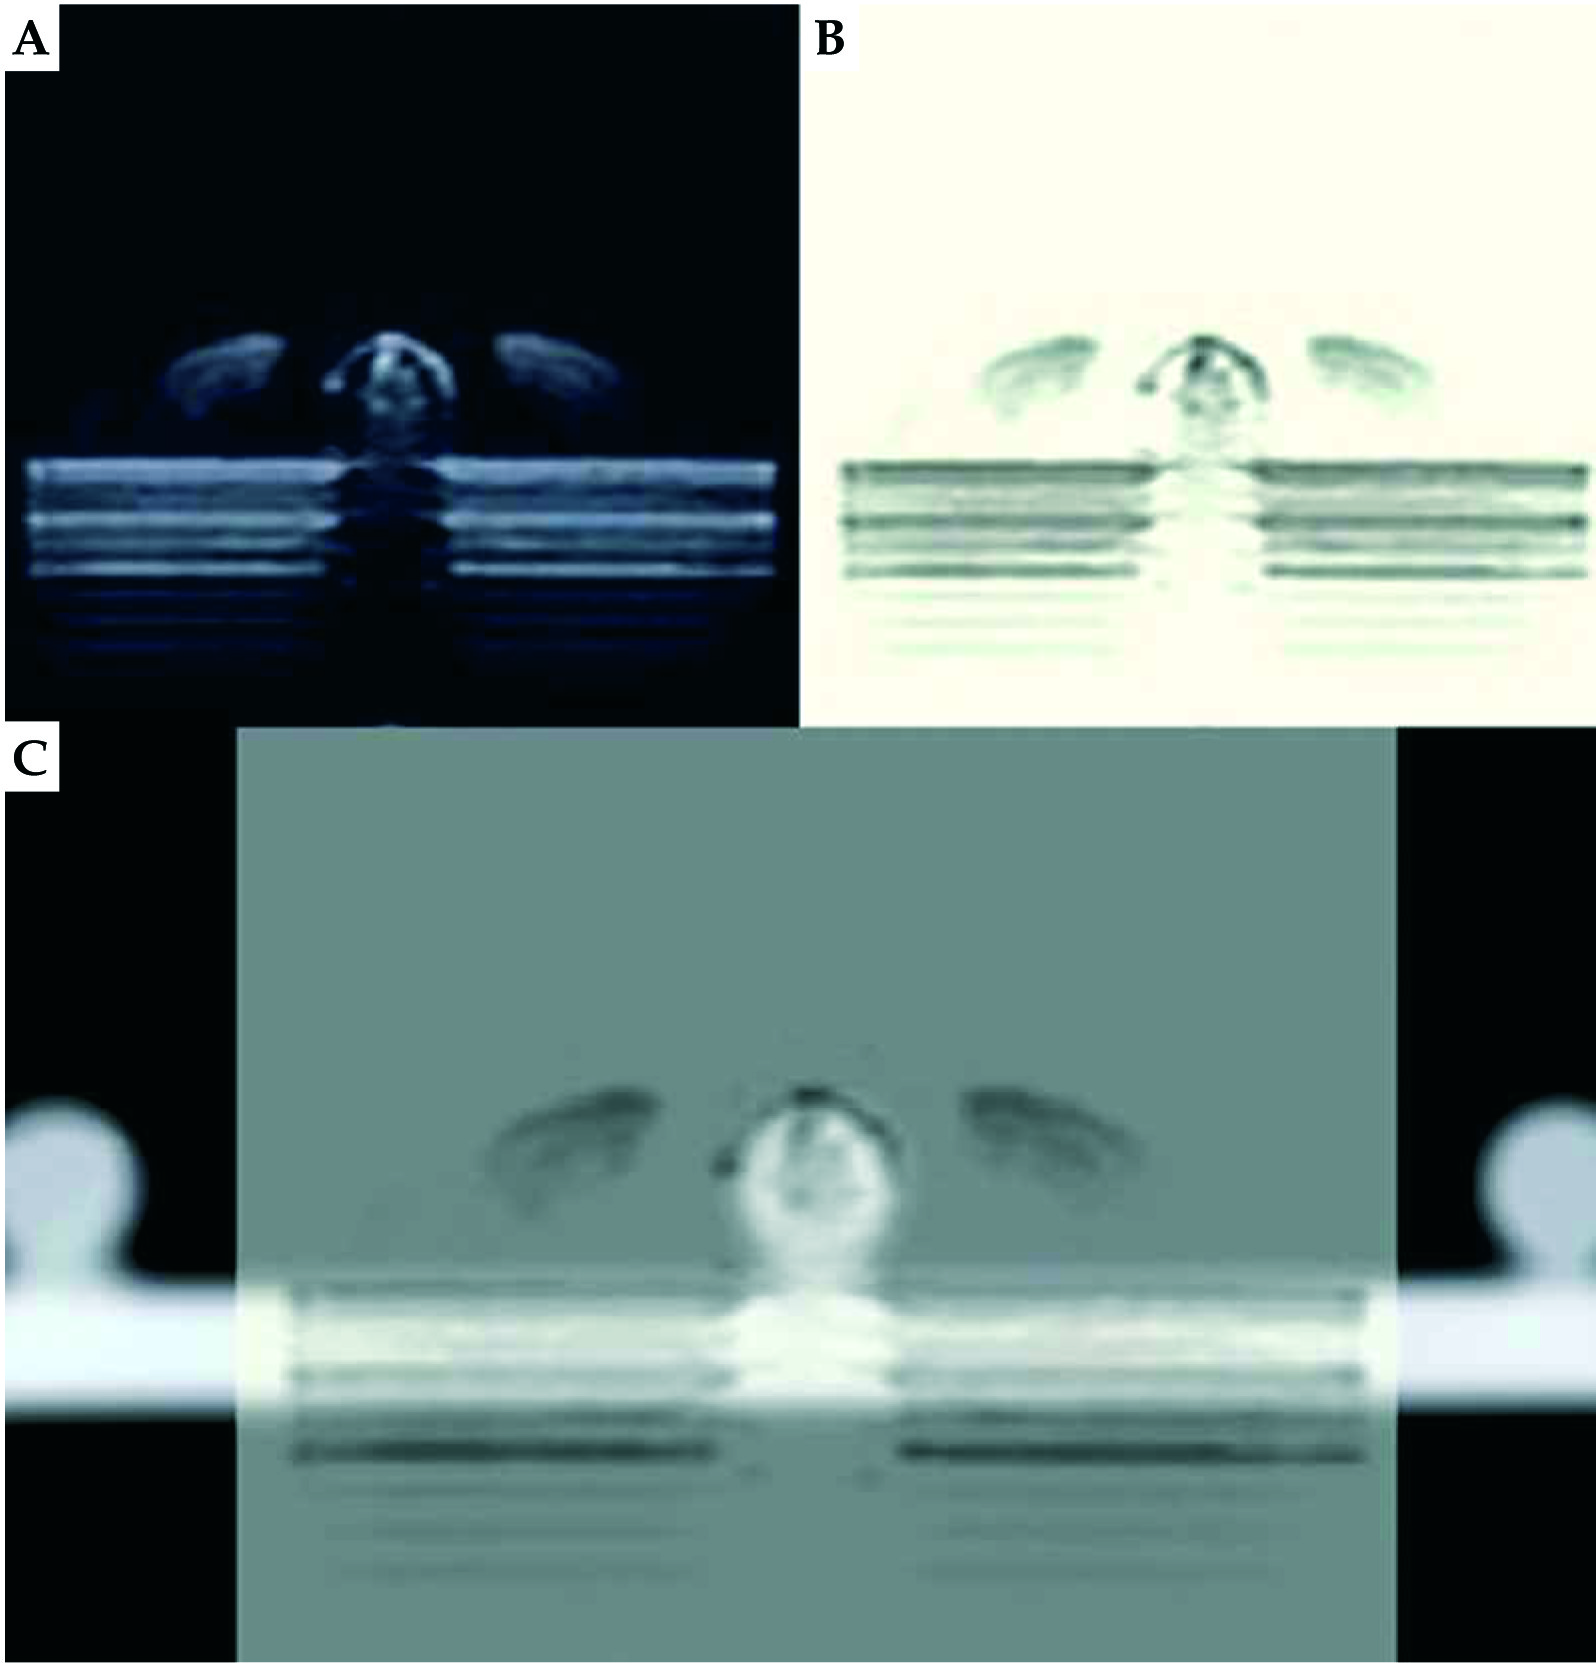
To preliminarily validate the accuracy of US probe calibration, the pellets on the calibration template were used as markers for the verification. The calibration template was placed in the container filled with glycerin solution containing 60 ml glycerol per 1 l distilled water, and then it was CT scanned with 1-mm slice gap and slice thickness to ensure that the slices could pass through the sphere centers of markers. We conducted US probe calibration and registration between CT images and US images 5 times. Due to glycerin solution being dark while the marker was bright in US images, as shown in Figure 4A, and similarly, glycerin solution being dark while the marker was bright in CT images, it was difficult to see the alignment between the two modalities after registration. We inversed the US images to darker the marker (Figure 4B) and adjusted the transparency of US images to easily reflect the alignment between two modalities, as shown in Figure 4C. Each time after finishing the registration, the US probe was moved by the space manipulator to scan 12 markers on the upper plate successively, except for the 4 markers under two threads. When the US slice passed through the sphere center of a marker, we picked up three non-collinear points on the outline of the marker’s cross-section in this registered US image to calculate the sphere center’s coordinates. If the diameter of the outline was in the range of 6 ±0.2 mm, it was regarded as the maximum cross-section. The corresponding sphere centers’ coordinates in CT images were clear. By calculating the distance between the two kinds of sphere center’s coordinates for each marker, we obtained 60 differences in total. Since the highest spherical points of markers on both lateral plates were used to solve HTW, which had a wide distribution in the calibration template, we considered that HTW was comparatively accurate and the main difference came from RTI.
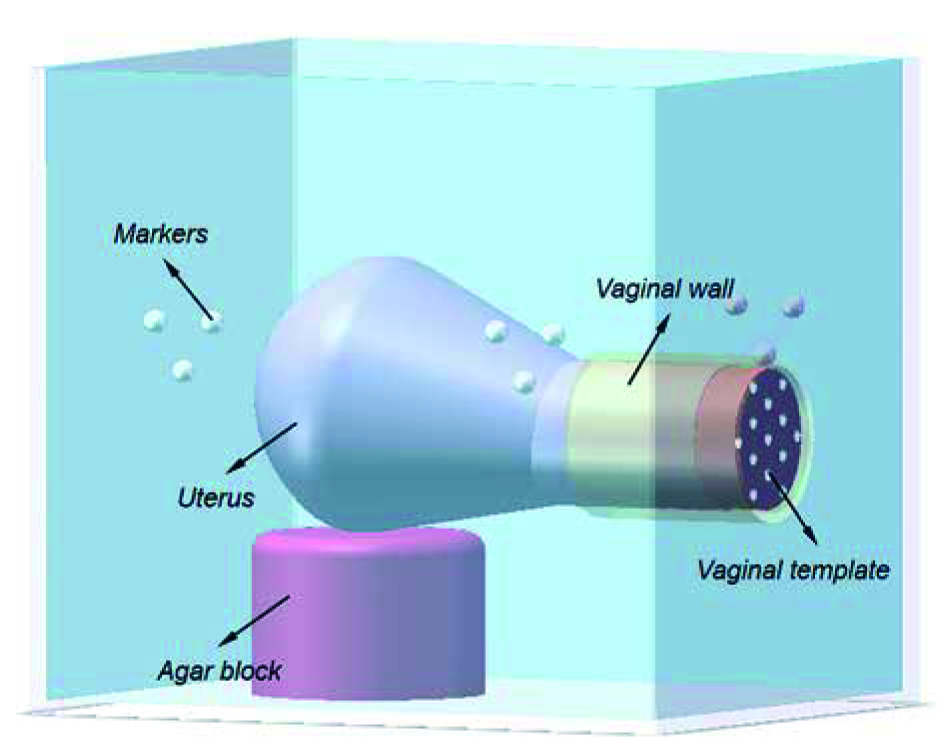
Pelvic phantom validation
Figure 5 shows the workflow of pelvic phantom validation. To further confirm the registration accuracy between US images and MRI images, a pelvic phantom, as shown in Figure 6, was formed for the verification. We segmented a typical uterus from a patient image. The uterus was formed from the agar mixture by a mold to provide an additional landmark in the US images (40 g agar powder and 6 g cellulose powder per 1 l distilled water). Granulated sugar was also added into the uterus appropriately to avoid water seepage. The phantom background was an agar mixture containing 20 g agar powder, 60 ml glycerol, and 10 g cellulose powder per 1 l distilled water to mimic soft-tissue scatter in US images. An agar block, which had the same composition as the uterus phantom, was formed to support it. Additionally, a vaginal wall was made by silica gel to place a vaginal template. The whole phantom was kept in a container attached with plastic pellet markers on the inside walls. Since the plastic markers were dark in T2-weighted MRI images, they were placed under the background agar mixture to distinguish the outlines.
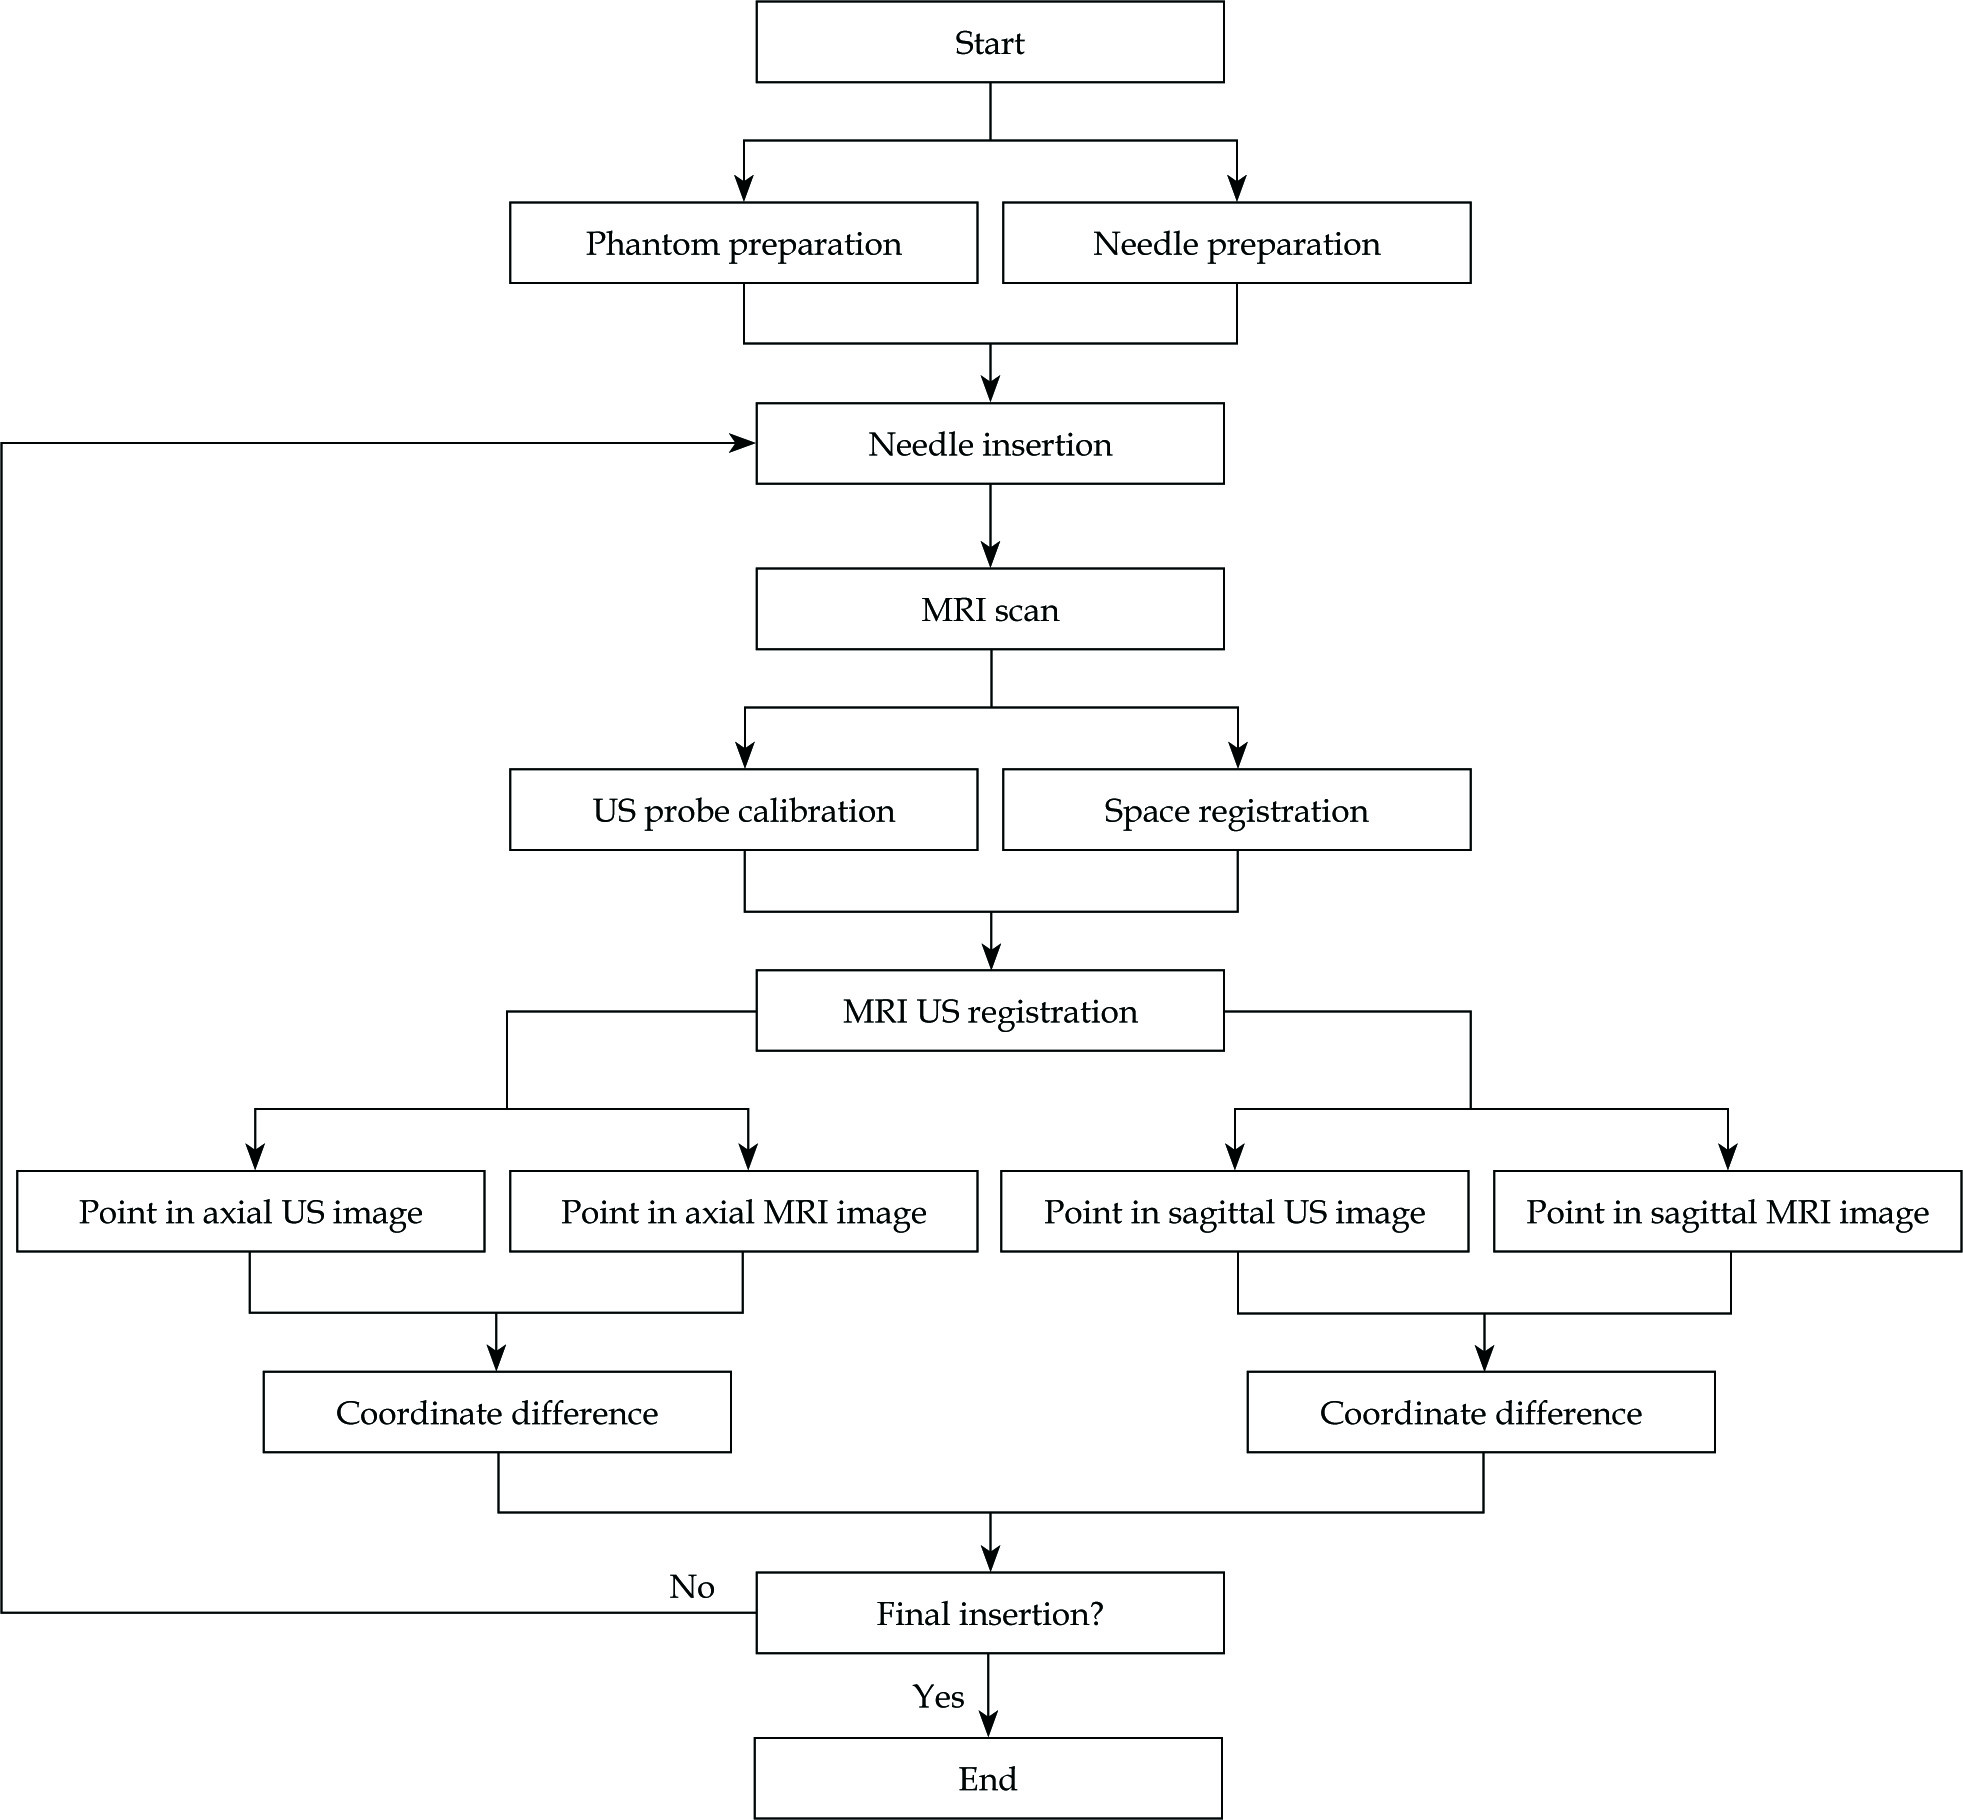
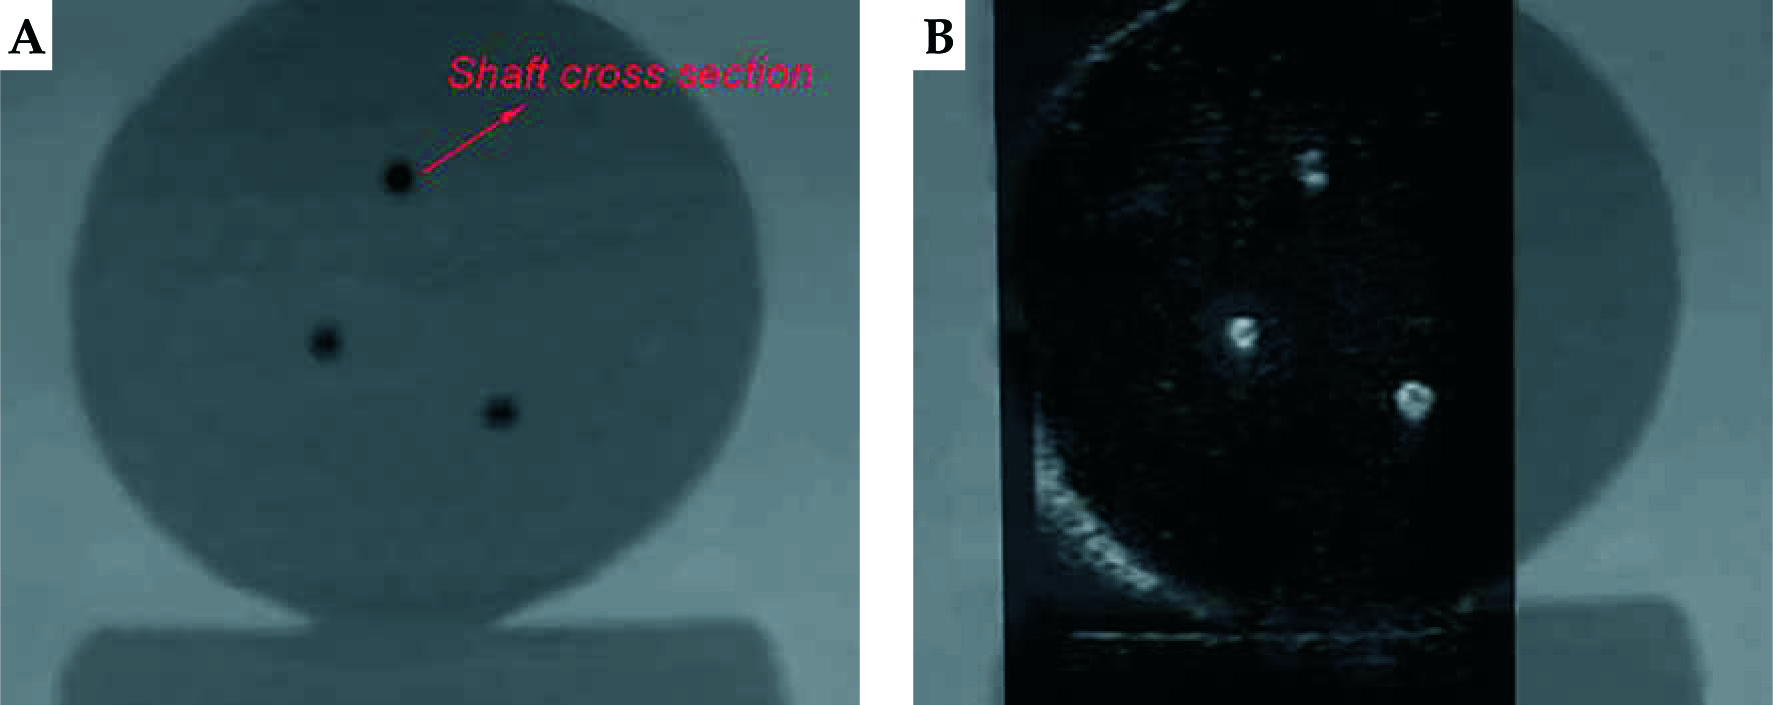
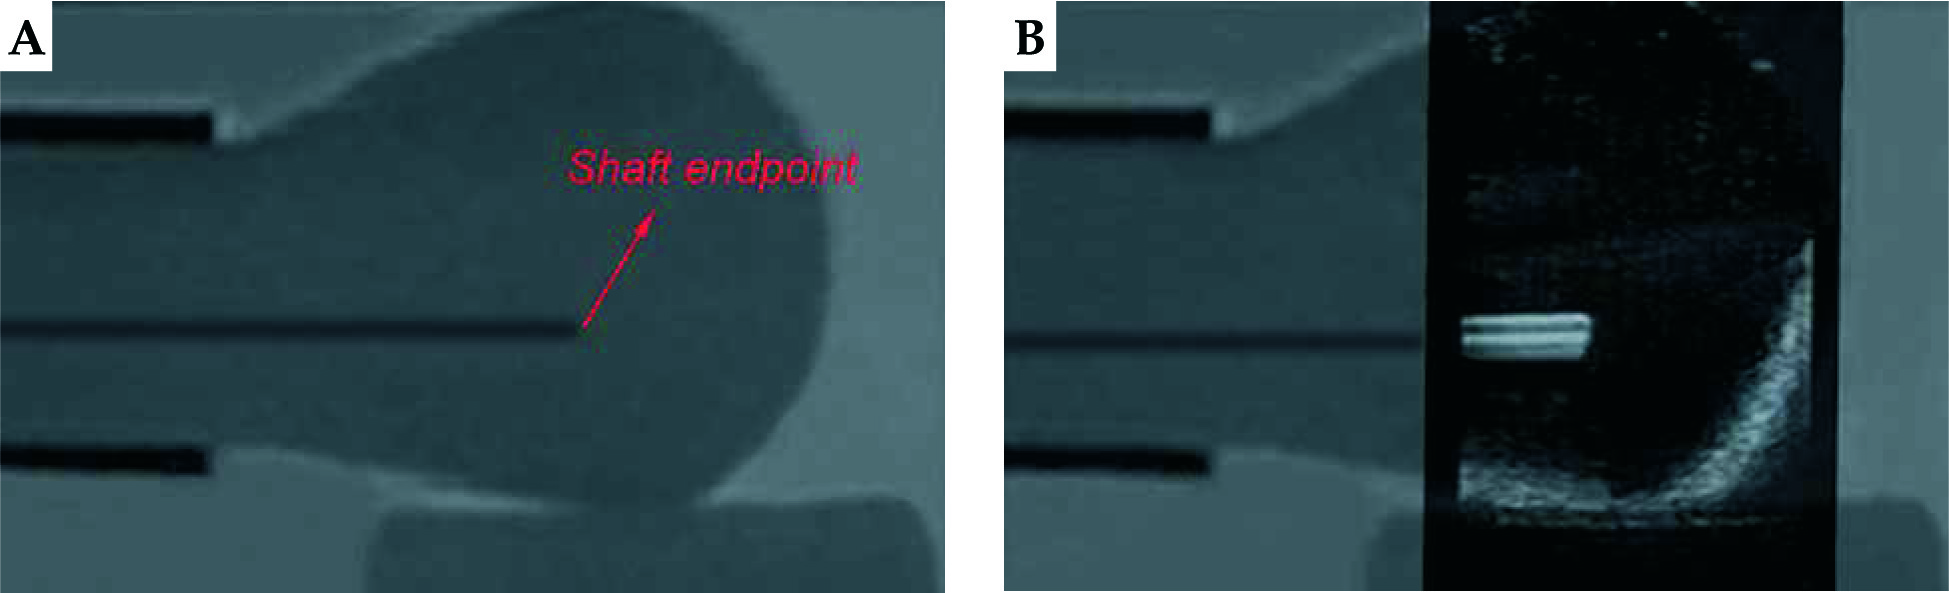
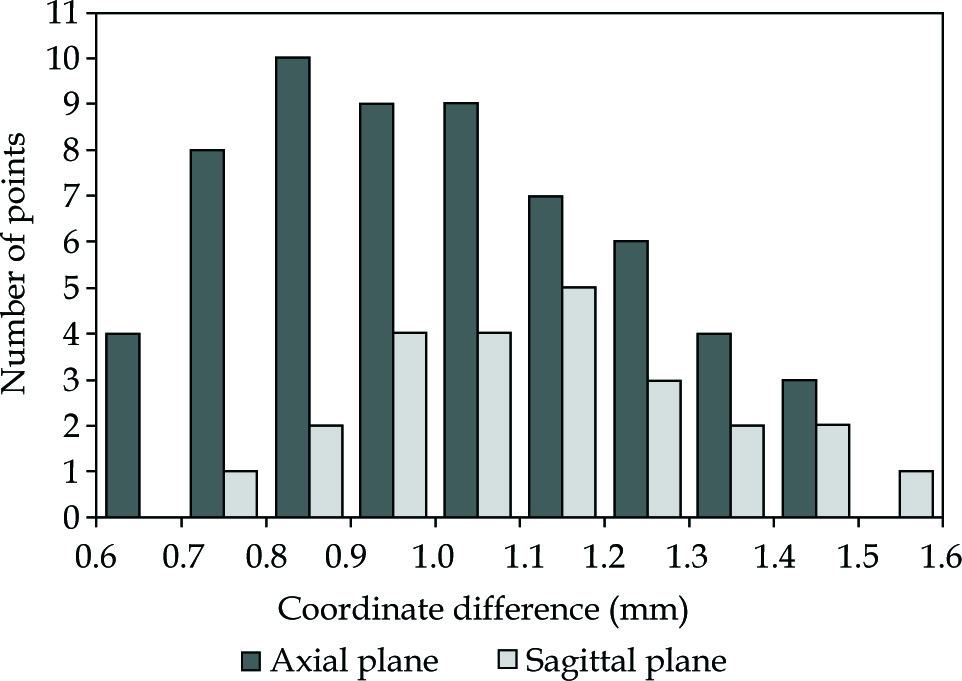
The plastic needles were hollow. We filled the needles with agar mixture with a syringe to avoid magnetic susceptibility artifacts caused by differences between local magnetic field gradient and magnetic susceptibility of the interface between plastic and air. Additionally, filling the agar mixture could avoid the artifacts in US images caused by air. Agar mixture was solidified to prevent the air from entering the needle shaft. Needle tapers were not used in this validation. After placing the vaginal template, we inserted 3 needles through peripheral channels into the uterus phantom. Axial US images were used to localize needles and sagittal US images were used to assess needle depth. Therefore, the registration accuracy between MRI images and US images was validated in these two planes. The phantom was subjected to axial and sagittal T2-weighted MRI scans, with 1-mm slice gap and slice thickness. After US probe calibration, we conducted registration between MRI images and US images based on the markers’ outlines in MRI images. For the axial MRI images, the centers of the needle shaft cross-sections in 4 slices with a distance of 5 mm were picked up, and the coordinates were acquired. Then, we scanned the phantom by US probe and adjusted it to successively correspond the registered US images with the 4 axial MRI slices. Each time, we selected the centers of needle shaft cross-sections in the registered US image and calculated the distances between corresponding points’ coordinates in the two modalities. For the sagittal MRI images, we searched for slices, which had needles and detected the endpoint of the needle shaft longitudinal section in each slice. Similarly, we scanned the phantom by US probe and adjusted it to coincide the registered US images with these slices successively. Each time, we detected the endpoint of needle shaft longitudinal section in the registered US image and calculated the distance between corresponding points’ coordinates in the two modalities. If the corresponding registered US image did not have a needle, it was not treated. After inserting the 3 needles through different peripheral channels, and after axial and sagittal T2-weighted MRI scanning of the phantom 5 times, we obtained 60 coordinate differences in the axial plane and 24 coordinate differences in the sagittal plane. Figure 7 shows the registration between the MRI image and US image in the axial plane, whereas Figure 8 shows the registration between the MRI image and US image in the sagittal plane.
Pelvic phantom study
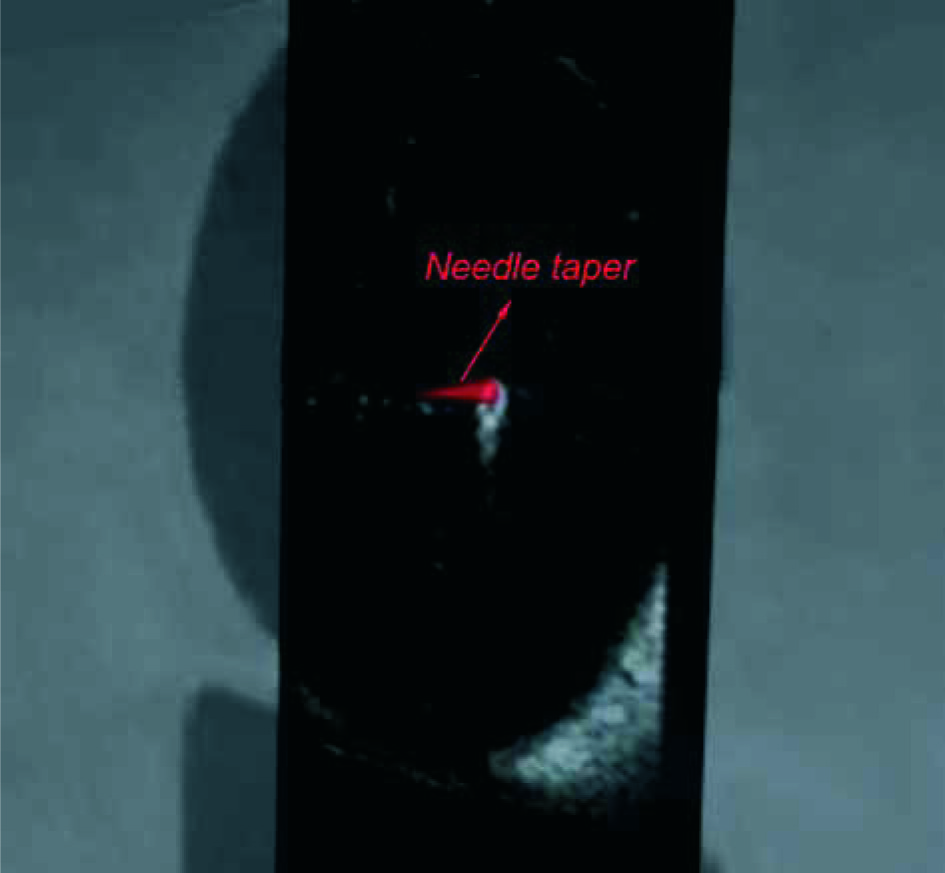
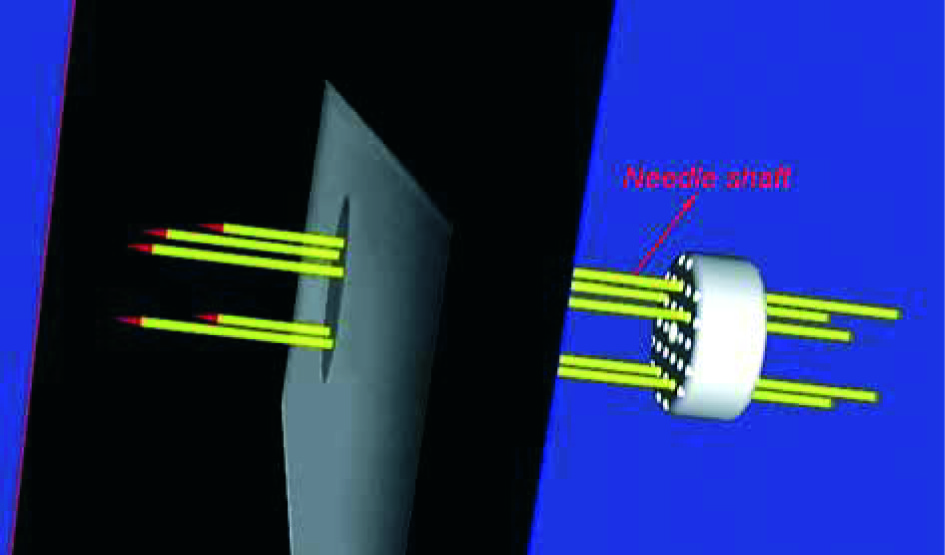
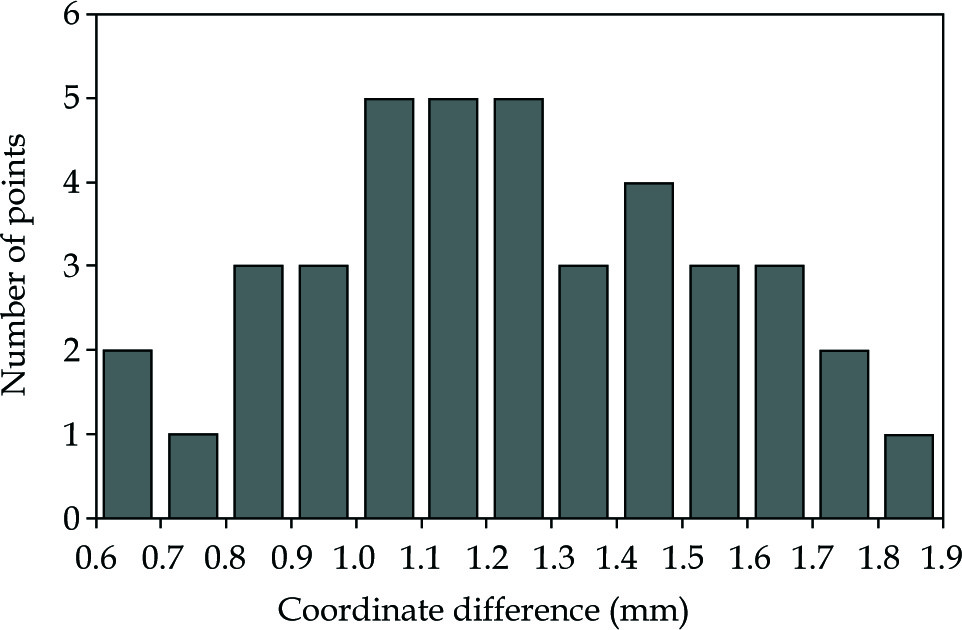
Figure 9 shows the workflow of the pelvic phantom study. On the foundation of registration accuracy validation between US images and MRI images, this study was to further verify the registration accuracy between real-time needle trajectories and needle trajectories in registered US images. A new pelvic phantom, identical to the previous one was created. This phantom was subjected to axial T2-weighted MRI scan with 1-mm slice gap and slice thickness without needle insertion. After US probe calibration, we conducted registration between MRI images and US images based on the markers’ outlines in MRI images. We placed the vaginal template on the phantom. After threading the micro sensor through a needle shaft to the interface between the shaft and taper, we inserted the needle through a peripheral channel into the uterus phantom. The real-time needle taper model in 3D MRI image space, which was shown as the red cone in Figure 10, was constructed by intercepting data from the electromagnetic tracker once per 60 milliseconds. During the needle insertion, we randomly selected 8 positions to cease the insertion and acquired the micro sensor’s coordinate data at each position. The transformed coordinates were the real-time coordinates in 3D MRI image space of the cone bottom’s center, which represented the real-time needle trajectory. After each cessation, we scanned the phantom by the US probe and adjusted it to coincide the registered US images with the cone bottom, as shown in Figure 10. We detected the center of the needle cross-section in this registered US image, which represented the needle trajectory in US images. By calculating the distance between the two kinds of coordinates, we obtained 8 differences in one needle insertion to reflect the coordinate differences between the two trajectories. Additionally, linear fitting for points in both trajectories was created and the angle difference between the two trajectories was calculated. In this study, five needles were inserted. We obtained 40 coordinate differences and 5 angle differences to reflect the matching degree of real-time needle trajectories and needle trajectories in registered US images. After each needle insertion, the micro sensor was threaded along the needle shaft to construct the shaft model and provide shaft information for dose planning. Figure 11 shows the construction of needle shafts in 3D MRI image space.
Results
Marker validation
The mean coordinate difference ± SD between CT images and registered US images for 60 marker sphere centers was 0.80 ±0.23 mm, as shown in Figure 12.
Pelvic phantom validation
The mean coordinate difference ± SD between MRI images and registered US images in the axial plane for 60 points was 1.01 ±0.22 mm, and the mean coordinate difference ± SD between MRI images and registered US images in the sagittal plane for 24 points was 1.14 ±0.20 mm, as shown in Figure 13.
Pelvic phantom study
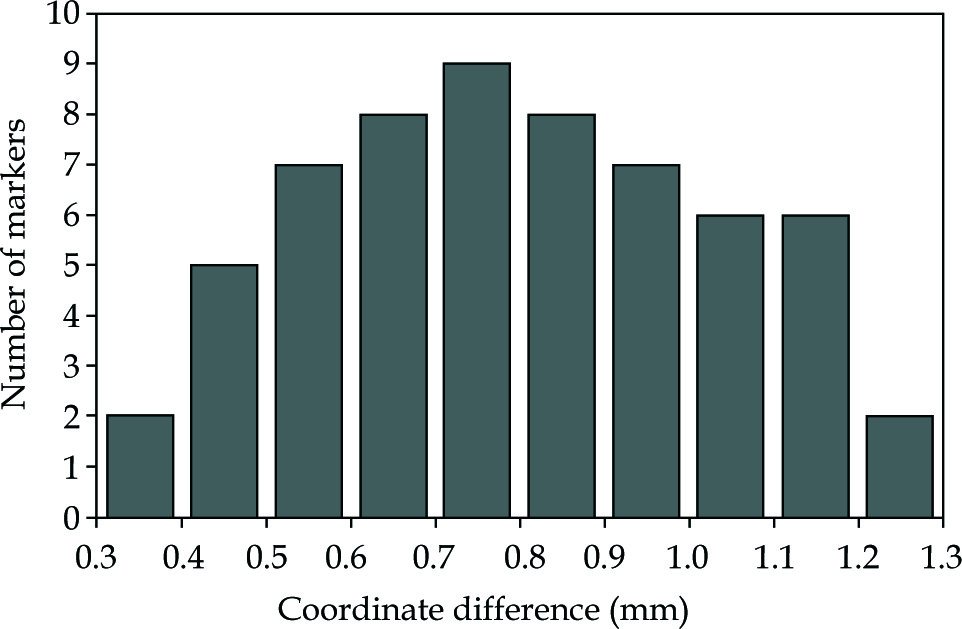
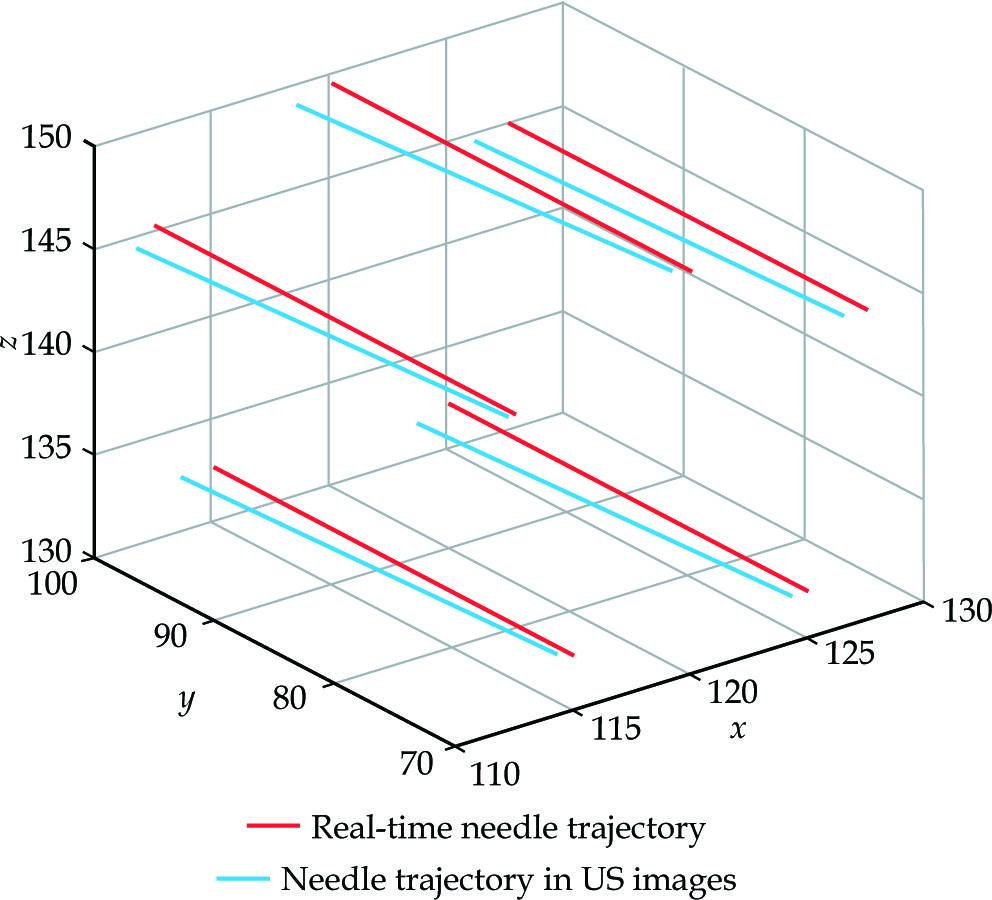
The mean coordinate difference ± SD between real-time needle trajectories and needle trajectories in registered US images was 1.25 ±0.31 mm for 40 points, as shown in Figure 14. The mean angle difference ± SD between real-time needle trajectories and needle trajectories in registered US images was 1.61 ±0.28 degrees for 5 needles. Figure 15 shows the real-time needle trajectories and needle trajectories in registered US images for the 5 needles after linear fitting.
Discussion
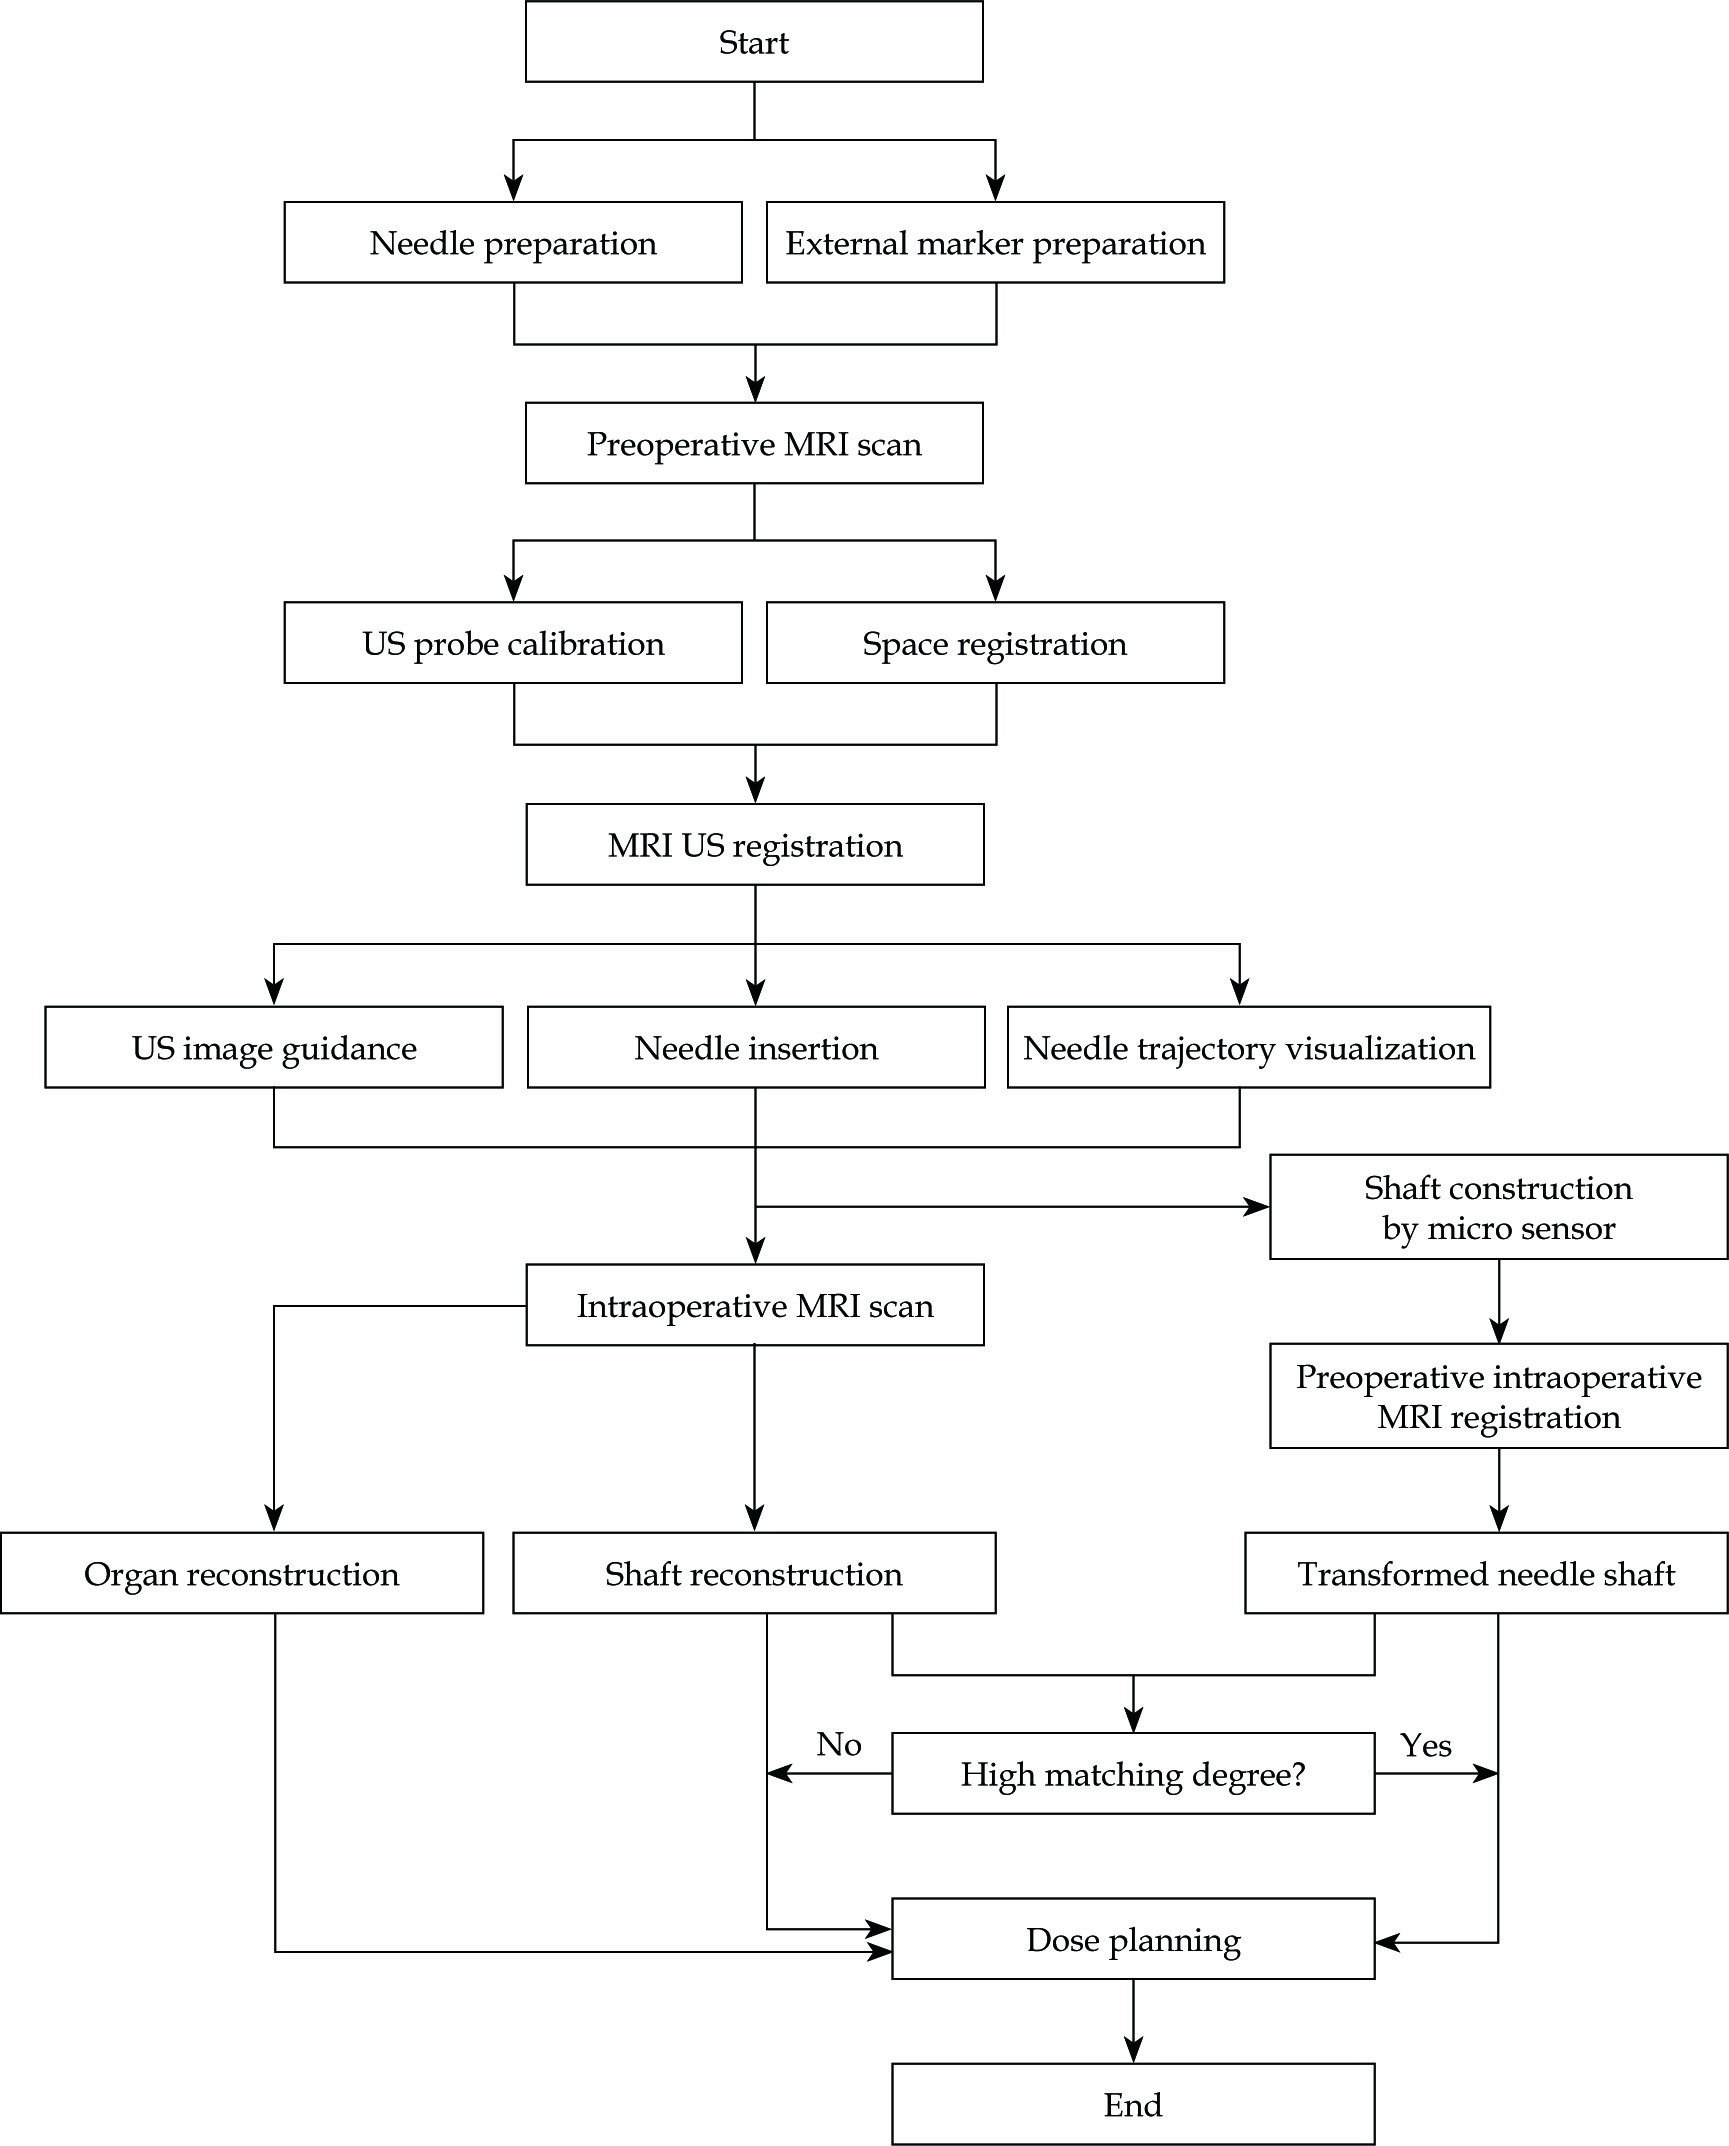
In this study, we verified that the US probe calibration, rigid registration between US images and MRI images, and registration between real-time needle trajectory and needle trajectory in US images had similar high accuracy under ideal scenarios. However, there are some limitations in our study. This section will focus on the limitations in our validations and approaches to address these limitations for clinical research. Figure 16 shows the prospective workflow for clinical research.
Preparation of needles
Due to the distortions of surrounding tissues caused by the titanium needle artifact [21], and because tumor delineation may be obscured by MRI signal cancellation of a titanium needle [22], traditional titanium needles have been removed from CT/MRI compatible equipment list by NIH [21]. Plastic needles are standard configuration for brachytherapy. Micro electromagnetic sensors can be used for clinical research to track the real-time needle trajectory, which are essential for precise and secure needle placement. Some institutions used plastic needles with metal obturators to assist insertion [23]. Since the obturator was inserted into the needle shaft during needle insertion and occupied the position of micro electromagnetic sensor, we plan to use 3D-printed needle tapers with threads at the bottom, which can connect to the plastic shafts to assist needle insertion in a clinical research. Shaft information is essential for needle reconstruction and dose planning. In our pelvic phantom validation, we filled the needles with agar mixture to make the shafts visible in intraoperative T2-weighted MRI images, and to avoid both the magnetic susceptibility artifact and US image artifacts. However, filling the needles with agar mixture is not possible for patient procedures. Zhang et al. produced MRI line markers using plastic tubes filled with medical saline, which were validated to provide the best visualization of needles in intraoperative T2-weighted MRI images [23]. This kind of MRI line marker also avoids artifacts in images and has the same effects as agar mixture. It will be inserted into our plastic needle after needle placement to reconstruct the needle shaft in intraoperative MRI images for patient procedures. Additionally, the micro sensor can also be used to construct the needle shaft in preoperative MRI image space by threading it along the shaft after needle placement. We assume that the registration between 3D preoperative MRI image space and 3D intraoperative MRI image space can bring the needle shafts constructed by the micro sensor and reconstructed by MRI line markers into one space. If the two modalities of shaft are confirmed to have high matching degree, we would prefer to use shaft information by micro sensor for dose planning, as the slice gap of MRI images may lead to information loss. Otherwise, we prefer to use shaft information by MRI line markers for dose planning. Organ information reconstructed by intraoperative MRI images is also added to dose planning.
Preparation of external markers
Plastic pellets, which are bright in CT images and dark in T2-weighted MRI images, were used as markers in our validations. However, this kind of marker was not available for patient procedures, as the external markers should be bright in T2-weighted MRI scans to be distinguished. We plan to produce plastic spherical shells filled with radionuclide liquid as external markers for patients. The radionuclide liquid is composed of medical saline and radionuclide to easily distinguish the external markers in T2-weighted MRI images. Syringes are used for air extraction and liquid injection. The external markers will be attached to the skin around the pelvis because the high rigidity of the pelvis is conducive to accuracy rigid registration. For registration between 3D preoperative MRI image space and electromagnetic location space, pelvic tilt and swelling are the limitations of rigid approach. To improve the registration accuracy, the patient’s body position in preoperative MRI scan and electromagnetic location space should be consistent, especially the scanned parts. The posture auxiliary devices including phantom, stereotactic frame, and vacuum bag provide good posture repeatability to maintain consistency of body postures.
Preparation of bionic phantom for US probe calibration
The mobility of pelvic organs such as differences in bladder and rectal filling, pelvic tilt or swelling, and deformation caused by US probe presence, are the inherent limitations of rigid registration between US images and MRI images, which may lead to unreliable intraoperative image guidance. Another limitation, which can also lead to unreliable image guidance is an error in US probe calibration. We used glycerin solution as liquid background in US probe calibration to adjust the speed of sound to approximately that in human tissues. However, in a patient’s procedure, the transabdominal ultrasound passes through the fat, muscle, soft tissues, and bladder filling, which is used as the acoustic window, before the uterus. By using the calibrated US probe to scan a real patient, distortions in US images can be caused because the mediums above are having different speeds of sound. Therefore, the US probe calibration results may not be applicable for patient procedures. A bionic phantom including different organs and tissues should be prepared. According to different speeds of sound in these mediums, gel mixtures of different compositions can be formed with molds. Additionally, linear markers should be fixed in this bionic phantom as features to be identified for US probe calibration. This bionic phantom can also be used to perform a phantom validation.
Inherent limitation in US images
The difficulty in identifying accurate features in US images is another limitation. The coherent properties of US images result in inherent noise, which not only lowers the image quality and influences diagnostic result, but also complicates image edge detection, feature extraction, and other subsequent processing steps. In our validations, extracting feature points accurately in US images related to reliable experimental results. The use of an efficient denoising algorithm in US images is the key point to avoid this limitation.
Conclusions
In this study, we demonstrated that under ideal conditions, rigid registration between MRI images and US images had high accuracy for real-time image guidance. Additionally, registered US images provided accurate image guidance during visual needle insertion in IC/IS gynecologic brachytherapy to achieve the combination of effective visualization and image guidance.


