
Introduction
The third-leading key driver of cancer-related fatalities globally is hepatocellular carcinoma (HCC), while it ranks first in Egypt. Liver cirrhosis is considered the single most significant risk factor for HCC development. The main contributory factor of cirrhosis and HCC development in Egypt is hepatitis C virus (HCV) infection [1].
Surveillance programs for HCC among cirrhotic patients are mandatory, as it usually presents clinically only in late stages when no curative options could be applied [2]. HCV treatment using directly acting antivirals does not eliminate the risk of HCC development, and hence, continuing HCC surveillance is necessary [3].
Current surveillance programs depend on liver ultrasonography (US) and α-fetoprotein (AFP) measurement. However, US is operator-dependent and has many limitations, especially in patients with liver steatosis, obesity, or liver heterogeneity, and when poor technique is applied. Moreover, AFP is neither adequately sensitive nor specific [3].
This highlights the urgent need for a highly sensitive and specific serum biomarker for early HCC detection to improve the likelihood of curative modalities such as resection, transplantation, or local ablation [4].
Annexin A2 is a member of the annexin family and is currently implicated in several carcinogenic processes [5]. It is a 36-kDa cytoskeletal protein of the annexin family that is found on the extracellular surface of different types of tumor cells [6]. It is considered to be a multifunctional protein that participates in DNA replication and repair, actin remodeling, endocytosis, exocytosis, membrane domain organization, signal transduction, mRNA transport, protein transcription, and assembly [7]. Annexin A2 is also involved in tumor cell migration, adhesion, and invasion processes [8, 9]. It is almost undetectable in the normal liver as well as the sera of healthy subjects [10].
Material and methods
Ethical approval
The study was carried out in accordance with the 2013 revision of the Declaration of Helsinki, and Good Clinical Practice guidelines. It was authorized by the Ethics Committee of the Faculty of Medicine, Alexandria University (IRB No. 00012098) and given a serial number of 0107435. Written informed consent was obtained from all participants.
Patients and study design
This case-control study was carried out in the Hepatobiliary and Pancreatic Division, Internal Medicine Department, Alexandria University Faculty of Medicine. Assuming a common standard deviation of 14.6, a one-way ANOVA power analysis (F test), at a significance level of 0.05, a sample size of 100 participants (25/group) was required to achieve 80% power to detect an overall difference of at least 0.35 ng/ml in the mean serum annexin A2 level among the four studied groups:
Group A (early HCC group): very early and early HCC treatment-naïve patients, BCLC stages 0 and A [11];
Group B (advanced HCC group): advanced HCC treatment-naïve patients, BCLC stage C [11];
Group C (cirrhosis without HCC group): patients with modified Child-Pugh class ailment cirrhosis without HCC;
Group D (healthy group): healthy individuals.
All the included patients (groups A, B, and C) had HCV-related cirrhosis, and all had previously achieved sustained virological response (SVR) using DAAs.
Patients with evidence of any malignancy other than HCC, those with a combined HBV infection, and those with active hepatitis C viremia were excluded.
All patients were subjected to a comprehensive evaluation, including medical history and examination focusing on the stigmata of chronic liver disease, laboratory investigations that included a complete blood count (CBC), blood urea, serum creatinine, serum albumin, total serum bilirubin, prothrombin activity, alanine transaminase (ALT), aspartate transaminase (AST), HCVAb, HCVRNA, HBsAg, serum AFP, and serum annexin A2, and imaging that included US and triphasic computed tomography of the liver (TR CT).
Alfa-fetoprotein (AFP) levels were measured using an enzyme immunoassay (Pishtaz Teb Diagnostics, Co.) for quantifying AFP in serum. An enzyme-linked immunosorbent test in solid phase serves as the basis for this kit. The assay system uses an anti-AFP antibody for solid-phase immobilization and a mouse monoclonal anti-AFP antibody in the antibody-enzyme conjugate solution.
Annexin A2 assay: SinoGeneClon Biotech Co., Ltd.’s human ANXA2 ELISA was used. This kit uses the sandwich ELISA technique. The biotin-conjugated anti-ANXA2 antibody was used as a detection antibody after pre-coating the anti-ANXA2 antibody.
Statistical analysis
IBM SPSS software package version 20.0 (Armonk, NY: IBM Corp.) was used. To detect the variations amongst several groups, a chi-square (χ2) test was used. In the event that more than 20% of the cells had an expected count of less than 5, a Monte Carlo correction test was employed as an alternative.
The Shapiro-Wilk test was used to assess the normality of continuous data. For normally distributed quantitative variables, a one-way ANOVA test was used to examine the differences between the various groups under study, and Tukey’s post-hoc test was used to compare the means between pairs of groups. Student’s t-test was employed to compare two groups. For non-normally distributed quantitative variables, group comparisons were made using the Kruskal-Wallis test, and pairwise multiple comparisons were made using the post-hoc Dunn’s test. The diagnostic performance of the markers was assessed using the receiver operating characteristic curve (ROC); an area larger than 50% indicates acceptable performance, and an area of around 100% indicates the best performance. Statistical significance was assessed at the 5% level.
Results
One hundred subjects were included in the study, 25 per group. There were no statistically significant differences between groups regarding age and sex. Male sex was predominant in the four groups (68% in the early HCC group, 68% in the advanced HCC group, 52% in the group of liver cirrhosis, and 56% in the healthy group), whereas the mean age was nearly 58 years in both HCC groups (groups A and B) and 56 years in the other two groups (groups C and D) (Table 1).
Table 1
Comparison between early, late hepatocellular carcinoma, and cirrhosis-only groups
| Parameter | Early HCC group (n = 25) | Advanced HCC group (n = 25) | Cirrhosis only group (n = 25) | Test of significance | p |
|---|---|---|---|---|---|
| Sex, n (%) | |||||
| Male | 17 (68) | 17 (68) | 13 (52) | χ2 = 1.824 | 0.402 |
| Female | 8 (32) | 8 (32) | 12 (48) | ||
| Age (years), mean ±SD | 58.44 ±4.81 | 58.88 ±4.25 | 56.72 ±4.66 | F = 1.555 | 0.218 |
| No. of focal hepatic lesions, n (%) | |||||
| Single | 11 (44) | 2 (8) | – | χ2 = 44.741* | MCp < 0.001* |
| Double | 12 (48) | 1 (4) | – | ||
| Triple | 2 (8) | 0 (0) | – | ||
| Multiple | 0 (0) | 22 (88) | – | ||
| Max. size of the largest lesion (cm), mean ±SD | 2.768 ±0.0743 | 6.14 ±0.72 | – | t = 20.653* | < 0.001* |
| AST (IU/l), median (IQR) | 42 (36-57) | 51 (36-64) | 33 (29-39) | H = 10.153* | 0.006* |
| Sig. bet. groups | p1 = 0.683, p2 = 0.011*, p3 = 0.003* | ||||
| ALT (IU/l), mean ±SD | 44.7 ±13.2 | 40.2 ±14.6 | 35.0 ±11.0 | F = 3.445* | 0.037* |
| Sig. bet. groups | p1 = 0.440, p2 = 0.028*, p3 = 0.350 | ||||
| Total serum bilirubin (mg/dl), median (IQR) | 0.9 (0.86-1.3) | 1.3 (0.9-1.6) | 1.1 (0.9-1.6) | H = 2.242 | 0.326 |
| Platelets (×103/mm3), median (IQR) | 179 (112-221) | 154 (112-185) | 134 (118-172) | H = 1.955 | 0.376 |
| Serum albumin (gm/dl), mean ±SD | 3.79 ±0.36 | 3.61 ±0.35 | 3.81 ±0.32 | F = 2.617 | 0.080 |
| INR ±SD | 1.15 ±0.12 | 1.22 ±0.17 | 1.22 ±0.16 | F = 1.698 | 0.190 |
| Modified Child-Pugh score, median (IQR) | 5 (5-5) | 5 (5-6) | 5 (5-5) | H = 5.785 | 0.055 |
| Model for end stage liver disease, mean ±SD | 8.84 ±2.17 | 10.36 ±2.68 | 9.64 ±2.41 | F = 2.449 | 0.094 |
| Albumin bilirubin grade (ALBI score), n (%) | |||||
| 1 | 7 (28) | 3 (12) | 4 (16) | χ2 = 2.137 | MCp = 0.422 |
| 2 | 18 (72) | 22 (88) | 21 (84) | ||
SD – standard deviation, IQR – interquartile range, χ2 – chi square test, MC – Monte Carlo, t – Student’s t-test, F – F for one-way ANOVA test, pairwise comparison between each 2 groups was done using a post hoc test (Tukey), H – H for Kruskal-Wallis test, pairwise comparison between each 2 groups was done using a post hoc test (Dunn’s test for multiple comparisons)
All included patients had received DAAs and achieved SVR at least 5 years before HCC detection (the range was 5-8 years). The median duration between SVR and HCC detection was 6 years in the early HCC group, 6.5 years in the advanced HCC group, and 6 years in the cirrhosis-only group.
Regarding the number of HCC lesions in the early HCC group, 44% of cases had a single lesion, 48% of cases had 2 lesions, and the rest had 3 lesions. The mean size of the largest lesion in this group was 2.768 ±0.0743 cm (Table 1).
The median Child-Pugh class score of the included cirrhotic subjects was 5. The median ALBI grade and MELD score were not significantly different among the three diseased groups. In the early HCC group, 72% of cases were ALBI grade 2, and the rest were ALBI grade 1, |and 88% of subjects in the advanced HCC group and 84% of subjects in the cirrhosis-only group were ALBI grade 2. The mean MELD scores of the early HCC group were 8.84 ±2.17, 10.36 ±2.68 in the advanced HCC group, and 9.64 ±2.41 in the cirrhosis-only group (Table 1).
Regarding laboratory findings, including platelet count, international normalized ratio (INR), albumin, and total serum bilirubin, there was no significant difference among the three diseased groups (Table 1).
With reference to AST levels, they were significantly higher in the early and the advanced HCC groups than in the liver cirrhosis-only group (p = 0.011 and p = 0.003, respectively); on the other hand, ALT levels were significantly higher only in the early HCC group when compared to the liver cirrhosis-only group (p = 0.028) (Table 1).
Characteristics of the healthy control group (group D) are shown in Table 2.
Table 2
Characteristics of the healthy control group (group D) (n = 25)
Serum AFP levels were significantly higher in the early and the advanced HCC groups compared to the healthy group (group D) (p < 0.001). There was no significant difference between the levels of AFP in the early HCC group and the cirrhosis-only group (p = 0.356); on the other hand, there was a significant difference in their levels in the advanced HCC group compared to the cirrhosis-only group (p = 0.035) (Table 3A, B).
Table 3A
Comparison between the four studied groups according to α-fetoprotein and annexin A2 levels
Table 3B
Pairwise comparison between each group according to α-fetoprotein and annexin A2 levels using the post-hoc Dunn’s multiple comparisons for the Kruskal-Wallis test
| Parameter | A vs. B | A vs. C | B vs. C | A vs. D | B vs. D | C vs. D |
|---|---|---|---|---|---|---|
| α-fetoprotein (ng/ml) | 0.237 | 0.356 | 0.035* | < 0.001* | < 0.001* | < 0.001* |
| Annexin-A2 (ng/ml) | 0.003* | 0.005* | < 0.001* | < 0.001* | < 0.001* | 0.002* |
At a cut-off point > 12 (ng/ml) on ROC curve analysis, AFP is a statistically significant discriminator between HCC patients (group A + B) and patients with liver cirrhosis (group C), with an area under the ROC curve (AUC) = 0.670 (95% CI: 0.550-0.789) (p = 0.017), sensitivity of 60.00%, specificity of 76.00%, positive predictive value (PPV) of 83.30%, negative predictive value of (NPV) of 48.70%, but at the same cut-off point AFP is not a significant discriminator of subjects with early HCC (group A) from patient of liver cirrhosis (group C), with AUC = 0.619 (95% CI: 0.450-0.783) (p = 0.148), a sensitivity of 52.00%, a specificity of 76.00%, a PPV of 68.40%, and an NPV of 61.30% (Figs. 1 and 2, Tables 4 and 5).
Fig. 1
ROC curve for α-fetoprotein and annexin A2 to discriminate patients with HCC (group A + B) (n = 50) from patients with liver cirrhosis without HCC (group C) (n = 25)
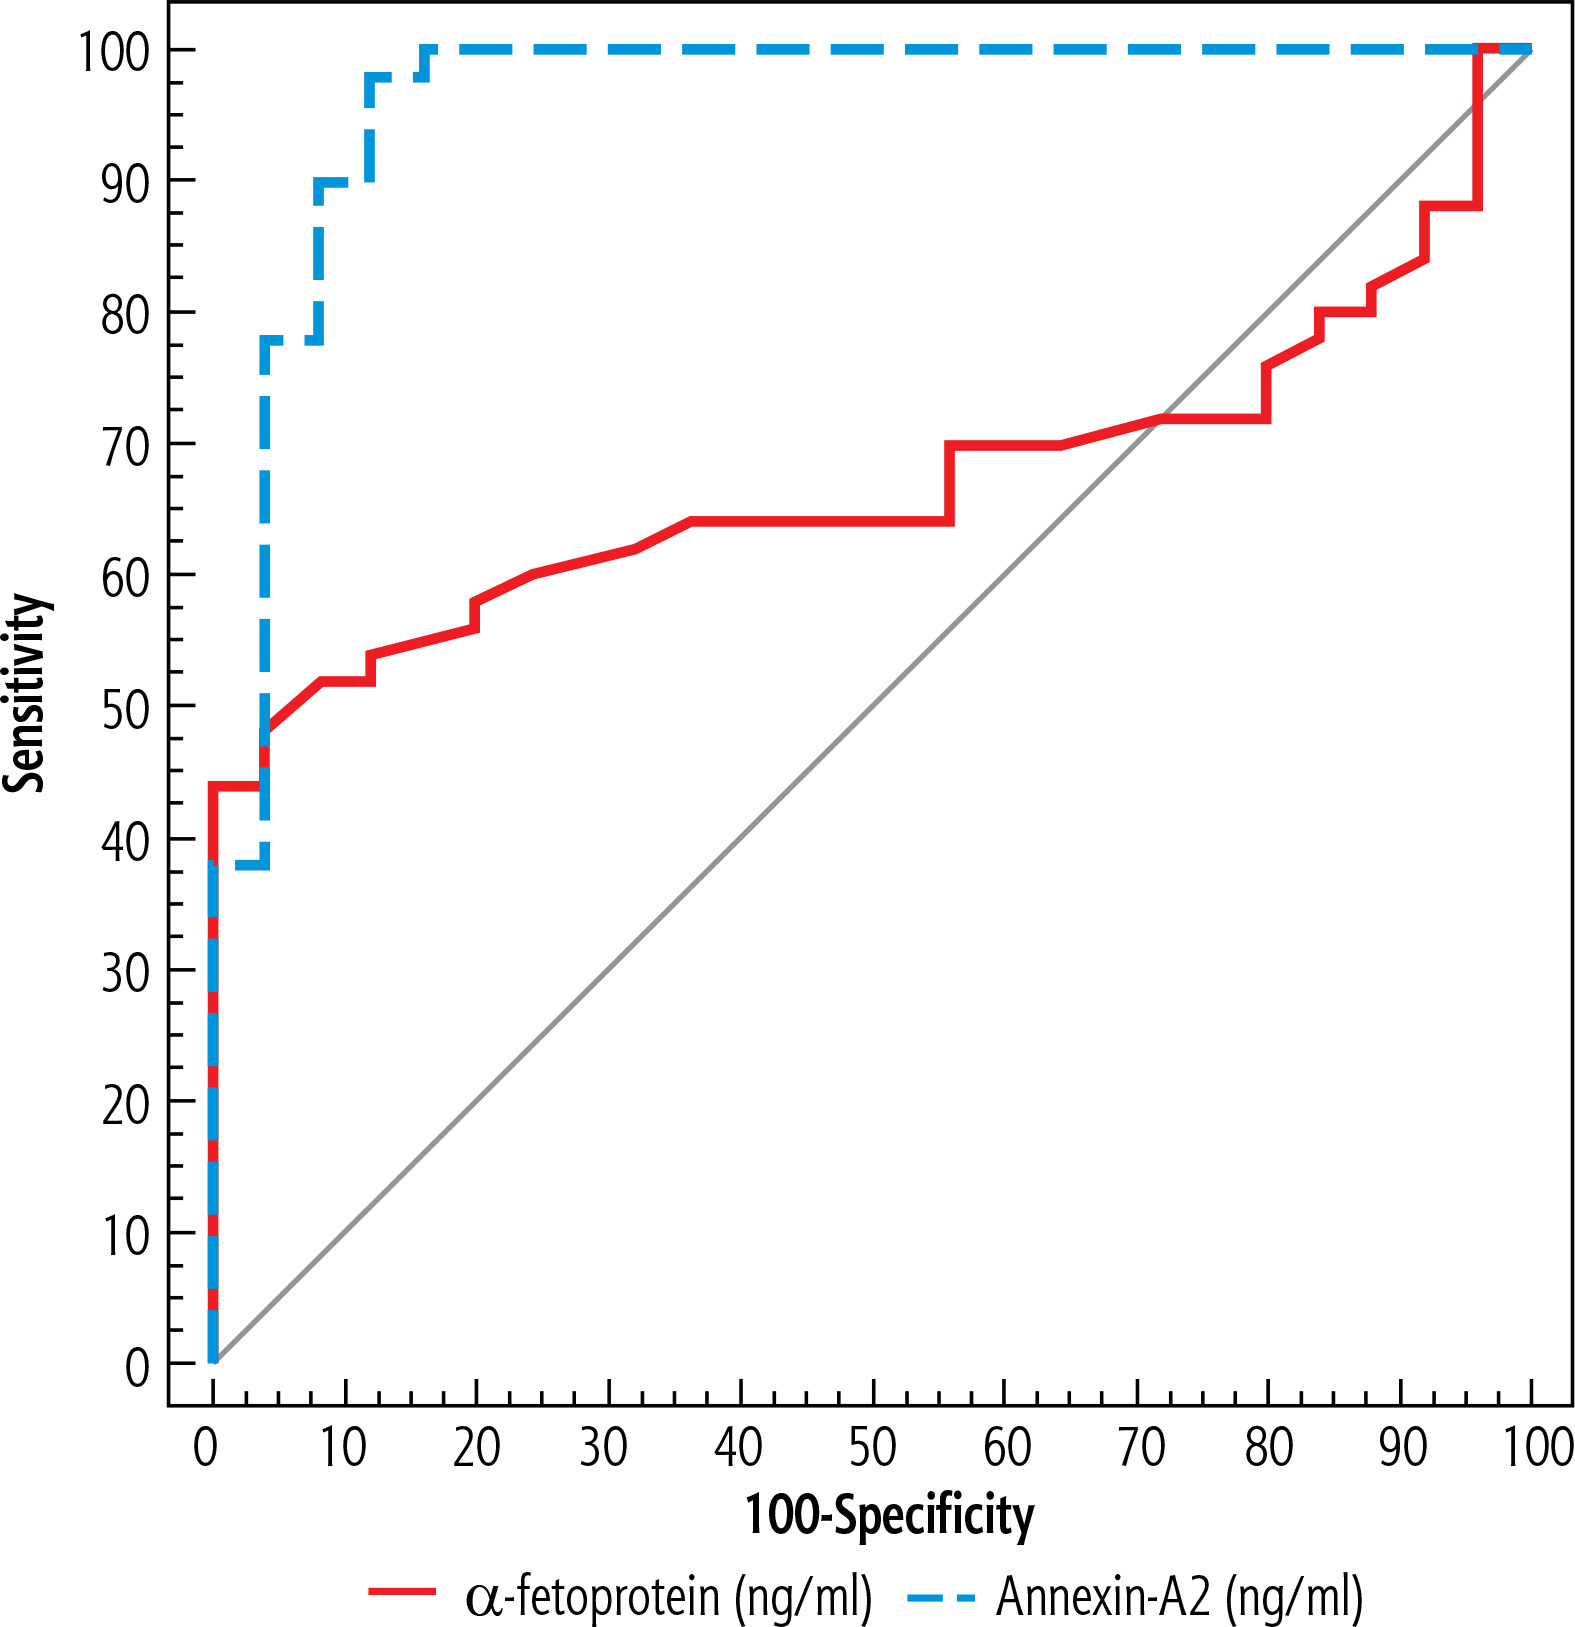
Fig. 2
ROC curve for α-fetoprotein and annexin A2 to discriminate patients with early HCC (group A) (n = 25) from liver cirrhosis patients without HCC (group C) (n = 25)
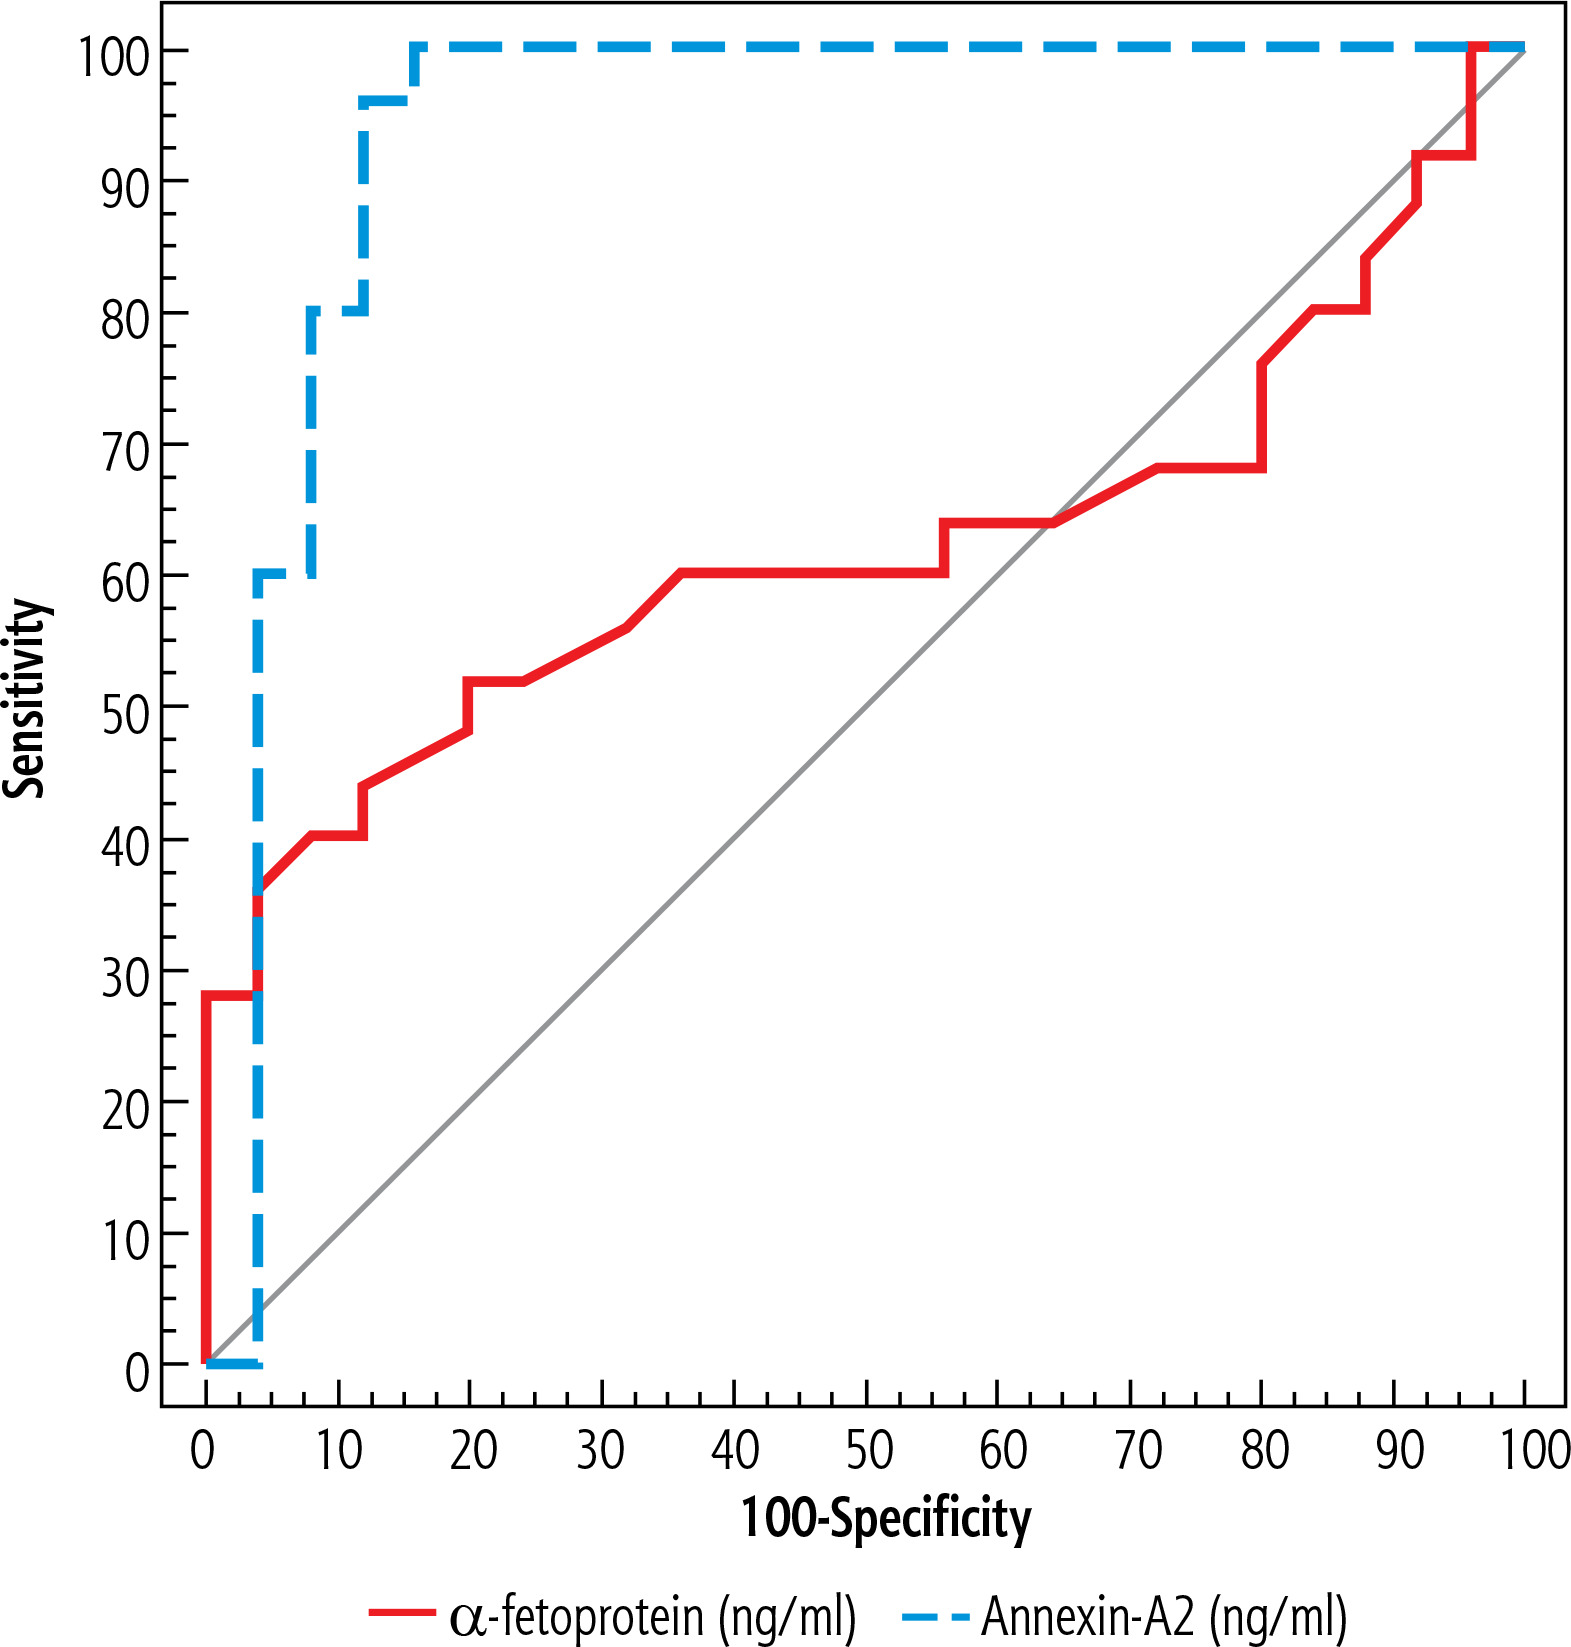
Table 4
Diagnostic performance of α-fetoprotein and annexin A2 to discriminate patients with HCC (group A + B) (n = 50) from liver cirrhosis patients without HCC (group C) (n = 25)
| Parameter | AUC | p | 95% CI | Cut-off# | Sensitivity | Specificity | PPV | NPV |
|---|---|---|---|---|---|---|---|---|
| α-fetoprotein (ng/ml) | 0.670 | 0.017* | 0.550-0.789 | > 12 | 60.00 | 76.00 | 83.3 | 48.7 |
| Annexin-A2 (ng/ml) | 0.962 | < 0.001* | 0.910-1.000 | > 7.7 | 98.0 | 88.0 | 94.2 | 95.7 |
Table 5
Diagnostic performance of α-fetoprotein and annexin A2 to discriminate patients with early HCC (group A) (n = 25) from liver cirrhosis patients without HCC (group C) (n = 25)
| Parameter | AUC | p | 95% CI | Cut-off | Sensitivity | Specificity | PPV | NPV |
|---|---|---|---|---|---|---|---|---|
| α-fetoprotein (ng/ml) | 0.619 | 0.148 | 0.455-0.783 | > 12 | 52.0 | 76.0 | 68.4 | 61.3 |
| Annexin-A2 (ng/ml) | 0.934 | < 0.001* | 0.851-1.000 | > 7.7 | 96.0 | 88.0 | 88.9 | 95.7 |
Serum annexin A2 levels were significantly higher among the early and the advanced HCC groups compared to the group of healthy participants (group D) (p < 0.001). Annexin A2 levels were also significantly higher among the early and advanced HCC groups as compared to the cirrhosis-only group (p = 0.005 and p < 0.001, respectively). Moreover, annexinA2 levels were significantly higher in the advanced HCC group compared to the early HCC group (p = 0.003). Annexin A2 was also higher in the cirrhosis-only group than in the healthy group (p = 0.002) (Table 3A, B).
At a cut-off point > 7.7 (ng/ml) on ROC curve analysis, serum annexin A2 is a statistically excellent discriminator between HCC patients (group A + B) and patients with liver cirrhosis (group C) with an AUC of 0.962 (95% CI: 0.910-1.000) (p < 0.001), a sensitivity of 98.00%, a specificity of 88.00%, a PPV of 94.2%, and an NPV of 95.7%. At the same cut-off point, annexin A2 is a statistically significant discriminator between subjects with early HCC (group A) and those with liver cirrhosis (group C), with an AUC of 0.934 (95% CI: 0.851-1.000) (p > 0.001), a sensitivity of 96.00%, a specificity of 88.00%, a PPV of 88.90%, and an NPV of 95.7% (Figs. 1 and 2, Tables 4 and 5).
Discussion
The overarching goal of all researchers and clinicians working within the HCC field is the early detection of HCC to promote the patients’ wellbeing, reduce mortality and morbidity, and achieve a curative modality of treatment [12]. Alpha-fetoprotein has continued to be the most frequently used serum biomarker since its discovery, yet there are several limitations to its use that make finding a more sensitive and specific biomarker necessary [13]. Abdominal US is a good method to detect focal hepatic lesions, but it is operator-dependent; also, obesity and cirrhosis itself can limit this technique [14].
The expression of annexin A2 varies between normal and malignant tissues, suggesting a probable role for it in the progression of tumors. Breast, liver, prostate, and pancreatic cancers have all been linked to elevated annexin A2 expression [15].
In our study, AFP was significantly higher in the advanced HCC group compared to the cirrhosis-only group, but there was no significant difference in the level of AFP in early HCC in comparison to cirrhosis-only patients (p = 0.356). This result is similar to the results reported by Shang et al. [16] and El-Gezawy et al. [17], who clarified that one of the restrictions on the use of AFP for the surveillance of HCC is its escalation in those with chronic liver disease who do not have HCC. Galle et al. [18] stated that screening for HCC with AFP is not ideal, because AFP levels are within the normal range in approximately 30% of patients with HCC and may also be elevated for reasons unrelated to the tumor, such as chronic liver disease. Contrary to the present study, Marrero et al. [19], Hanno et al. [20], and Shaker et al. [10] reported that AFP serum levels were significantly higher in early HCC subjects in contrast to patients with liver cirrhosis. This was corroborated by Chi et al. [21], who concluded that AFP levels were much higher in BCLC-C HCC in comparison to early HCC.
Although AFP at a cut-off point of 12 ng/ml was a significant discriminator between HCC patients and cirrhosis-only patients, the sensitivity was only 60%. Moreover, considering only early HCC, the sensitivity of AFP at the same cut-off point dropped to 52%.
In the current study, serum annexin A2 levels were significantly higher in the early and the advanced HCC groups than the healthy group (p < 0.001, p < 0.001, respectively). This outcome is akin to that of Shaker et al. [10] and Ibrahim et al. [22].
Here, serum annexin A2 was significantly higher among HCC groups in contrast to the liver cirrhosis and the healthy control groups. These findings are identical to those of Shaker et al. [10] and Zhang et al. [23], who attributed the elevation of serum annexin A2 in participants with HCC to the upregulation of the ANXA2 gene in HCC [7]. Contrary to these results, Liu et al. [24] stated that serum annexin A2 was not a good marker for HCC among liver cirrhosis participants, as there was no significant difference in its levels between cirrhosis and HCC groups. However, in this study, the cause of liver cirrhosis was HBV, not HCV.
The current study also found that serum annexin A2 levels were notably higher in the advanced HCC group than in the early HCC group. This adds to the cumulative evidence about the involvement of annexin A2 in promoting the progression of different tumors [25, 26].
ROC curve analysis revealed that annexin A2 is a potentially worthy biomarker for HCC. At a cut-off point of 7.7 ng/ml, it can discriminate patients with HCC (regardless of stage) with a sensitivity of 98% and an NPV of 95.7%. Considering only early HCC, the sensitivity was still high (96%) with the same NPV. These findings agree with those of Shaker et al. [10], Ibrahim et al. [22], Zhang et al. [23], and Hanno et al. [20], who reported high sensitivity of annexin A2 to detect early HCC.
Egypt launched an HCV treatment program using DAAs in October 2014. The number of patients who were registered for treatment reached 1,500,000 by the end of November 2016. The program was reinforced again in 2018 with a mass screening campaign that resulted in treating about 4.5 million people by the end of 2020 [27]. One of the interesting observations in our study is that the median time between SVR and study enrollment was 6 years in the early HCC group, 6.5 years in the advanced HCC group, and 6 years in the cirrhosis-only group. This noteworthy observation reflects the success of these programs in effectively managing the majority of HCV patients in Egypt within a short period, culminating in the country becoming the first to attain the WHO gold tier status on the path to HCV elimination [27].
One of the strengths of our study is working specifically on HCV-related cirrhosis patients after HCV treatment using DAAs. HCV treatment does not eliminate the risk of HCC development, and in the era of widely available DAAs, it is important to put in place good surveillance strategies for early detection of HCC in this broad category of patients [28]. Other studies on annexin A2 were either performed on untreated HCV patients or the authors did not mention the status of HCV infection upon inclusion. Moreover, we suspect that HCV treatment and the subsequent changes in inflammatory dynamics might change the cut-off points of serum annexin A2. One of the limitations of our study is the small sample size. We recommend further multi-center studies to confirm the role of annexin A2 in the surveillance of HCC among cirrhotic patients after HCV treatment using DAAs. Because of the sample size limitation, we did not include patients with intermediate stage HCC (BCLC-B), as our aim was to compare early stages and advanced stage vs. patients without HCC. We recommend future studies to include BCLC-B patients for more profound analysis of annexin-A2 measurements in the diagnosis and assessment of HCC. In conclusion, serum annexin A2 is a promising biomarker that can improve the sensitivity of HCC detection among patients with liver cirrhosis after HCV eradication using DAAs.


