Introduction
Stress urinary incontinence (SUI), characterized by the involuntary leakage of urine during physical exertion or increased abdominal pressure, is a prevalent and burdensome condition affecting more than 30% of adult women in the United States [1, 2]. It is characterized by involuntary urine leakage, particularly during physical exertion or activities that increase abdominal pressure, such as sneezing or exercising [3]. Stress urinary incontinence is associated with substantial costs and the implications of SUI extend beyond physical discomfort [4]. It negatively affects the quality of life of those affected, leading to emotional distress, social isolation, and decreased participation in daily activities [5, 6]. Advanced age, childbirth experiences (including vaginal deliveries), and the menopausal transition are well-established risk factors for the development of SUI. The aetiology of SUI is multifactorial, encompassing not only these factors but also genetic predisposition, obesity, chronic conditions that increase intra-abdominal pressure (e.g., chronic cough, constipation), and connective tissue disorders [7–10].
Emerging evidence suggests that metabolic dysregulation may play a role in the pathophysiology of pelvic floor disorders, including SUI. Conditions such as obesity, diabetes, and metabolic syndrome have been implicated in altering the structure and function of pelvic floor support mechanisms [11, 12]. The triglyceride-glucose (TyG) index – a validated surrogate of insulin resistance calculated from fasting triglycerides and glucose – has demonstrated significant associations with cardiometabolic disorders including cardiovascular disease, chronic kidney disease, and non-alcoholic fatty liver disease [13–15]. To enhance clinical utility, adiposity-integrated derivatives (TyG-body mass index (BMI), TyG-waist circumference (WC), and TyG-waist-to-height ratio (WHtR)) have been developed, showing improved predictive capacity for metabolic outcomes compared to the original TyG index [16–20]. Despite extensive research on TyG indices in cardiometabolic contexts, critical knowledge gaps persist regarding urological applications. Furthermore, evidence linking modifiable metabolic markers to SUI remains limited in nationally representative cohorts.
Therefore, this study aimed to investigate the association between the TyG index and its adiposity-combined indices (TyG-BMI, TyG-WC, TyG-WHtR) and the prevalence of SUI among U.S. adult women. To address these gaps, this cross-sectional study leveraged the National Health and Nutrition Examination Survey (NHANES 2001–2023) to conduct comprehensive assessment of TyG and its clinically accessible derivatives (TyG-BMI, TyG-WC, TyG-WHtR) in relation to SUI among U.S. women.
Material and methods
Study design and data source
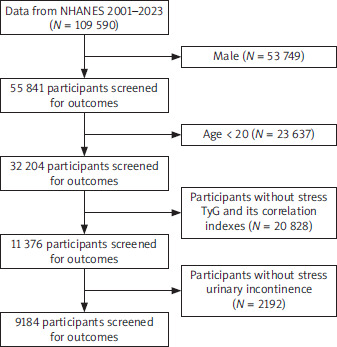
The data for this cross-sectional study were obtained from the NHANES, which is designed to evaluate the health and nutritional status of the general U.S. population. The National Health and Nutrition Examination Survey gathers extensive data on diverse areas, such as demographics, financial status, and public health. As shown in the flowchart, we initially included 109,590 people across ten cycles from 2001 to 2023. We excluded men, individuals under 20 years old, individuals with missing TyG and related indicators, and individuals with missing SUI data. Ultimately, the analysis included 9,184 individuals as shown in Figure 1. Reporting of this study followed the STROBE (Strengthening the Reporting of Observational Studies in Epidemiology) statement [21]. The datasets generated and analysed in the current study are available at the NHANES website: https://wwwn.cdc.gov/nchs/nhanes/Default.aspx.
Assessment of stress urinary incontinence
Stress urinary incontinence I was assessed via self-reported data from the Kidney Conditions – Urology file. Participants were identified as having SUI if they responded affirmatively to item KIQ042: “Do you leak urine during physical activities (e.g., coughing, lifting, or exercise)?” [22].
Calculation of triglyceride-glucose correlation indices
The triglyceride-glucose index and its derivatives were calculated as follows [23]:
Assessment of covariates
The research assessed covariates including: age; ethnicity; poverty income ratio (poor [< 1.0], nearly poor [1.0–1.9], middle income [2.0–3.9], high income [≥ 4.0]); education level (below high school, high school, above high school); smoking status (never, former, current); alcohol use (never, former, current); physical activity; vaginal deliveries; hypertension (defined as systolic/diastolic blood pressure ≥ 140/90 mm Hg, current antihypertensive medication use, clinician-diagnosed hypertension, or self-reported prescription antihypertensive use regardless of current blood pressure levels), diabetes mellitus (diagnosed by clinician assessment, HbA1c ≥ 6.5%, fasting glucose ≥ 7.0 mmol/l, random glucose ≥ 11.1 mmol/l, 2-hour oral glucose tolerance test glucose ≥ 11.1 mmol/l, or current glucose-lowering medication/insulin therapy); and menopausal status.
Statistical analysis
Categorical data are presented as frequency (%), continuous variables as mean ± standard deviation or median. Adult women were grouped by SUI status, and group differences were compared using ANOVA, Kruskal-Wallis, or χ2 tests. Triglyceride-glucose and related indices (TyG-BMI, TyG-WC, TyG-WHtR) were analysed as continuous variables and tertiles (T1–T3). Multivariate logistic regression assessed their association with SUI. Triglyceride-glucose-BMI and TyG-WC were scaled per 100 units due to large magnitudes, preserving data trends. Results are reported as odds ratio (OR) (95% CI). Three adjustment models were constructed. Nonlinear associations were examined using smooth curve fitting.
Subgroup analysis was performed according to age (< 60, ≥ 60), ethnicity, education level, physical activity, smoking status, alcohol status, hypertension, diabetes, vaginal deliveries (< 3, ≥ 3) and menopause status. Sensitivity analyses were conducted to verify robustness. Covariates with missing values < 1% were retained without imputation. For categorical variables with > 1% missing data, missing values were categorized as a separate “Missing” group to preserve sample size and minimize bias. All statistical analyses were performed using EmpowerStats software (X&Y Solutions, Inc., Boston, MA, USA). The two-sided p-values less than 0.05 were considered statistically significant.
Results
Baseline characteristics
Table 1 describes the study population (n = 9,184), which included 3,836 women (41.76%) who reported SUI. Compared to women without SUI, those with SUI were significantly older and had higher mean levels of all TyG indices (TyG, TyG-BMI, TyG-WC, and TyG-WHtR; all p < 0.001). Significant differences were also observed in ethnicity, education level, smoking and alcohol status, physical activity, hypertension, diabetes, and menopause status (higher prevalence in SUI). Vaginal deliveries were also more frequent in the SUI group (≥ 3). Only the poverty income ratio showed no significant difference (p = 0.079).
Table 1
Characteristics of the study population
[i] TyG – triglyceride level, TyG-BMI – triglyceride - body mass index, TyG-WC – triglyceride - waist circumference, TyG-WHtR – triglyceride - waist-to-height ratio Among the 9184 patients, the number of missing values for the covariates were 793 (8.63%) for poverty income ratio; 7 (0.08%) for education level; 7 (0.08%) for smoking status; 401 (4.38%) for alcohol status; 2720 (29.62%) for physical activity; 369 (4.02%) for diabetes mellitus; 3586 (39.05%) for vaginal deliveries; 15 (0.16%) for menopause status.
Association between triglyceride-glucose indices and stress urinary incontinence
Table 2 shows significant positive correlations between all TyG indices (TyG, TyG-BMI, TyG-WC, and TyG-WHtR) and SUI in progressively adjusted models. Strong dose-response relationships were evident, with significantly increasing odds of SUI observed across tertiles for each index (all p-value for trend < 0.001). Participants in the highest tertile (T3) exhibited a substantially elevated SUI risk compared to those in the lowest tertile (T1) in all models. These significant positive associations persisted after adjusting for sociodemographic, behavioural, and clinical confounders in the fully adjusted model (Model 3). Among all indices examined, TyG-BMI demonstrated the strongest association with SUI risk.
Table 2
Relationship between triglyceride-glucose index and its correlation indices and stress urinary incontinence
[i] TyG – triglyceride level, BMI – body mass index per 100-unit increase, WC – waist circumference per 100-unit increase, WHtR – waist-to-height ratio
Model 1 – no adjustments made
Model 2 – adjusted for age, ethnicity, poverty income ratio, education level
Model 3 – adjusted for age, ethnicity, poverty income ratio, education level, smoking status, alcohol status, physical activity, hypertension, diabetes mellitus, vaginal deliveries, menopause status
Nonlinear relationships
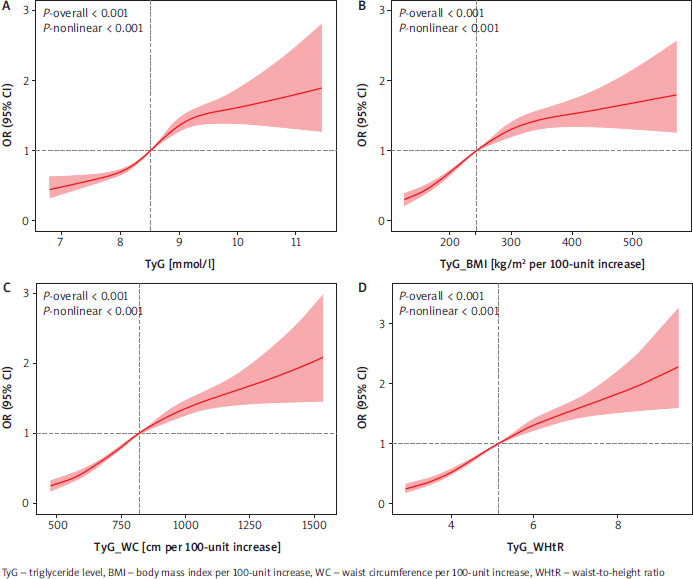
The results of the smooth curve fitting are shown in Figure 2, TyG and its correlation indices had a significant non-linear relationship with SUI (p < 0.001).
Subgroup analyses
Figure 3 illustrates that the subgroup analyses consistently demonstrate a robust relationship between the TyG and its correlation indices and SUI across various demographic and clinical groups. This consistency underscores the reliability of these associations.
Figure 3
Subgroup analysis. The relationship between TyG (A), TyG-BMI (B), TyG-WC (C), TyG-WHtR (D) and stress urinary incontinence in different groups
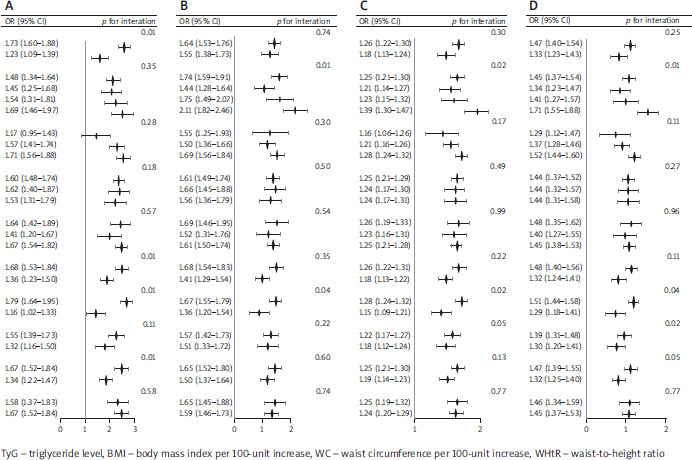
Notably, significant interaction effects were observed in several analyses. Specifically, for the TyG index, age yielded a strong interaction (p = 0.01), indicating a greater association with SUI among individuals under 60. Ethnicity influenced the relationship for TyG-BMI (p = 0.01) and TyG-WHtR (p = 0.01), highlighting variability across different racial groups. Additionally, the interaction of diabetes mellitus with TyG-BMI (p = 0.04) and TyG-WHtR (p = 0.04) suggests that individuals with diabetes exhibit a stronger link to SUI. Vaginal deliveries also influenced the TyG-WHtR relationship (p = 0.02). Collectively, these findings affirm the strength and consistency of triglyceride-related indices regarding SUI while acknowledging the complexities introduced by specific subgroup characteristics.
Discussion
This study investigated the association between TyG indices and SUI among American adult women, utilizing data from the NHANES spanning from 2001 to 2023. Our findings revealed a significant prevalence of SUI (41.77%) in the study population, with higher TyG indices correlating with increased odds of SUI. Specifically, the highest tertiles of TyG, TyG-BMI, TyG-WC, and TyG-WHtR were associated with elevated risks of SUI, indicating that these indices may serve as independent risk factors and potential screening tools for SUI in women. The study highlights the importance of metabolic health in understanding pelvic floor disorders and suggests that TyG-derived indices could be valuable in clinical settings. Critically, our results establish a clear, dose-dependent positive relationship: elevated levels of the selected indices – TyG, TyG-BMI, TyG-WC, and particularly TyG-WHtR – are consistently and independently associated with a higher prevalence of SUI.
Recent studies have begun exploring metabolic dysregulation in SUI pathogenesis. Huang et al. [24] conducted a parallel NHANES-based study (2005–2018) focusing exclusively on postmenopausal women. They reported that TyG-BMI and TyG-WHtR were significantly associated with SUI risk, with TyG-BMI demonstrating the highest diagnostic accuracy (area under the curve (AUC) = 0.582), while baseline TyG showed no significant correlation after adjustment – a finding contrasting with our results. Concurrently, Pu et al. [25] utilizing NHANES data (2011–2018) encompassing a broader adult female cohort (n = 4,459), established a positive association between the TyG index and SUI prevalence. Li et al. [22] further examined TyG-BMI across all UI subtypes (SUI/UUI/MUI) in a general adult cohort (2001–2018), confirming TyG-BMI as an independent risk factor for SUI (OR = 2.36 for Q4 vs. Q1). Our study significantly expands the scope by incorporating multiple adiposity-combined indices (TyG-BMI, TyG-WC, TyG-WHtR) within a substantially larger cohort (n = 9,184). Our work advances the field by: (1) demonstrating the pronounced superiority of adiposity-combined indices (particularly TyG-BMI, OR = 2.50 for T3 vs. T1) over the baseline TyG index in predicting SUI risk across the general female population, (2) establishing TyG-WHtR’s enhanced diagnostic utility (AUC = 0.619) relative to other TyG measures in this context, and (3) uncovering significant metabolic-subgroup interactions (e.g., age, ethnicity, diabetes status, vaginal delivery history) that refine SUI risk stratification beyond what previous studies, including Pu et al. [25], have reported.
This association may be underpinned by the metabolic dysregulation reflected in elevated TyG indices, which can promote chronic inflammation and oxidative stress, potentially compromising the integrity and function of pelvic floor supportive tissues. Interventions targeting metabolic health, such as dietary modification and physical exercise, have been shown to ameliorate similar inflammatory and metabolic disturbances in other conditions, suggesting a plausible pathway for intervention in SUI [26, 27]. Triglyceride-glucose indices serve as indicators of insulin resistance, a condition that can contribute to pelvic floor dysfunction through mechanisms such as neuro-mitochondrial impairment and chronic inflammation. Elevated insulin levels, characteristic of insulin resistance, can disrupt the phosphoinositide 3-kinase/protein kinase B signalling cascade, potentially impairing mitochondrial function in peripheral neurons that control bladder function. This disruption could lead to oxidative stress and apoptosis of urethral sphincter myocytes, which diminishes their contractile efficacy [28, 29].
Adipose tissue, particularly visceral fat, produces pro-inflammatory cytokines such as tumor necrosis factor α and interleukin-6, which play a detrimental role in degrading pelvic collagen and weakening supportive structures through the activation of matrix metalloproteinases [30]. Concurrently, central obesity, as measured by BMI, WC, and WHtR, may exacerbate these effects. Research indicates that increased intra-abdominal pressure can impose chronic biomechanical strain on the pelvic floor, leading to stretching of connective tissues and potential compression of pudendal nerves, further complicating pelvic function [29, 31]. Some murine studies also suggest that there may be an association between elevated TyG-BMI and urethral sphincter atrophy, as well as a decrease in pelvic muscle electromyographic activity [31].
Furthermore, the weakening of the association between TyG indices and SUI in postmenopausal women suggests a complex interplay between hormonal factors and metabolic dysregulation affecting bladder control. The protective role of oestrogen in maintaining pelvic floor function could explain this phenomenon [24]. Some studies suggest that hormone replacement therapy is associated with improvements in pelvic support and muscle function [32].
Strengths and limitations
This study has several notable strengths. First, it utilizes a large, nationally representative sample from NHANES (n = 9,184), which provides high statistical power and enhances the generalizability of our findings to the non-institutionalized U.S. adult female population. Second, we employed a standardized, widely used questionnaire item to define SUI, ensuring consistency in outcome assessment. Third, beyond the baseline TyG index, we comprehensively evaluated multiple, clinically accessible adiposity-combined indices (TyG-BMI, TyG-WC, TyG-WHtR), which offered improved predictive utility for SUI risk and aligns with the multifactorial nature of metabolic health. Finally, our analyses were rigorously adjusted for a wide array of potential confounders, including sociodemographic, behavioural, and clinical factors, and we further explored dose-response relationships, non-linearity, and effect modification through subgroup analyses, thereby providing a nuanced understanding of the associations. However, there are limitations to consider. First, its cross-sectional design precludes the inference of causality between TyG indices and SUI. Second, SUI was defined by a single self-reported questionnaire item, which may lead to underreporting or misclassification. Third, the findings are derived from a U.S. population and may not be directly generalizable to other ethnic or healthcare settings.
Clinical relevance
The findings of this population-based study carry several clinical implications. First, the TyG index and its derivatives, particularly TyG-WHtR, are calculated from routine, low-cost measurements (fasting blood tests, waist circumference, height, and weight). This makes them potentially accessible and practical tools for clinicians to identify women at higher risk of SUI within general or at risk populations (e.g., those with obesity or metabolic syndrome). Second, the strong, independent associations observed, especially for the adiposity-combined indices, reinforce the importance of assessing and addressing metabolic health – including insulin resistance and central obesity – as part of a holistic approach to pelvic floor health. While these indices are not diagnostic for SUI, they could help in risk stratification and prompt earlier lifestyle counselling or more targeted clinical evaluation for urinary symptoms.
Future recommendations
Based on these findings, future research should: employ longitudinal designs to establish the temporal relationship and potential causality between TyG indices and incident SUI, investigate whether interventions that improve metabolic health and reduce TyG indices – such as the lifestyle modification programs shown to be effective in other conditions – could also prevent or alleviate SUI symptoms.
Conclusions
In this nationally representative cross-sectional study of U.S. women, higher levels of the TyG index and its adiposity-combined indices (TyG-BMI, TyG-WC, and TyG-WHtR) demonstrated significant, dose-dependent positive associations with the prevalence of SUI. Among these, TyG-WHtR showed the strongest association.