
Introduction
Magnetic resonance imaging (MRI) allows for multiparametric characterization of liver tumors [1, 2]. In hepatocellular carcinoma (HCC), MRI has been shown to reflect tumor behavior and aggressiveness [3].
Among available sequences, diffusion-weighted imaging (DWI) is particularly valuable, as it measures the restriction of water molecule movement through apparent diffusion coefficient (ADC) mapping [4]. It is widely recognized that ADC values inversely correlate with tissue cellularity and proliferation potential in various tumors, including HCC [5, 6]. Early observations demonstrated that different ADC measurements may also reflect different aspects of the tumor microstructure [7].
To enable truly tumor-targeted therapies, however, immunohistochemical characterization remains essential. This typically requires integration of pathological and radiological findings. Notably, few studies have comprehensively explored the relationship between ADC values and distinct cellular compartments or expression profiles in HCC [8–10].
In clinical practice, histopathological insights into HCC are primarily obtained through biopsy or surgical resection. Yet biopsies may sample non-representative tumor regions and are associated with a small but non-negligible risk of false-negative results and procedure-related complications [11, 12]. In contrast, imaging modalities can assess the entire tumor noninvasively.
Magnetic resonance imaging – particularly DWI – offers insights into tumor tissue composition and may correlate with histopathologic and biological characteristics. Therefore, the aim of this study was to investigate potential associations between DWI-derived parameters and immunohistochemical features of curatively treated HCC, including tumor-immune microenvironment components, microvessel density, and glypican-3 expression.
Material and methods
This retrospective study, as part of the ATLAS project, was approved by the institutional ethic committee (University of Leipzig, approval number 159/25-ek), and informed consent was waived due to the study design.
Patients and inclusion criteria
Patients were eligible for inclusion if they met the following criteria: 1) availability of a contrast-enhanced MRI performed within 9 months prior to surgery, including DWI; 2) lesion size greater than 5 mm; 3) availability of pathological specimens; 4) no HCC-directed therapy; and 5) histologically confirmed HCC. Patients were excluded if significant artifacts were present on the preoperative MRI scans.
A total of 25 patients (n = 4 female; 16%) with a mean age of 63 ±8.9 years met all inclusion criteria and were enrolled in the present analysis.
MRI imaging
In all patients, MRI was performed on a clinical 1.5-T scanner (Aera, Siemens Health Care, Erlangen, Germany). The imaging protocol included T2-weighted single-shot and turbo-spin echo sequences with and without fat suppression (TR/TE: 1600:100). Dynamic contrast-enhanced scans were obtained after administration of Gd-EOB-DTPA (0.1 mmol/kg body weight, Primovist, Bayer HealthCare): T1 weighted gradient echo sequences in the arterial, portal-venous and late venous phase as well as the hepatobiliary phase 20 minutes after contrast media application, and the DWI sequences. In all cases, DWI was acquired with a multi-shot SE-echo planar sequence (repetition time: 7200 ms, echo time: 50 ms, slice thickness: 5 mm, matrix: 88 × 134, field of view: 450 mm). The sequences were obtained with the b-values of 50, 400, and 1000 s/mm.
Imaging analysis
MR images were analyzed within the clinically used PACS (iDS7, Sectra AB, Linköping, Sweden). The DWI images were analyzed by a trained resident with 2 years of general experience in radiology as well as by a board-certified radiologist with 8 years of general experience. Three parameters were included – ADCmax, ADCmin, ADCmean – and the inter-reader agreement was measured. A polygonal region of interest (ROI) was manually delineated on the representative area of the tumor, avoiding artifacts. The mean ROI perimeter was 90.5 mm; the mean ROI area was 789.4 mm2. Diffusion restriction was evaluated on the high b-value images with a clear hyperintense signal intensity of the tumor compared to the surrounding liver parenchyma. Figure 1 provides a representative measurement of the patient cohort.
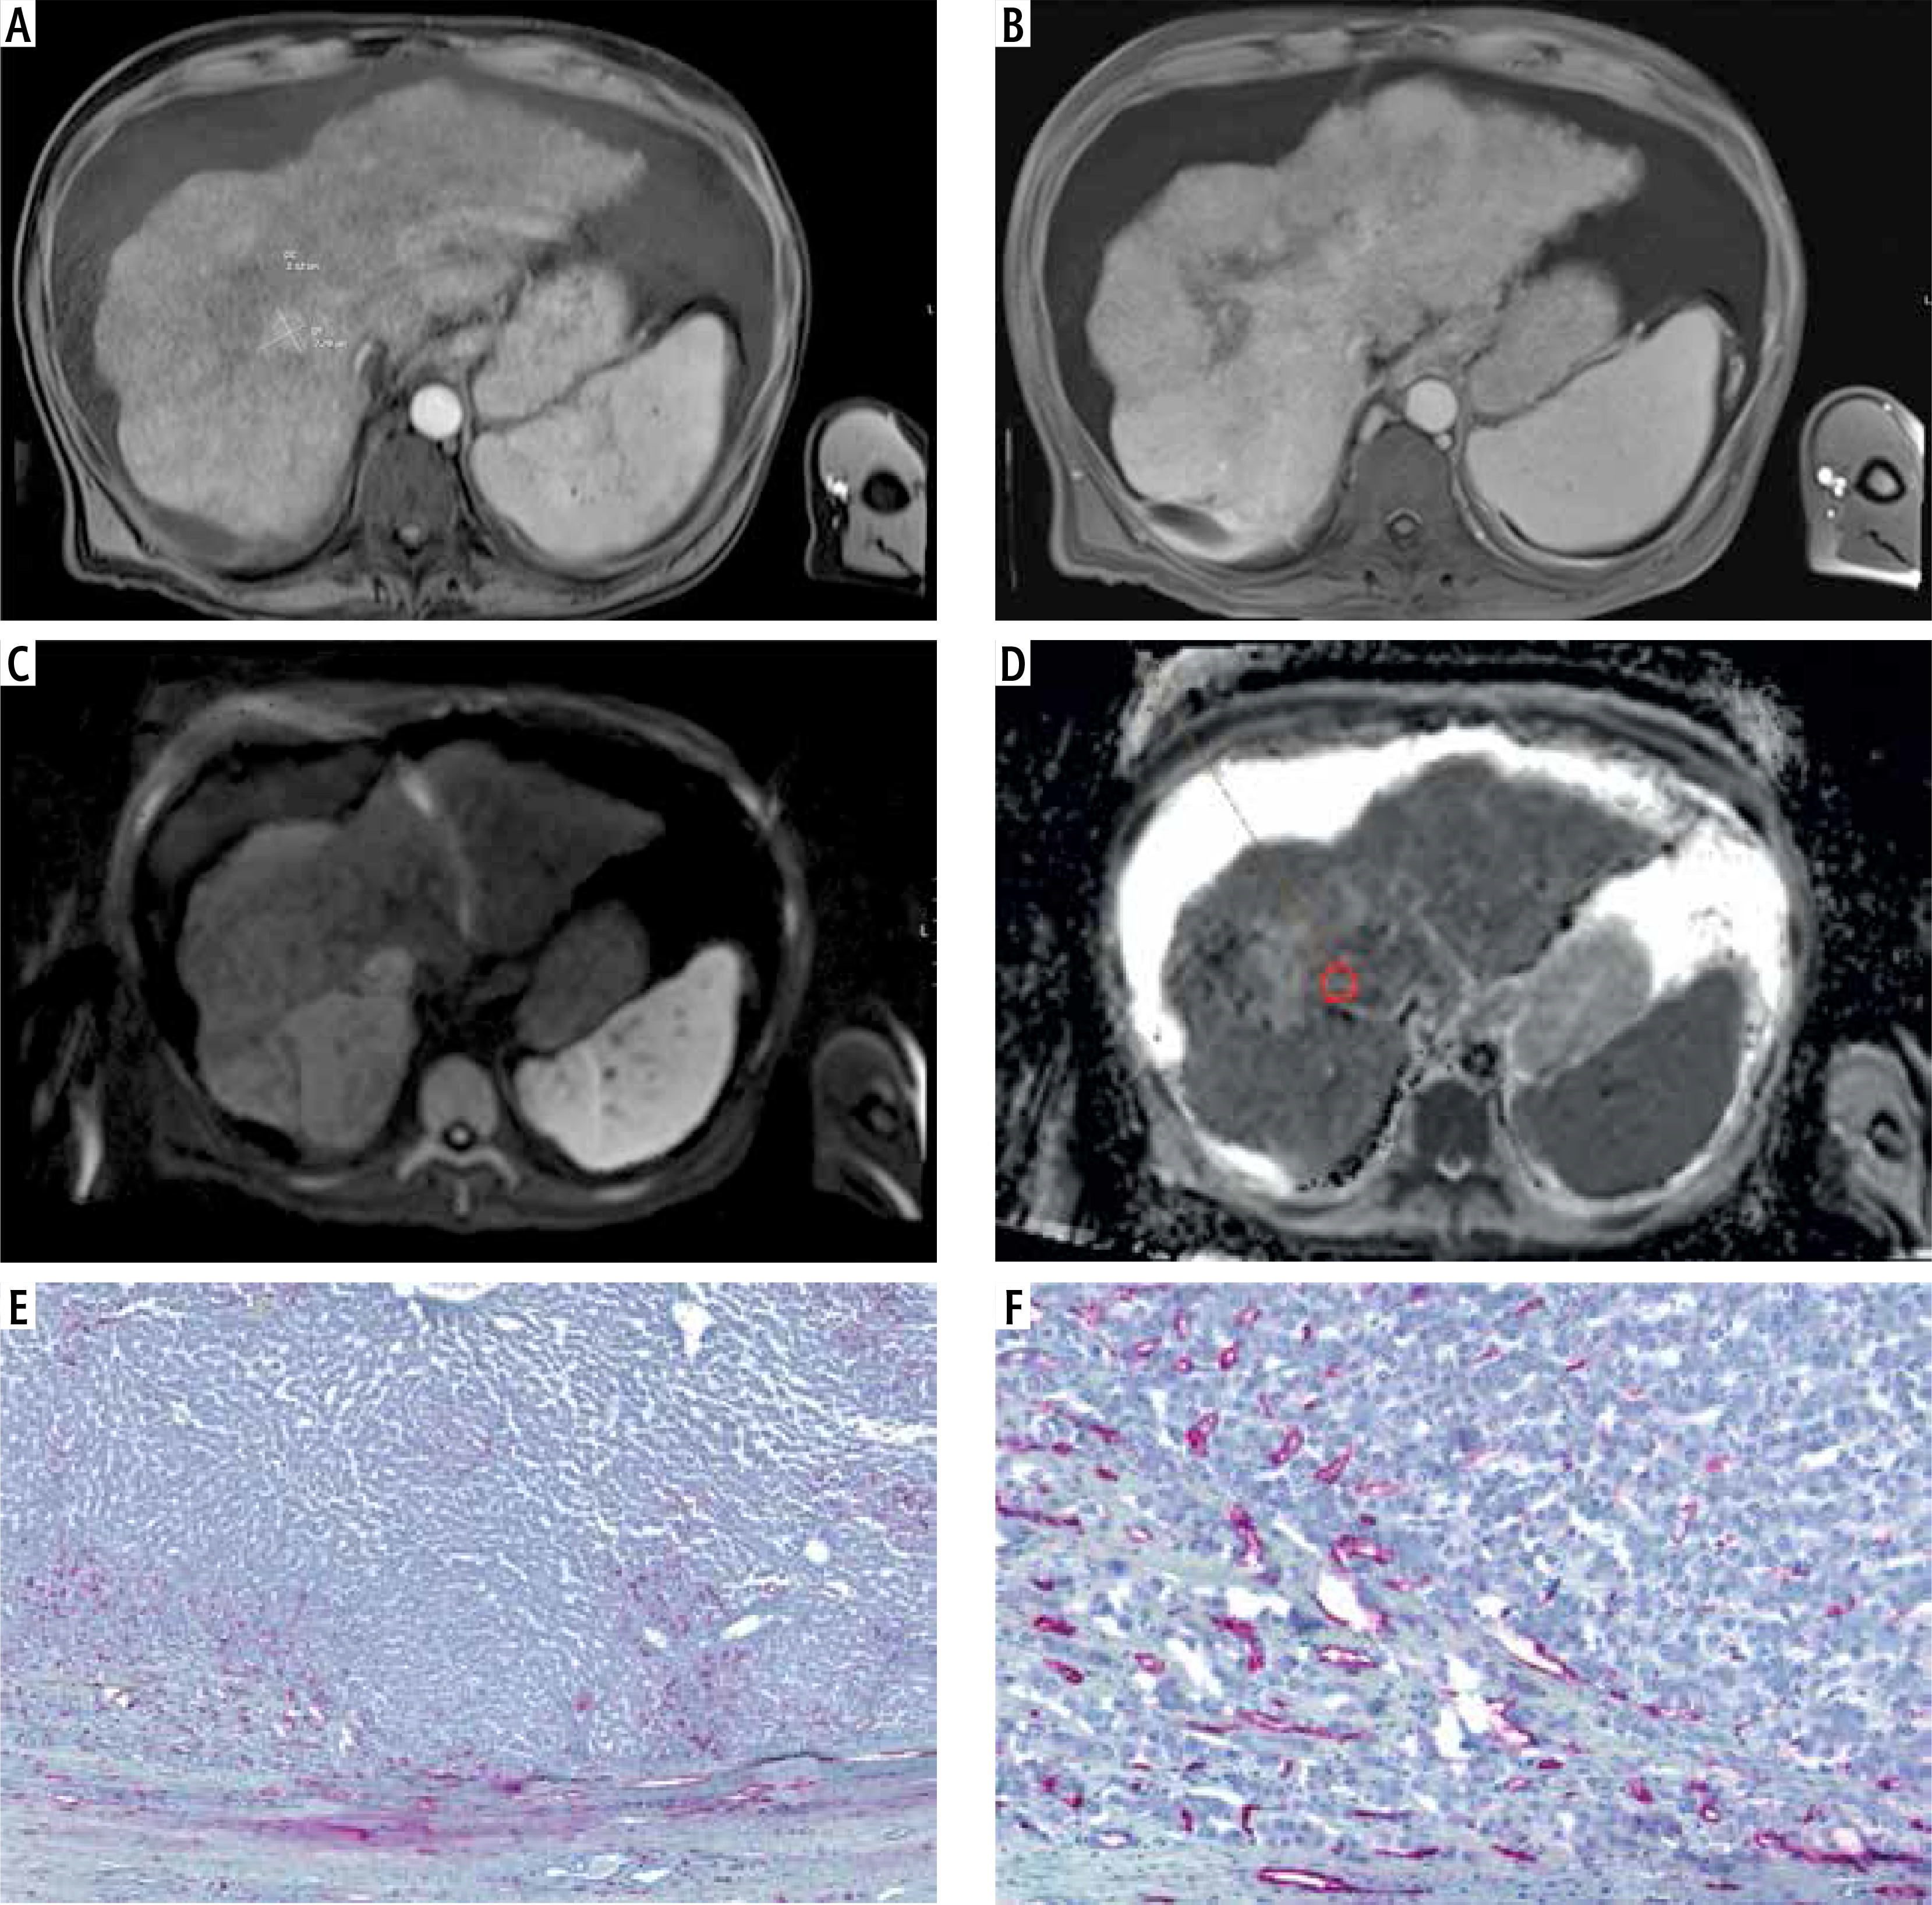
Fig. 1
Representative imaging and histopathological features of a hepatocellular carcinoma (HCC) located in segment VIII of the right liver lobe. A) Arterial phase of contrast-enhanced MRI showing marked arterial hyperenhancement of the lesion. B) Portal venous phase illustrating the characteristic washout pattern. C) Diffusion-weighted imaging (DWI) acquired at b = 1000 s/mm2. D) Corresponding ADC map with delineated region of interest (ROI) shown in red. E, F) Immunohistochemical staining for CD34 highlighting microvessel density within the tumor
Histological analysis
Histopathology evaluation was performed by one board-certified pathologist (A.K.H.) with 18 years of experience in pathology who was blind to both patient identity and imaging results. Formalin-fixed, paraffin-embedded tissues were cut into 2 µm histological slices, dewaxed in xylol, and rehydrated through descending concentrations of ethanol. For each specimen, standard hematoxylin and eosin (HE) staining and immunohistochemistry were performed. For antigen detection, we used the automated immunohistochemistry slide staining system VENTANA BenchMark ULTRA (Roche Diagnostics GmbH), the VENTANA iVIEW DAB Detection Kit or ultraView Universal Alkaline Phosphatase Red Detection Kit (Roche Diagnostics GmbH) before counterstaining with Haemalaun solution. All tumors were further investigated with the following immunohistochemical features: programmed death ligand 1 (PD-L1, clone 22C3, dilution 1 : 100, Dako), glypican-3 (clone IG12, dilution 1 : 20, DCS), CD3-tumour infiltrating lymphocyte (polyclonal, dilution 1 : 150, DAKO), CD68 positive cells (clone PM-M1, dilution 1 : 100, DAKO) and CD34 positive microvessel density (clone QBEND10, dilution 1 : 300, Beckmann Coulter). CD3+ densities were assigned one of four scores: 0 (no positive cells), 1 (a few scattered individual positive cells), 2 (small positive cell clusters with approximately 5% of all cells staining positively), and 3 (more abundant and organized staining with more than approximately 10% of all cells staining positively) [13].
Statistical methods
Statistical analyses and graphical illustrations were performed using GraphPad Prism version 8 (GraphPad Software, La Jolla, CA, USA) and IBM SPSS Statistics for Windows, version 29 (IBM Corp., Armonk, N.Y., USA). Descriptive statistics, including absolute and relative frequencies, were used to summarize the data. Intraclass coefficient (ICC) analysis was used to assess inter-reader agreement. Associations between imaging and histopathological parameters were assessed using Spearman’s rank correlation coefficient (r). Group comparisons were conducted using the Mann-Whitney U test. A two-sided p-value of < 0.05 was considered indicative of statistical significance in all analyses.
Results
A total of 25 patients (4 females), mean age 63 ± 8.9 years), met the inclusion criteria and were enrolled in the present study. Of these, 21 patients (84%) had liver cirrhosis, attributed to various etiologies as detailed in Table 1. The most frequent comorbidities were chronic alcohol consumption and type 2 diabetes mellitus. An overview of the demographic and clinical characteristics of the cohort is provided in Table 1.
Table 1
Demographic overview of the investigated patient cohort comprising clinical and imaging features
The mean ADCmax was 1.48 ±0.31 × 10⁻³ mm2/s, the mean ADCmean was 1.11 ±0.11 × 10⁻³ mm2/s, and the mean ADCmin was 0.75 ±0.21 × 10⁻³ mm2/s. Diffusion restriction was observed in 20 cases (80%). Inter-reader agreement for ADC measurements was evaluated using ICC with the following results: ADCmin ICC = 0.92 (95% CI: 0.82-0.96), ADCmean ICC = 0.90 (95% CI: 0.78-0.95) and ADCmax ICC = 0.93 (95% CI: 0.85-0.97).
Correlation analysis
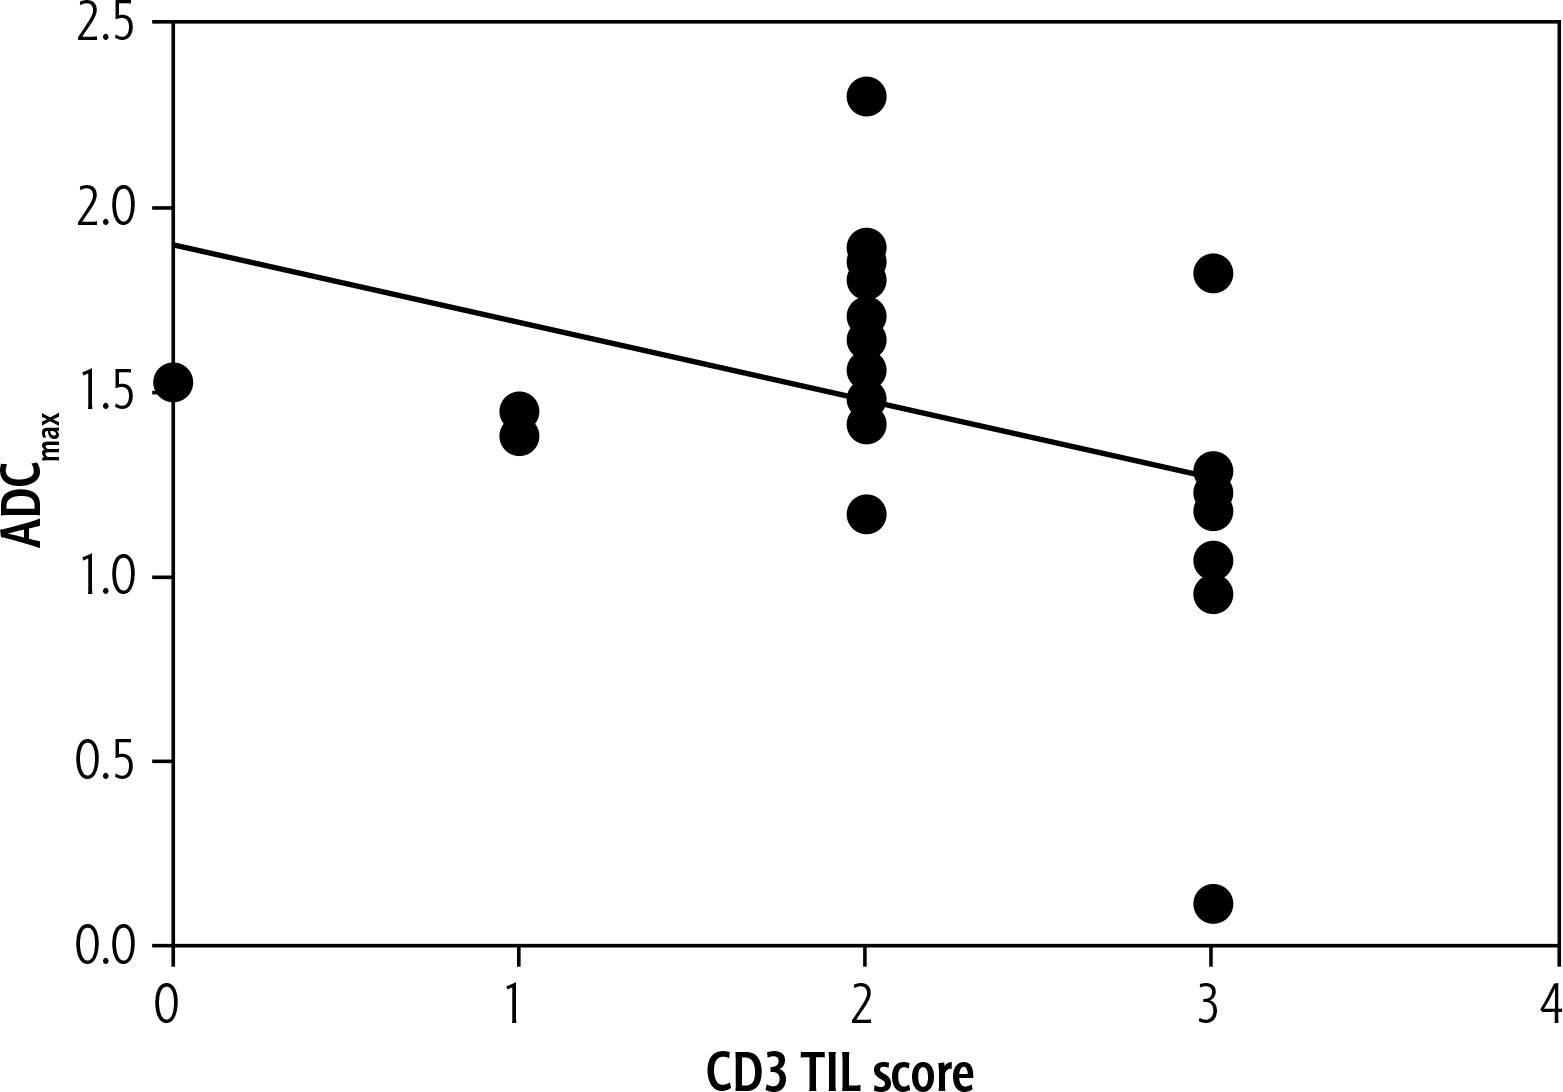
The correlation analysis revealed a moderate inverse association between CD3+ tumor-infiltrating lymphocytes (TILs) and both ADCmean (r = –0.52, p = 0.008) (Fig. 2) and ADCmax (r = –0.50, p = 0.01) (Fig. 3). Tumor size also showed a significant negative correlation with CD3+ TIL density (r = –0.45, p = 0.02).
Fig. 2
Spearman′ correlation between CD3 tumor-infiltrating lymphocytes and ADCmean (r = –0.52, p = 0.008)
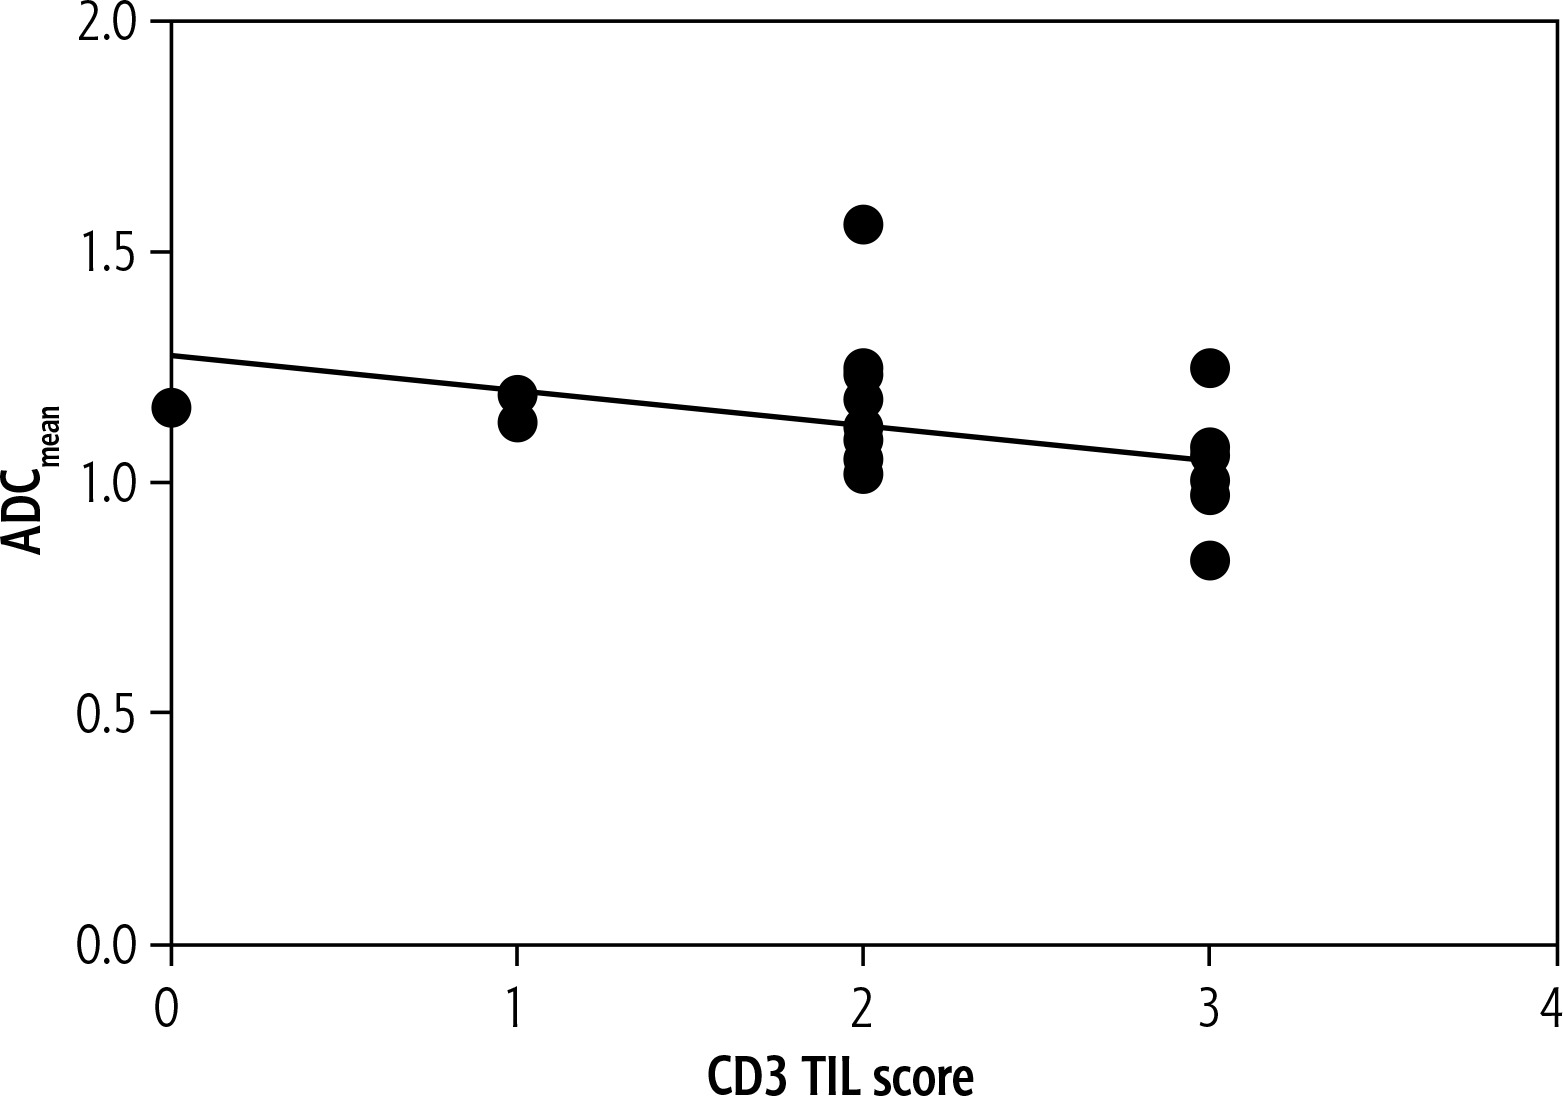
Fig. 3
Spearman′ correlation between CD3 tumor-infiltrating lymphocytes and ADCmax (r = –0.50, p = 0.01)
CD34+ microvessel density (MVD) was significantly higher in tumors exhibiting diffusion restriction compared to those without (mean 40 ±10.8 vs. 54 ±5.5, p = 0.0046).
No significant associations were observed between ADC values and the expression of other histopathological markers, including PD-L1 (ICS, TPS, CPS), glypican-3, CD3+ stromal-infiltrating lymphocytes (SIL), and CD68+ cells.
A summary of correlation results is provided in Table 2.
Table 2
Spearman’s correlation analysis between histopathological features and investigated diffusion-weighted imaging parameters. Statistically significant results are highlighted in bold
Discussion
There is strong evidence that DWI and its quantitative parameters, particularly ADC values, can reflect tumor aggressiveness, cellularity, histological grading, and proliferative activity in HCC [5–10, 14]. A recent meta-analysis demonstrated significantly lower ADC values in poorly differentiated HCCs compared to well-differentiated tumors [15]. Moreover, lower ADC values have been consistently associated with increased tumor proliferation potential [6, 15–19].
Despite this established association, relatively few studies have comprehensively examined the relationship between ADC values and more specific immunohistochemical features of HCC, particularly those related to the tumor microenvironment (TME) [9, 15, 16, 18]. In one recent analysis, no significant correlation was observed between ADC values and tumor-infiltrating lymphocytes (TILs) defined by CD45 expression, with a reported correlation coefficient of –0.154 (p = 0.271) [18].
Tumor microenvironment, defined as a complex interaction between tumor cells and other cell types, plays a critical role in tumor progression, immune evasion, and angiogenesis, and is increasingly viewed as a therapeutic target in HCC [20–22]. Its components are classically divided in non-cellular and cellular, such as fibroblasts, myofibroblasts, inflammatory cells, and immune cells [23]. Among them, TILs represent an essential element of the host immune response. Their density, subset, and spatial distribution within the tumor have been linked to either anti- or pro-tumor effects, depending on the immunologic context defined by the TME [24].
CD3 is a well-established surface marker of T-lymphocytes [25]. Previous research, including the work by Gabrielson et al., has shown that high intratumoral CD3+ TIL density, particularly in combination with high CD8+ cell infiltration, is associated with improved relapse-free survival in HCC, independently of other clinical and pathological factors [26]. A metaanalysis similarly showed that elevated CD3+ TIL concentration is predictive of favorable clinical outcomes in HCC with HR of 0.63 (p = 0.03) for overall survival and 0.60 (p = 0.01) for disease free survival [27]. Nonetheless, the mechanisms by which CD3+ TILs modulate tumor behavior in HCC remain incompletely understood [26].
CD34 is a transmembrane glycosylated protein, naturally expressed in hematopoietic precursors and endothelial cells. Its expression increases during HCC development, corresponding to sinusoidal capillarization [28, 29] – a well-known process in HCC development – and its expression is used as a marker of MVD. It is reported to be a sensitive immunostaining marker to detect HCC and differentiate it from the surrounding tissue and benign liver lesions [30], and several studies have highlighted its diagnostic role in association with glypican-3 staining [31, 32]. These results align with the role of CD34 in ensuring the differential diagnosis in small nodules, reported by several studies, where it is combined with glypican-3 [32].
In the present study, we observed a moderate inverse correlation between CD3+ TIL density and both ADCmax (r = –0.50, p = 0.01) and ADCmean (r = –0.52, p = 0.008). These findings suggest that tumors with higher immune infiltration may exhibit lower ADC values, potentially reflecting changes in the tumor microenvironment beyond cellularity, including lymphocytic infiltration. Similar observations have been reported in other tumor entities, such as head and neck squamous cell carcinoma [33–35]. Regarding the associations between TIL in HCC, there was one previous report with negative results with a reported r = 0.04, p = 0.71 using a 3T scanner in a total of 72 HCCs [9]. In the study by Surov et al., the tumor-stroma ratio, reflecting the composition of the tumor microstructure, showed a weak positive association with the ADC value, with r = 0.31, p = 0.02 in 53 HCC lesions [18].
The hypothesis to explain these findings is that the ADC value is sensitive not only to cellularity changes of tissue but also to cell size and nuclear area [36]. TIL tend to be smaller in size, with a different nucleus/cell ratio, compared to HCC cells, which should also alter the resulting ADC signal measured on MRI.
Another noteworthy finding is the association between CD34+ microvessel density (MVD) and the presence of diffusion restriction on DWI. Tumors exhibiting diffusion restriction demonstrated significantly higher MVD (mean 54 ±5.5 vs. 40 ±10.8, p = 0.0046), consistent with prior data underscoring the prognostic relevance of MVD in HCC [37]. However, the present results are in line with the previous report that ADC values may not be correlated with MVD in liver tumors [18].
Taken together, these preliminary results support the concept that DWI – through ADC mapping – can serve as a non-invasive imaging biomarker of the tumor immune milieu and microvascular architecture in HCC. By providing radiologic correlates to histopathologic features, DWI may facilitate more refined, individualized diagnostic and therapeutic decision-making in multidisciplinary tumor boards.
Notably, no significant correlations were found between ADC metrics and other histopathological parameters analyzed in this study, including PD-L1 expression, CD68+ cells, CD3+ stromal lymphocytes (SIL), and glypican-3 expression.
These current negative findings highlight the need for further imaging-histopathology correlation studies incorporating additional MRI sequences and multimodal approaches. Especially the added information of the hepatobiliary late phase hepatocyte-specific contrast media application could provide more information regarding diagnostic accuracy and tumor microstructure [38, 39].
Several limitations must be acknowledged. First, this was a retrospective single-center study with a relatively small sample size, which may limit the statistical power and generalizability of the findings. Second, only surgically resected tumors were included, introducing a potential selection bias, as patients undergoing curative resection may differ significantly in tumor biology from those receiving palliative treatment. To mitigate these biases, imaging and pathological analyses were performed independently and blinded to clinical outcomes.
Conclusions
This preliminary study demonstrated that ADCmean and ADCmax values inversely correlated with CD3+ tumor-infiltrating lymphocytes, while diffusion restriction was associated with increased microvessel density in HCC. These findings suggest that DWI-derived parameters may serve as useful non-invasive surrogates for selected components of the tumor microenvironment.


