
Introduction
Colorectal cancer (CRC) is the third most common tumour among all malignant tumours and is also the most common malignant tumour occurring in the digestive system [1]. The number of people worldwide that die from CRC ranks fourth among all malignant tumours, seriously threatening human life and health. Colorectal cancer has a latent onset, is prone to metastasis. There is a serious phenomenon of drug resistance [2]. Therefore, it is of utmost importance to clearly understand the mechanism of drug resistance in CRC cells and to develop corresponding early diagnosis and treatment strategies [1].
Compared with normal cells, heterogeneity is a main feature of tumour cells [3, 4]. Tumour heterogeneity is also an important reason for tumour metastasis and drug resistance [3]. Metabolomics has become a powerful tool to identify tumour heterogeneity, classify tumours and suggest treatment strategies. And with the development of liquid chromatography-mass spectrometry, metabolomics has increasingly become an important basis and target for tumour diagnosis and treatment in clinical practice [5, 6]. For instance, a metabolomics study on lung cancer tissues revealed that 4 metabolites, including citric acid, are excellent diagnostic markers for lung cancer [7]. One report indicates that the combined metabolomics of breast cancer tissues and urine shows that metabolites such as acetone can serve as biomarkers for breast cancer as well [8]. There are also many studies on plasma metabolomics that indicate that the metabolites in plasma have potential roles in the diagnosis of various malignant tumours such as breast cancer, colorectal cancer, and lung cancer [9–13]. The metabolic heterogeneity of tumours is often an important factor contributing to the tolerance of tumour treatment. Some previous studies have also demonstrated the role of metabolomics in guiding the treatment of tumour drug resistance. A previous study established a model for nine metabolites in breast cancer tissues, which was capable of accurately predicting the treatment tolerance of patients [14]. Furthermore, metabolomics can also play a significant role in the treatment plans for various tumours, including glioma, after drug resistance occurs [12, 15]. In addition, the alterations in tumour metabolism can also affect the tumour microenvironment, suggesting that the combination of metabolic-based treatment and immunotherapy can achieve better results [16–18].
In recent years, multi-omics analyses including metabolomics and transcriptomics have provided a more profound explanation for the occurrence and development of tumours. Zhou et al. [13] reviewed the systematic research results of multi-omics in liver metastasis of colon cancer. Metabolomics plays a significant role in the diagnosis, treatment and prognosis of tumours. However, in colorectal cancer, corresponding metabolomics research is still insufficient. In this study, we conducted a combined analysis of the metabolomics and transcriptomics of colon cancer using public databases. We performed dimensionality reduction on CRC and tumour samples using orthogonal partial least squares discriminant analysis (OPLS-DA), and screened for tumour characteristic metabolites based on variable important in projection (VIP) values. Then we conducted a differential analysis of the metabolites, and identified a series of metabolites that were differentially expressed in colorectal cancer. The receiver operating characteristic (ROC) curve indicates that these metabolites have potential significance for the diagnosis of colorectal cancer. Next, we conducted an enrichment analysis of these metabolites and performed a combined analysis of enrichment pathways with the differentially expressed genes. We also constructed a prognostic model using the genes included in the co-enriched pathways. Finally, we conducted in-cell validations for some key metabolites and differentially expressed genes. In summary, our research has provided a potential role from the metabolomics perspective for the diagnosis and treatment of colorectal cancer.
Material and methods
Data and repositories
The metabolic data of patients with CRC were downloaded from the MetaboLights website (https://www.ebi.ac.uk/metabolights/, MTBLS8090). It includes 35 tumour samples and 35 normal samples. The transcriptomics data was downloaded from the the cancer genome atlas-colon adenocarcinoma (TCGA-COAD) dataset (https://portal.gdc.cancer.gov/).
Data analysis
Variable important in projection was used to determine characteristic metabolites between groups. The value of VIP was calculated by OPLS-DA analysis. Variable important in projection > 1 was used as the inclusion criterion for all metabolites. Differential analysis was performed on the obtained characteristic metabolites, |log2FC > 0.585| and p < 0.05 were used as the inclusion criteria to obtain the differential characteristic metabolites between the groups. Gene differential analysis was performed in TCGA-COAD patients, and Kyoto Encyclopedia of Genes and Genomes (KEGG) enrichment analysis was performed on differential metabolites and differential genes. Venn analysis was performed on the enriched pathways of the genome and metabolome, and least absolute shrinkage and selection operator (LASSO) analysis was performed on the genes in the co-enriched pathways to establish a prognostic model. The Kaplan-Meier method was used for survival analysis. The receiver operating characteristic curve was used to evaluate the diagnostic efficacy.
Cell culture
Normal colonic epithelial cell line NCM460, CRC cell lines HCT116 and LoVo were all purchased from the Peking Union Medical College Cell Bank. All cells were cultured in complete dulbecco’s modified eagle medium medium (with 10% Foetal Bovine Serum and 1% penicillin-streptomycin) under 37°C, 5% CO2.
ELISA
The levels of estradiol and methionine in the cells were measured by ELISA. Estradiol levels were measured by 17-β-Estradiol ELISA kit (Abcam, ab108667), and methionine levels were measured by methionine assay kit (Abcam, ab234041). All assays were performed according to the manufacturer’s instructions.
Protein extraction and Western blot
Cells were lysed in the following solution: 50 mM Tris-Cl pH 7.4, 250 mM NaCl, 0.5% NP-40, 1 mM PMSF, 1 mM Na3VO4, 1 mM EDTA, 1 mM NaF, 1× cocktail. The proteins were denatured for 10 min at 95°C and then separated on SDS-PAGE gels. Proteins were subject to electrophoresis for 2 h at 80V, and transferred to NC membrane. Then proteins were incubated overnight in the presence of primary antibodies and for one hour in the presence of secondary antibodies before visualization. The following antibodies were used in this experiment: SLC5A1, Proteintech, 30861-1-AP; formimidoyltransferase cyclodeaminase (FTCD), Proteintech, 21959-1-AP.
Results
Difference metabolites between colorectal cancer and normal tissues
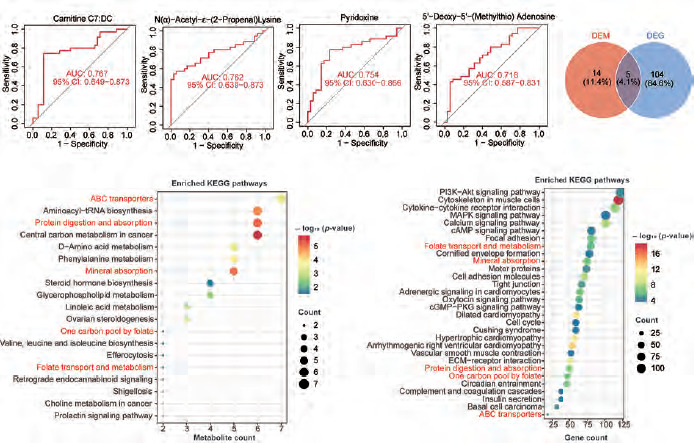
We performed OPLS-DA analysis on all samples. The dimensionality reduction results showed that there were significant group differences between CRC tissues and normal tissues, and there was no overfitting (Figure 1 A, B). Using VIP > 1 as a screen, we obtained 318 metabolites in colon cancer, as shown in Supplementary Table 1. Figure 1 C shows all metabolites with VIP values > 2. After differential expression analysis of these 318 metabolites, we obtained 72 differential metabolites, of which 30 were upregulated and 42 were downregulated in CRC (Figure 2 A, Supplementary Table 2). The most downregulated metabolites were L-, Carnitine C7: DC and methylcysteine (Figure 2 B–D), while oestrogen and D-Ribono-1,4-lactone were the most upregulated in CRC (Figure 2 E, F). To clarify the potential of these metabolites for the diagnosis of colon cancer patients, we plotted ROC curves for all metabolites and calculated the area under the curve (AUC). Using AUC > 0.7 as the criterion, 4 metabolites were identified as potentially critical biomarkers for colon cancer diagnosis (Carnitine C7: DC, AUC = 0.767; N(α)-Acetyl-ε-(2-Propenal)lysine, AUC = 0.762; pyridoxine, AUC = 0.754; 5’-Deoxy-5’-(Methylthio) Adenosine, AUC = 0.718 (Figure 3 A–D).
Figure 1
Orthogonal partial least squares discriminant analysis (OPLS-DA) analysis of metabolites of colorectal cancer. A, B) OPLS-DA analysis of all tissues. C) Display of all metabolites with a variable important in projection value greater than 2
OPLS-DA – orthogonal partial least squares discriminant analysis, VIP – variable important in projection
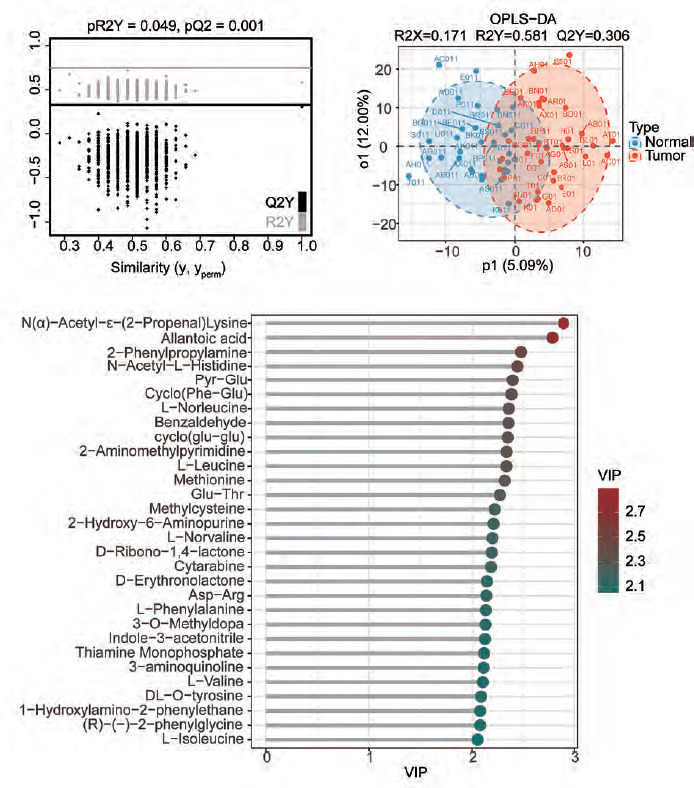
Table 1
Coefficients of six genes
| Gene | Coefficient |
|---|---|
| CFTR | –0.03392 |
| ABCA7 | 0.229545 |
| FTCD | 0.585924 |
| SLC26A3 | –0.0795 |
| SLC5A1 | –0.22801 |
| MAT1A | 0.275093 |
Figure 2
Analysis of the differences in characteristic metabolites of colorectal cancer. A) The heatmap shows some of the different metabolites. B–F) The violin plots of the top 5 metabolites that were upregulated or downregulated
CRC – colorectal cancer * p < 0.05 ** p < 0.01
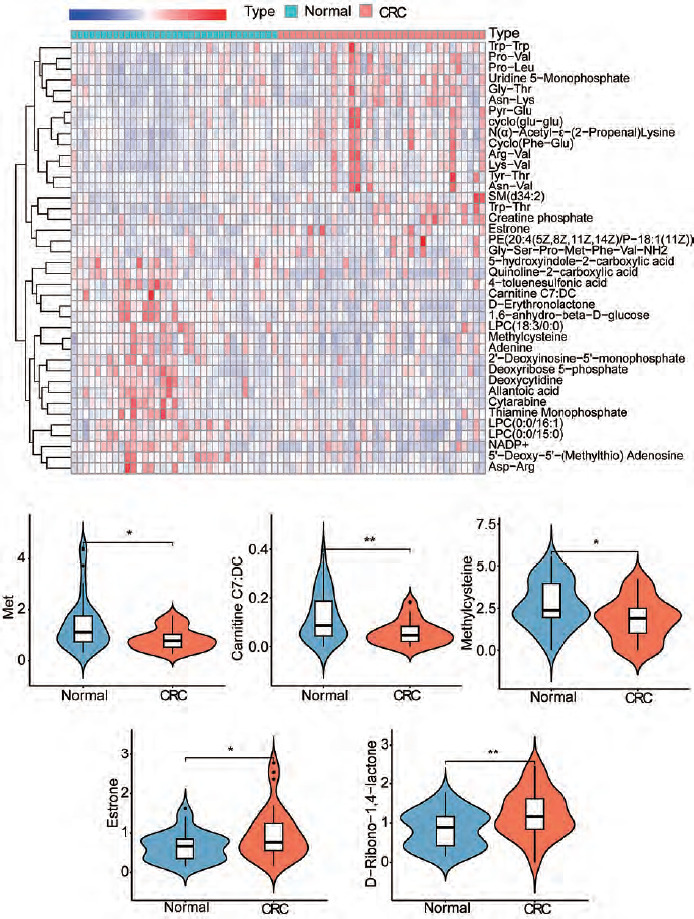
Figure 3
Joint analysis of metabolomics and transcriptomics. A–D) The receiver operating characteristic curves of the four metabolites with an area under the curve value greater than 0.7. E) Enrichment analysis bubble plot of metabolites (DEM). F) Enrichment analysis bubble plot of differentially expressed genes in the cancer genome atlas – colon adenocarcinoma (DEG). G) Venn analysis of enriched pathways in metabolomics and transcriptomics
The red font indicates the common pathway.
Multi-omics analysis revealed key molecular pathways in colorectal cancer
We then performed KEGG enrichment analysis of the differentially expressed metabolites. A total of 19 pathways were enriched (DEM). The results showed that the most significantly enriched pathways were ABC transporters, aminoacyl-tRNA biosynthesis, protein digestion and absorption, central carbon metabolism in cancer, D-amino metabolism and phenylalanine metabolism (Figure 3 E). These results indicated that there are significant differences in protein metabolic pathways and cell transport pathways between normal tissues and CRC tissues.
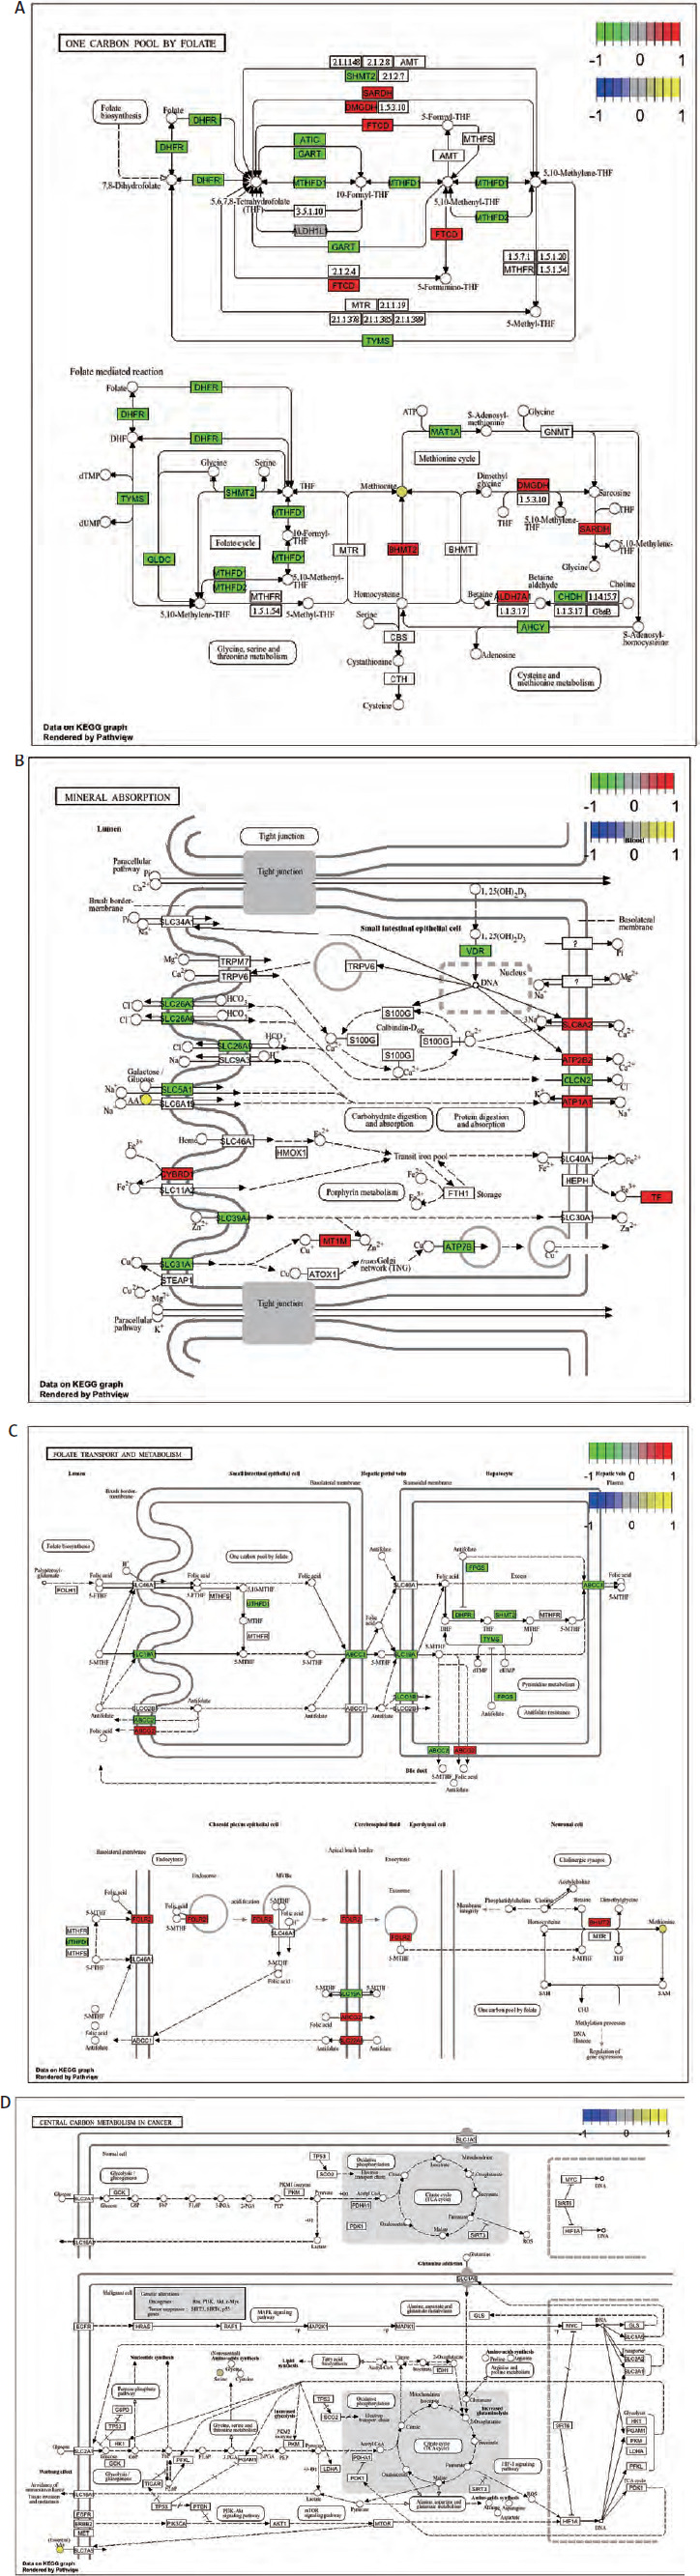
We next performed a transcriptomics analysis of colon cancer. We performed gene differential analysis on 39 paracancerous tissues and 398 tumour tissues from the TCGA-COAD dataset. The results showed that 609 genes were upregulated and 500 genes were downregulated in the tumours. Kyoto Encyclopedia of Genes and Genomes analysis was performed on these differentially expressed genes. A total of 109 pathways were significantly enriched (DEG). Figure 3 F shows the top 30 enriched pathways. Venn analysis was performed on 19 DEM pathways and 109 DEG pathways and results showed that 5 pathways were co-enriched (ABC transporters, protein digestion and absorption, mineral absorption, one carbon pool by folate and folate transport and metabolism (Figure 3 G). The regulatory relationships of metabolites and differential genes in the corresponding pathways are shown in Figure 4 and Supplementary Figure 1.
The model of metabolism-related genes suggested the prognosis of patients
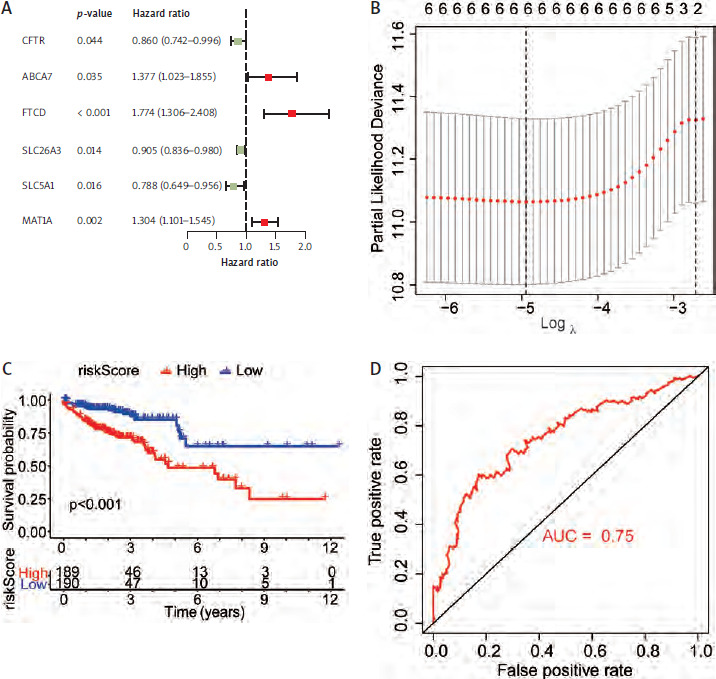
Genes from 5 co-enriched pathways were extracted from the expression matrix of TCGA-COAD. Univariate cox regression analysis of these genes was performed, and finally 6 genes related to prognosis were obtained (Table 1, Figure 5 A). We performed LASSO regression model construction for these genes (Table 1, Figure 5 B). According to the calculated risk score, all TCGA-COAD were divided into high and low risk groups. The Kaplan-Meier analysis showed that the prognosis of the low risk group was significantly better than that of the high risk group (Figure 5 C). The receiver operating characteristic curve showed that risk score had high accuracy and sensitivity in predicting the prognosis of patients (Figure 5 D).
Figure 5
Construction of prognostic models for genes in enrichment pathways. A) Univariate Cox analysis of genes in all models. B) Construction of a least absolute shrinkage and selection operator regression model for 6 genes. C) Survival analysis between the high-risk group and the low-risk group. D) Receiver operating characteristic curve for risk score to predict the prognosis
FTCD – formimidoyltransferase cyclodeaminase
We then performed a consensus cluster analysis of TCGA-COAD patients. The patients were divided into two subtypes by consensus clustering (Cluster 1 and Cluster 2). We compared the survival between the two subtypes, and the results showed that Cluster 1 had a significantly worse prognosis (Supplementary Figure 2). Our results suggested the potential value of genes associated with characteristic metabolic pathways in the CRC prognosis and classification.
Validation of metabolites and associated genes at the cellular level
Our results showed that methionine and oestrogen were the most significantly decreased and increased metabolites, respectively, in CRC patients (Figures 2 B, E). To verify this finding, we measured the contents of these metabolites by ELISA in colonic epithelial and CRC cells, respectively. ELISA results showed that methionine was significantly reduced compared with NCM460 cells (Figure 6 A). The major component of oestrogen in the cell is 17-β-estradiol. Therefore, we also measured the estradiol content in the cells by ELISA. The results showed that estradiol content in colon cancer cells was significantly higher than that in normal cells (Figure 6 B).
Figure 6
Validation of levels of differential metabolites and genes in cells. A, B) ELISA of oestrogen and methionine levels in cells. C, D) Measurement of SLC5A1 and formimidoyltransferase cyclodeaminase protein levels in cells
FTCD – formimidoyltransferase cyclodeaminase
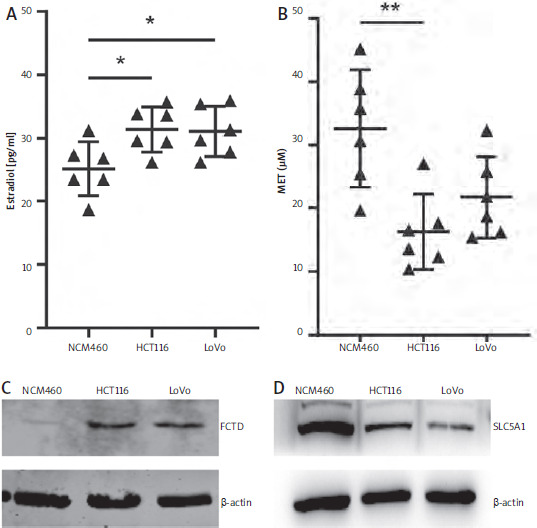
Among the 6 genes related to the prognosis of colorectal cancer, FTCD had the highest hazard ratio, while SLC5A1 was a favourable prognostic factor (Figure 5 A). We examined the expression of both proteins in cells by western blot. The results showed that FTCD was significantly highly expressed in both colon cancer cell lines, while SLC5A1 was inversely expressed (Figure 6 C, D).
Discussion
Colorectal cancer is one of the most common malignant tumours worldwide, with its incidence and mortality rates remaining high [19]. Despite advancements in endoscopy and imaging techniques, early diagnosis, prognosis assessment, and prediction of treatment response remain significant challenges in clinical practice. Metabolomics, as an important component of systems biology, can quantitatively analyse all small molecule metabolites in the body (typically < 1500 Da), providing the most direct and dynamic reflection of the physiological and pathological state of the organism [20].
In recent years, metabolomics has demonstrated great potential in the field of CRC research, offering a unique perspective for revealing the mechanisms of tumour metabolic reprogramming, discovering new biomarkers, and developing new therapeutic targets [21]. The occurrence and development of CRC are accompanied by complex genetic mutations and abnormal signalling pathways, which directly lead to the reprogramming of cellular metabolism (metabolic reprogramming) to meet the energy, biosynthetic precursors and redox balance requirements of rapidly proliferating cancer cells [22]. In addition, CRC cells also undergo significant changes in amino acid, lipid and nucleotide metabolism. Metabolomics techniques, including nuclear magnetic resonance and mass spectrometry, can systematically depict these metabolic changes, thereby capturing the specific metabolic fingerprints associated with CRC [21, 23]. The differences in metabolic profiles not only exist between healthy and diseased individuals, but are also closely related to the progression stage, pathological classification and prognosis of CRC. For example, compared with early stage (I/II stage) CRC patients, patients with advanced stage (III/IV stage) CRC have significant differences in energy metabolites and lipid profiles in plasma [24, 25]. Chemotherapy and targeted therapy are important treatment methods for CRC, but drug resistance is widespread. Metabolomics can reveal the dynamic changes in metabolic networks before and after treatment, thereby predicting efficacy and elucidating the mechanism of drug resistance [26]. For instance, it has been found that CRC cell lines resistant to 5-fluorouracil exhibit unique lipid and glutamine metabolic characteristics. By monitoring the evolution of patients’ metabolic profiles during treatment, it is possible to provide a basis for timely adjustment of treatment plans and achieve dynamic efficacy assessment [27, 28].
In this study, we analysed the differential metabolites of colon cancer patients and evaluated their role in the diagnosis of colon cancer. We combined metabolomics and transcriptomics analyses to reveal the molecular mechanisms of CRC heterogeneity at the metabolic and genetic levels, and verified them at the cellular level. In this study, through OPLS-DA analysis, we identified 318 metabolites that contribute to the occurrence and development of colorectal cancer, which is consistent with some previous results. Further analysis of the differences revealed that among the 318 metabolites, 42 were upregulated and 30 were downregulated in colorectal cancer. The most significantly upregula-ted metabolites mainly include oestrogen, D-Ribono-1,4- lactone, cyclo(glu-glu), etc., while the most significantly downregulated metabolites mainly consist of methionine, Carnitine C7: DC, D-erythronolactone, etc. These results reveal the heterogeneity in the metabolic processes of proteins and lipids in CRC cells. To investigate whether the metabolites have potential value for the diagnosis of colorectal cancer, we plotted the ROC curves for all 72 different metabolites. Among them, the AUC values of 14 metabolites were greater than 0.6 (data not shown). The area under the curve values of the 4 metabolites were all greater than 0.7, and these metabolites play a significant role in the diagnosis of colorectal cancer. Kyoto Encyclopedia of Genes and Genomes pathway analysis revealed that these differential metabolites were primarily enriched in pathways related to cell communication, material transport, and the metabolism of carbohydrates, lipids, and proteins. The joint transcriptomics analysis revealed that five pathways were enriched in the differential metabolites and differential genes. These pathways were related to cellular substance exchange, protein metabolism, and one-carbon unit metabolism. We plotted a diagram illustrating the regulatory relationships of the differentially expressed genes and metabolites in specific pathways to further clarify the molecular mechanism. In order to further analyse the impact of cellular metabolism on the prognosis of patients, we constructed the prognosis model using the genes from five metabolic pathways. The model indicates that patients with high-risk scores have a poorer prognosis. Through consensus clustering, we found that metabolic genes can be used to classify patients with colorectal cancer, and there are significant differences in prognosis among the different classifications. Finally, we verified the levels of oestrogen, methionine, SLC5A1 and FTCD in the cells using ELISA and western blot. The results confirmed the previous findings. There have been reports stating that oestrogen has a promoting effect on colorectal cancer. Methionine also plays a significant role in nucleotide metabolism and protein metabolism. Methionine primarily participates in the methionine cycle within cells, providing the methyl reserves required for epigenetic modifications such as the methylation of proteins, DNA, and RNA [29]. However, tumour cells often exhibit impaired methionine synthesis capacity, making them highly dependent on exogenous uptake. Therefore, reduced methionine levels in CRC may indicate that therapeutic strategies targeting methionine transporters could be a potentially effective approach for this type of tumour [30]. SLC5A1 is located on the membrane and is a type of glucose transporter [31, 32]. SLC5A1 has been found to be overexpressed in various tumours such as glioma, lung cancer, and pancreatic cancer, but its expression in CRC has been less studied [31, 33, 34]. On the one hand, SLC5A1 interacts with epidermal growth factor receptor (EGFR) to maintain tumour cell proliferation and promote migration; however, this mechanism may not apply to CRC due to the distinct localization of EGFR and SLC5A1 in the colorectal epithelium [35]. SLC5A1 transports glucose for aerobic glycolysis in tumour cells, so its low expression in CRC may possibly make CRC more sensitive to therapeutic strategies targeting aerobic glycolysis. Formimi-doyltransferase cyclodeaminase has also been proven to be related to lipid metabolism in some tumours [36].


