
Introduction
Nanotechnology involves fragmenting materials to the nanometer scale and thus remodeling them at the molecular level into entirely new structures with different functional, physical, and chemical properties. This is due to the larger number of atoms being capable of interacting with biological components and the nature of these interactions being completely different than in the case of normal-size particles [1].
Given the increasing prevalence of nanoparticles in products, including those of everyday use, more insight is warranted not only into the extraordinary potential of this technology, but also into the short-term as well as long-term consequences of its misuse [1]. At present, nanotechnology is widely used in many branches of industry, medicine, pharmaceuticals, cosmetology, electronics, energy, agriculture and environmental monitoring, as well as in food production [2-4]. Gold or copper nanoparticles, nanotubes, or quantum dots offer new possibilities for the diagnosis and treatment of oncological, cardiovascular, and neurodegenerative diseases as well as for the destruction of microorganisms, thus preventing nosocomial infections and postoperative complications. In targeted cancer therapies, as well as in pharmacy and cosmetology, nanoparticles play an important role to encapsulate a substance, drug, vitamin, or fatty acid, thus significantly modifying the stability and bioavailability of active biocomponents [5].
Nanotechnology is used at virtually every stage of the food production chain. In agricultural production and animal husbandry, nanotechnology is used in the development of innovative methods of food production aimed at reducing the use of agrochemicals such as pesticides, antibiotics, and veterinary drugs, as well as in the production of feeds enriched with nutrients or disease protection agents. In animal husbandry, colloidal silver facilitates a reduction in gas emissions resulting from intestinal fermentation or decomposing animal feces while additionally having a bactericidal and fungicidal effect [1, 2, 5-7].
Moving on to the finished products, nanotechnology has been applied to reduce the use of preservatives, salts, fats, and surfactants, as well as to improve the rheological properties and flavors of products. Modern technology facilitates the production of foods that are healthier due to being enriched with vitamins and minerals, as well as tastier and more attractive to potential customers [8-13].
In addition to the agriculture and food production sectors, nanotechnology is also used in food packaging. Novel food packaging systems are designed to act as biosensors monitoring the storage conditions and the quality of the packaged food; packaging can also be “active”, for example by absorbing oxygen and thereby prolonging the freshness of the product. Recent developments include nanobiosensors, nanobeads, and nanobioreceptors facilitating the detection of individual compounds, identification of pathogens in food, water, and the environment, as well as identification of foreign DNA [13, 14].
Nanotechnology offers many opportunities and innovative solutions for the agricultural and food sectors. However, safety issues must be verified in the context of potential toxicity or migration of nanomaterials from the packaging to the food products and their accumulation in the human body to ensure a successful application [14-16].
Material and methods
The aqueous solution of nanosilver (AgNPs) with dimensions of 20 ±5 nm, purchased from Plasma Chem (Berlin, Germany), used for injection was prepared at the Center of Radiology and Biological Dosimetry of the Institute of Nuclear Chemistry and Technology in Warsaw. The concentration of AgNPs in this solution was 5 mg/100 µl of distilled water, and the nanoparticle agglomerates were dispersed by three-minute sonication using a sonication probe (Branson, Danbury, Connecticut, USA). After sonication, 100 µl of 15% bovine serum and 100 µl of 1M phosphate buffer were added to the solution. In the prepared solution, measurements of the physicochemical properties of AgNPs were performed: the nanoparticles had a size of 20 ±5 nm, hydrodynamic diameter of 197.4 ±2.7, polydispersity index of 0.295, and zeta potential value of –33.6 mV. The shape of AgNPs was visualized using a scanning electron microscope (9DSM 942, Carl Zeiss, Göttingen, Germany) at 100,000× magnification.
The in vivo experiment was conducted on 10-week-old male Fischer 344p rats (from Charles River – Saalfeld, Germany) with initial body weight of 206.0 ±1.65 g. Throughout the entire experimental period (28 days of the actual experiment plus 10 days of initial acclimatization) all animals were kept in individual polyurethane cages, with free access to food (Labofeed M) and water, in standard environmental conditions: temperature 23°C, humidity 55%, photoperiod 12 : 12, air exchange 20×/minute. The animal study protocol was approved by the Third Local Ethical Committee in Warsaw (Resolution #35/2014) in accordance with the Polish law and 3R rules (Replacement, Reduction, and Refinement).
After acclimatization, the rats were divided into 4 groups, 8 animals each: 2 control groups and 2 experimental groups. Animals from the experimental group received 20 AgNPs nm in the amount of 5 mg/kg b.w. intravenously as a single dose into the tail vein (group IAg), or 30 mg/kg b.w. per day introduced per os, with a probe directly into the esophagus (group PAg). Rats from the control group were administered 0.9% NaCl solution intravenously in the same way as a single dose (group IK), or per os for 28 days (group PK). After the end of the experiment, the rats were induced into a state of anesthesia by inhalation of isoflurane (Baxter Healthcare, Warsaw, Poland) and exsanguinated from the left ventricle of the heart.
The livers of all rats were homogenized in PBS buffer at pH 7.4 (0.01 M phosphate buffer supplemented with 0.027 M KCl, 0.137 M NaCl, and 1 mM EDTA) (Sigma-Aldrich, St. Louis, USA). The tissue-to-buffer volume ratio was 1 : 10. Homogenization was performed using a Bio-Gen PRO 200 homogenizer (PRO Scientific, Oxford, USA). The homogenate was centrifuged (Multifuge 3L-R centrifuge, Kendro) at 10,000× g for 20 minutes at 4°C. The supernatant obtained after centrifugation (cytosolic fraction of hepatocytes) was aliquoted into 0.5 ml portions, frozen, and stored at −80°C until biochemical analyses were performed.
Determination of glutathione peroxidase (GPx) activity
Glutathione peroxidase activity was determined using a colorimetric method with a commercial assay kit (Cayman Chemical, No. 703102). The liver homogenate supernatant was diluted 25-fold with 50 mM Tris-HCl buffer (pH 7.6) containing 5 mM EDTA. The principle of the assay is based on the conversion of oxidized glutathione to its reduced form in the presence of the cofactor NADPH, according to the following reactions:
The assay was performed on 96-well plates in parallel for blank, control, and experimental samples.
The test kit contained the following reagents:
Enzymatic substrate mixture (50 μl): NADPH, glutathione, and glutathione reductase
Standard: 50 μl of bovine erythrocyte suspension
Supernatant dilution buffer: 50 mM Tris-HCl, pH 7.6, with 5 mM EDTA
Assay buffer: 50 mM Tris-HCl, pH 7.6, with 5 mM EDTA and 1 mg/ml BSA (bovine serum albumin)
Cumene hydroperoxide
Blank sample: 50 μl of enzymatic substrate
Control sample: 100 μl of assay buffer, 50 μl of enzymatic substrate, and 20 μl of standard
Experimental sample: 150 μl of assay buffer, 50 μl of enzymatic substrate, and 20 μl of the test sample (diluted liver homogenate supernatant)
To each prepared sample (blank, control, and experimental), 20 μl of cumene hydroperoxide was added, mixed thoroughly, and absorbance was measured at 340 nm. Enzyme activity was calculated according to the following formula:
where:
– the molar extinction coefficient for NADPH at 340 nm is 0.00622 μM-1· cm-1
Determination of catalase activity
Reaction mixtures contained a 13-fold diluted sample composed of 800 μl of liver homogenate supernatant, 150 μl of phosphate buffer (250 mM, pH 7.0), 150 μl of methanol (12 M), and 30 μl of hydrogen peroxide (44 mM). After 15 minutes of incubation, 450 μl of Purpald reagent (containing 4 ml of 4-amino-3-hydrazino-5-mercapto-1,2,4-triazole in 0.5 M hydrochloric acid) was added. Following an additional 15-minute incubation, 150 μl of potassium periodate (65.2 mM in 0.5 M KOH) was added, and absorbance was measured at 550 nm. Catalase activity was calculated based on a calibration curve.
Determination of carbonyl group concentration
Protein carbonyl group concentration was determined using a colorimetric method with a commercial assay kit (Cayman Chemical, No. 10005020). The method is based on the reaction between 2,4-dinitrophenylhydrazine (DNPH) and protein carbonyl groups.
The following reagents were used: Hydrochloric acid (HCl)
2,4-dinitrophenylhydrazine (DNPH)
Trichloroacetic acid (TCA)
Guanidine hydrochloride
Ethanol
Ethyl acetate
After initial absorbance measurement at 260-280 nm, samples yielding values below 1 – indicative of a high nucleic acid content – were incubated with streptomycin, as nucleic acids may interfere with accurate determination of protein carbonyl content. The prepared material was then divided into experimental and control samples. DNPH (800 μg) was added to the experimental samples, while 800 μg of HCl was added to the control samples. After 1 hour of incubation in the dark with periodic vortexing, 1 ml of 20% TCA was added to all samples, followed by centrifugation at 10,000× g for 10 minutes at 4°C. The supernatant was discarded, and the pellet was resuspended in 10% TCA and centrifuged again under the same conditions.
Subsequently, the pellet was washed three times with a mixture of ethanol and acetone, with centrifugation after each wash. The final pellet was dissolved in 500 μl of guanidine hydrochloride and centrifuged once more. From the resulting supernatant, 200 μl was transferred to a 96-well plate, and absorbance of both experimental and control samples was measured at 360 nm.
Protein carbonyl group concentration was calculated using the following formula:
where:
Statistical analysis
Statistical analysis was performed using Statgraphics Centurion 12 software. For all parameters, a two-way analysis of variance (ANOVA) was conducted, with the type of administered substance (AgNPs or 0.9% NaCl) and the route of administration to rats (injection or oral, per os) considered as the main factors. The normality of data distribution was assessed using the Shapiro-Wilk test, and the significance of differences between groups was evaluated using Fisher’s post hoc test. Differences were considered statistically significant at p ≤ 0.05. Results are presented in tables and figures as mean values with standard errors (mean ± SE).
Results
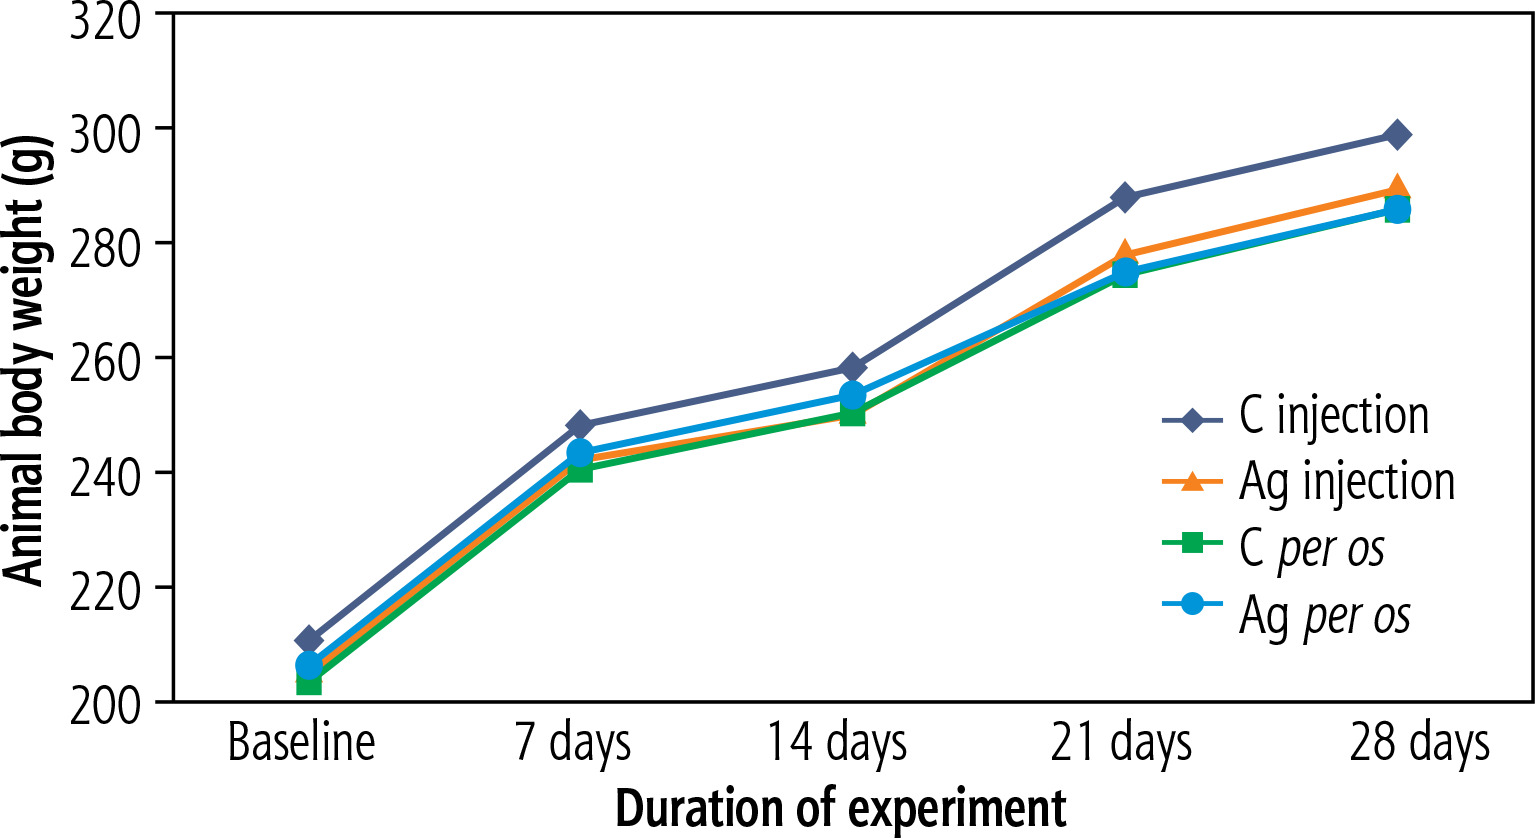
The baseline and final body weights of the animals in individual groups and the total weight gains are shown in Table 1, while the growth curves are illustrated in Figure 1. The baseline body weight of animals was equal in all groups and averaged 206.0 ±1.65 g. Regarding the final body weight and total weight gains, the ANOVA analysis of variance revealed no significant differences between the routes of administration or the administered formulations (AgNPs vs. NaCl). The overall health of all animals throughout the experiment was good. The intake of food in the intervention groups did not differ from that in healthy animals.
Table 1
Baseline and final weights of animals and total weight gain in each group (mean ± SE)
Fig. 1
Changes in body weight of model animals by week of exposure to silver nanoparticles as administered by the intravenous or oral route
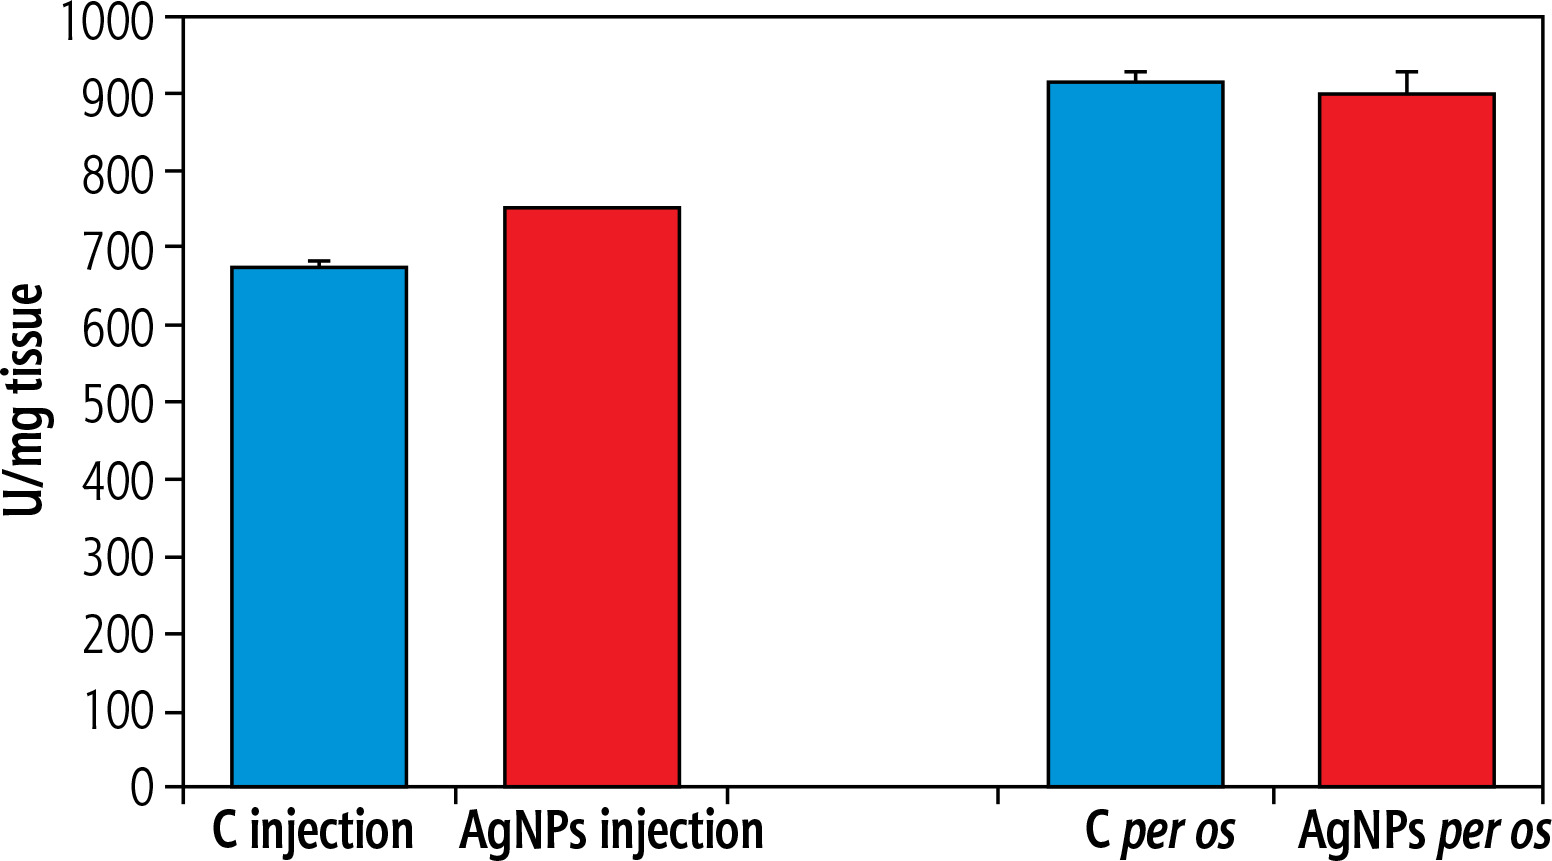
Glutathione peroxidase (GPx) activity following a single intravenous administration was statistically significantly higher (p ≤ 0.005) in the experimental group compared with the control group. Figure 2 illustrates the changes in the supply path. No such relationship was observed for the oral (per os) route of administration. A statistically significant difference in the concentration of carbonyl groups was observed following oral administration, with higher levels in the control group than in the experimental group (p ≤ 0.001).
Fig. 2
Hepatic glutathione peroxidase activity in rats exposed to silver nanoparticles administered by intravenous vs. oral routes
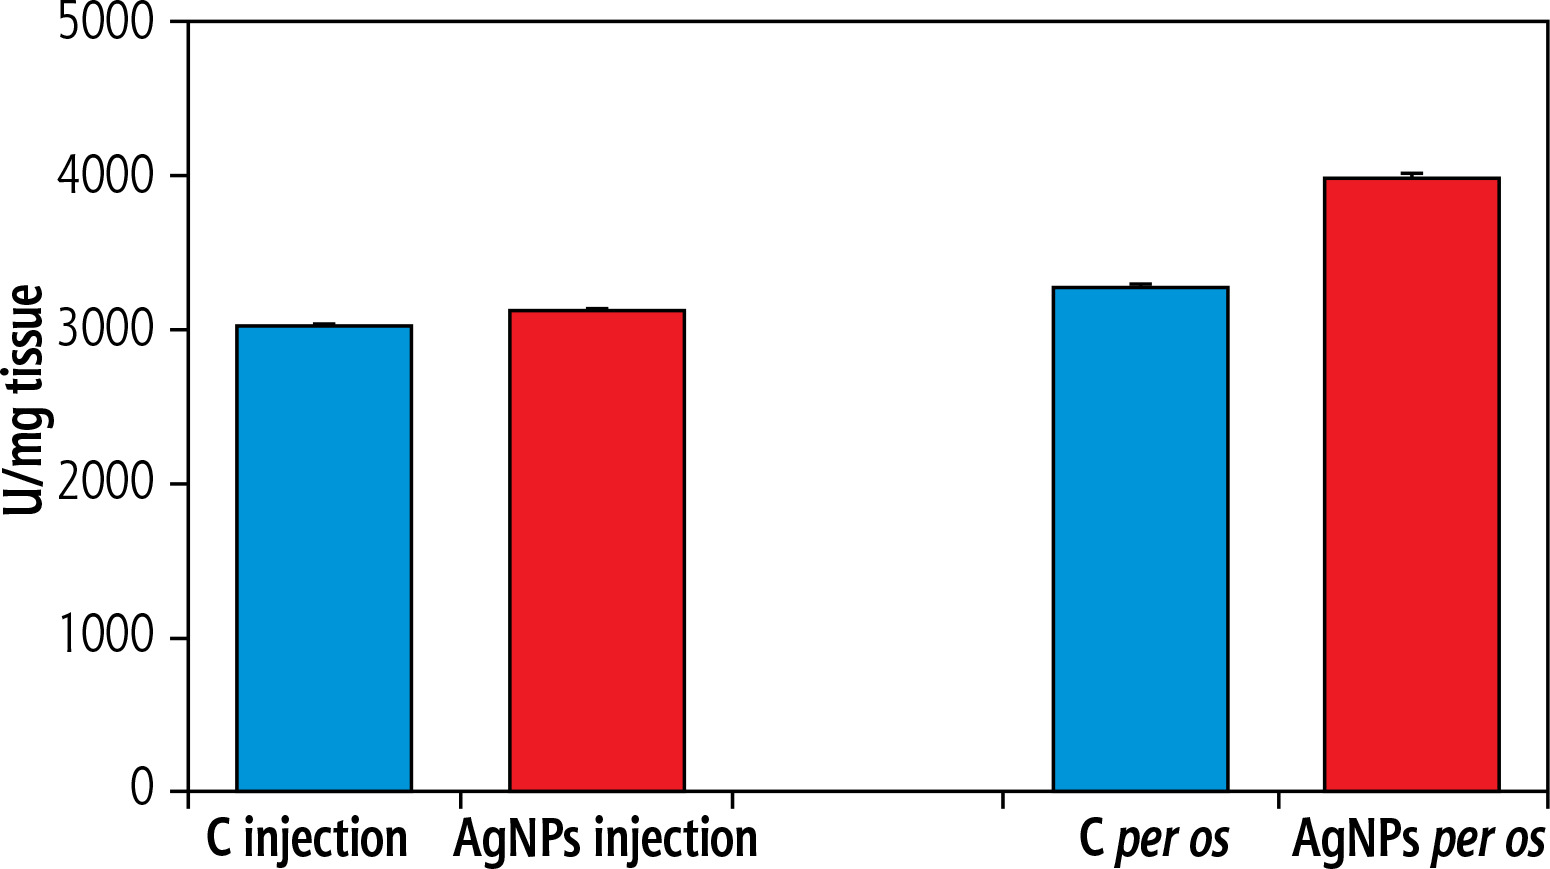
Catalase activity was similar in all experimental interventions as well as control groups, as can be seen in Figure 3.
Fig. 3
Hepatic catalase activity in rats exposed to silver nanoparticles administered by intravenous vs. oral routes
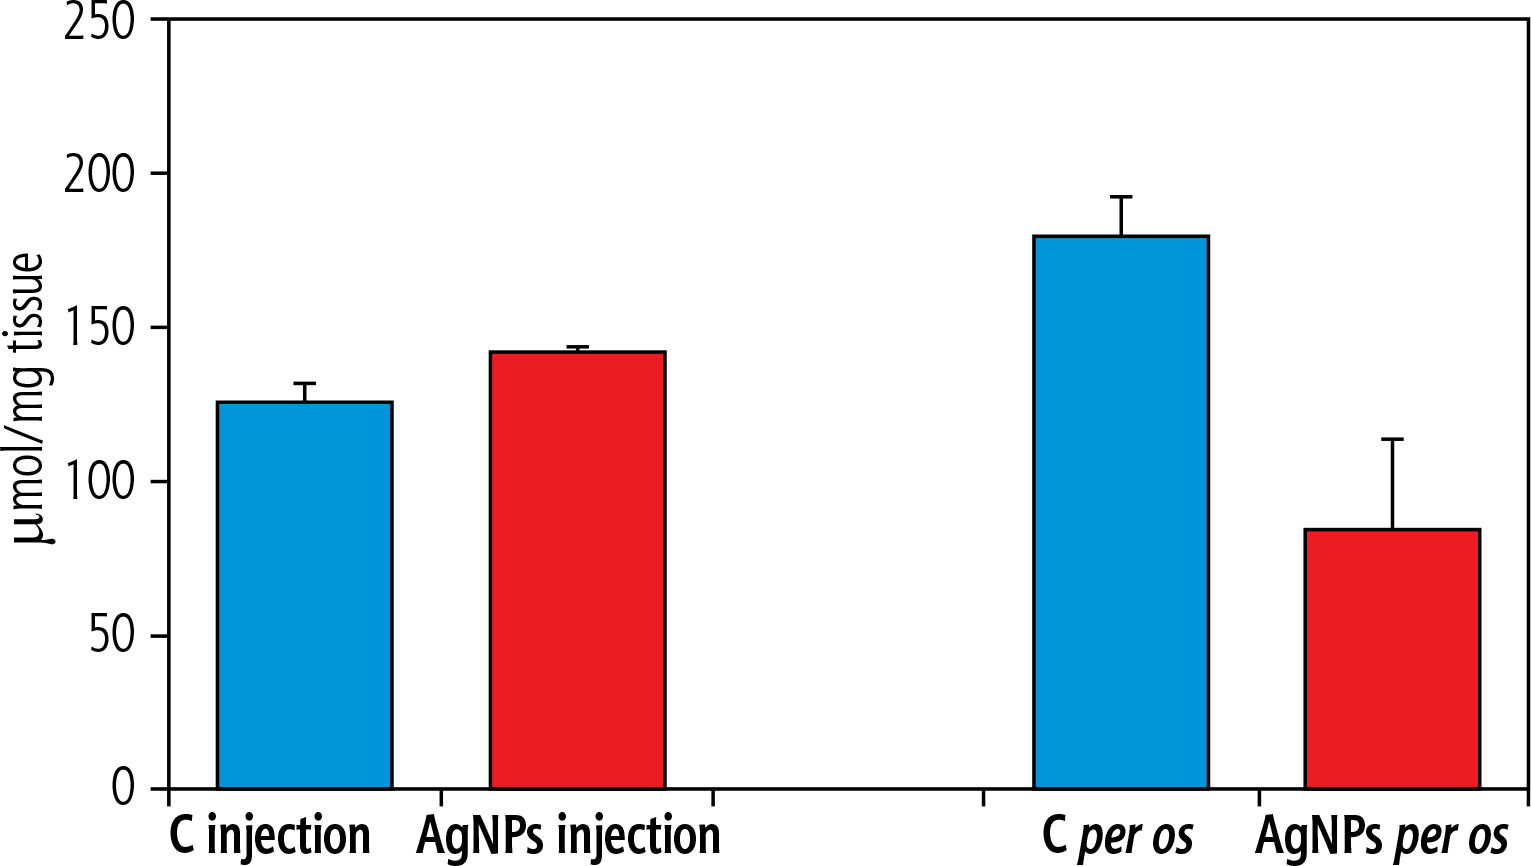
The level of carbonyl groups was higher in the control groups. The relationship between the two active formulations and the route of administration remained statistically significant (p ≤ 0.001), as shown in Figure 4. Rats receiving nanosilver by the oral route exhibited lower concentrations of carbonyl groups than the control groups (p ≤ 0.01). In contrast, rats receiving nanosilver by the intravenous route showed no statistically significant difference in carbonyl levels compared to the control group.
Discussion
As indicated by numerous scientific studies, including those cited in the present article, silver nanoparticles are components of many dietary supplements, products commonly used in medicine, as well as items applied in everyday life. Despite this widespread use, there is still a lack of research defining safe exposure doses, particularly with respect to the route of administration. Studies published in 2017 provide data on a provisional tolerable dose of intravenously administered AgNPs, established at 0.14 μg/kg body weight [17].
The present experimental study investigated AgNP administration via both intravenous and oral routes. The per os group received a literature-supported ‘no observed adverse effect level’ (NOAEL) dose [18], i.e. 30 mg/kg body weight/day for 28 days, whereas the second group received a single intravenous injection at a dose of 5 mg/kg body weight.
Throughout the study period, animals showed a progressive increase in body weight, and a slight, statistically non-significant difference was observed, with experimental animals exhibiting lower body weight than control animals on day 28 of the experiment, despite no differences in food intake. Similar results were reported in other studies [19], in which Wistar rats were exposed to silver nanoparticles at a dose of 9 mg/kg body weight for 28 days. A reduced rate of body weight gain was observed compared to controls, accompanied by changes in the mass of internal organs, including a decrease in thymus weight. In a study by Kim et al., administration of 125 and 500 mg/kg body weight to Fischer 344 rats resulted in a statistically significant reduction in body weight gain, despite no differences in food and water intake [20].
Regardless of the route of administration – which primarily affects the rate of nanoparticle distribution within the organism – nanosilver accumulates mainly in liver and lung cells, leading to increased oxidative stress and activation of antioxidant enzymes. In response to excessive accumulation of reactive oxygen species (ROS), the organism initiates defense mechanisms against pathogens and oxidative stress. Evidence from the cited studies suggests that the induction of oxidative stress at the cellular level results in a slowdown of overall organismal growth [21].
Glutathione peroxidase (GPx) activity following a single intravenous administration was statistically significantly higher (p ≤ 0.005) in the experimental group compared with the control group. No such relationship was observed for the oral (per os) route of administration. A statistically significant difference in carbonyl group concentration was observed following oral exposure, with higher levels detected in the control group than in the experimental group (p ≤ 0.001).
Interestingly, in the group of rats receiving a single intravenous dose of nanosilver – lower than the dose administered daily to the second group via the esophagus – more pronounced responses were observed, including reduced body weight gain and increased glutathione peroxidase activity, compared with the control group. A single intravenous dose may represent a physiological shock to the organism due to the rapid systemic distribution of nanoparticles via the bloodstream. In contrast, long-term oral administration of nanosilver may allow the organism to adapt to regular exposure, particularly since gastrointestinal administration slows systemic distribution relative to intravenous delivery. Moreover, the physiological responses observed in animals exposed via the per os route may be less reliable due to the stress experienced daily during the administration procedure itself.
Increased expression of glutathione peroxidase is indicative of oxidative stress within cells and the normal functioning of the immune system. Disturbed immune function due to oxidative stress results in cell apoptosis due to the absence of an antioxidant response. It follows that low glutathione peroxidase activity can indicate either the absence of oxidative stress or the exhaustion of the cell’s antioxidant capacity [22].
No statistically significant differences in catalase activity were observed, regardless of the experimental group or the route of exposure.
Catalase is found in animal, plant, and bacterial cells as an enzyme protecting organisms from the toxic effects of hydrogen peroxide. The CAT enzyme is mainly present within peroxisomes, mitochondria, endoplasmic reticulum, liver, and bone marrow cells. In the body, catalase neutralizes H2O2 and O2 while oxidizing hydrogen-donor compounds, such as ethanol, methanol, or phenol [23].
Decreased catalase activity is observed in the natural history of numerous diseases, including tuberculosis, pneumonia, diabetes, and atherosclerosis. In addition, the phenomenon is observed during the onset of neurodegenerative diseases. Diseases preceded by severe inflammation are accompanied by an increase in plasma catalase activity. It was shown that excess hydrogen peroxide evading breakdown due to catalase deficiency damages pancreatic β-cells, thus indicating the presence of long-term, debilitating oxidative stress in the cells. A marked reduction in catalase activity has been observed in many types of cancer, including head and neck, lung, gastrointestinal, breast, kidney cancer, and leukemia [24].
In recent years, increasing attention has been paid to the role of oxidative stress and chronic inflammation in the development of protein damage within cells, largely due to the significance of protein oxidation in the aging process and in numerous age-related pathological conditions. Studies conducted in patients with chronic nonspecific inflammatory bowel disease have demonstrated that affected children exhibited significantly higher concentrations of carbonyl groups in plasma proteins compared with healthy controls, indicating an increased level of protein carbonylation in organisms experiencing chronic oxidative stress [25]. Moreover, oxidative stress in cells may also lead to damage to deoxyribonucleic acid (DNA), potentially resulting in DNA mutations. Consequently, there is an ongoing search for sensitive indicators of these processes. The determination of protein carbonyl groups appears to be a useful marker of protein damage induced by ROS [26].
In the present study, a statistically significant difference in the concentration of protein carbonyl groups was observed depending on whether the control or experimental group was analyzed. Higher concentrations were detected in the control groups regardless of the route of administration. A statistically significant result was observed following oral (per os) administration, where the control group exhibited significantly higher carbonyl group concentrations compared with the experimental group. This finding may indicate the effective action of antioxidant enzymes, such as glutathione peroxidase and catalase, whose increased levels were observed in the per os group. These enzymes likely slowed the progression of oxidative stress and, consequently, oxidative protein damage, for which protein carbonyl content serves as a marker [22].
Summary and conclusions
In summary, the present study did not demonstrate a strong oxidative effect of silver nanoparticles on liver hepatocytes; however, there remains a need for much more precise and extensive investigations to rigorously determine safe exposure doses, considering the route of administration and the duration of exposure.
Systemic exposure to silver nanoparticles, regardless of the route of administration, can result in oxidative imbalance and, consequently, irreversible cellular damage leading to the development of diseases. Considering current research, silver nanoparticles show toxic effects following both acute and chronic exposure. This should be considered an important argument for the development of a system for the classification of nanomaterials in terms of their safety, application standards, and risk assessment methods.


