
Summary
This study underscores the significance of cardiomyocyte-specific cell-free DNA (CS cfDNA) levels as a pivotal biomarker for predicting the onset of heart failure (HF) after ST-segment elevation myocardial infarction (STEMI). To fully realize its potential, future research should investigate the biological mechanisms of CS cfDNA, while also exploring its viable applications in the clinical management of STEMI and HF. Furthermore, conducting larger-scale, multicentric clinical trials aimed at validating the accuracy and robustness of CS cfDNA as a predictive marker will pave the way for innovative risk stratification and tailored treatment paradigms for STEMI patients.
Introduction
Acute myocardial infarction (AMI), especially acute ST-segment elevation myocardial infarction (STEMI), is a critical emergency in the cardiovascular system. With its high incidence and mortality rates, it poses a severe threat to patients’ quality of life [1–3]. During the progression of STEMI, the development of heart failure (HF) often indicates further deterioration of the condition and poor prognosis [4–6]. Therefore, identifying biomarkers that can accurately predict the risk of HF after STEMI is of crucial significance for optimizing clinical management strategies and improving patient prognosis.
Circulating cell-free DNA (cfDNA), as an innovative biomarker, has shown considerable potential in various disease studies [7, 8]. cfDNA mainly originates from cellular release due to apoptosis or necrosis, and its genetic content reflects cellular damage and death within the body [9, 10]. Recent research indicates that tissue-specific methylation patterns present in cfDNA can be used to determine their tissue of origin, thereby enabling inferences about cell death in specific tissues through cfDNA analysis [11–13].
This study centered on patients diagnosed with STEMI and sought to explore the diagnostic value of measuring circulating cardiomyocyte-specific cfDNA (CS cfDNA) levels as predictors of HF risk after STEMI.
Aim
We quantitatively assessed CS cfDNA by employing advanced methods based on tissue-specific methylation patterns while integrating patient clinical data to evaluate the correlations between CS cfDNA levels and subsequent HF risk after STEMI.
Material and methods
Study design and participants
In this single-center investigation, patients who experienced their first STEMI and were admitted to the Chest Pain Center, between January and December 2022, were recruited. All patients adhered to the diagnostic criteria for STEMI as stipulated in the third global unified definition of myocardial infarction [14]. Eligible patients underwent primary percutaneous coronary intervention (PPCI) in accordance with the criteria for myocardial revascularization. The exclusion criteria encompassed: (1) Killip class ≥ 2; (2) less than 18 years old; (3) creatinine clearance < 30 ml/min; (4) takotsubo cardiomyopathy or acute pericarditis. As a result, the comprehensive final analysis encompassed a total of 146 patients (Figure 1).

In accordance with the CS cfDNA concentration at admission, the recruited patients were divided into two groups: D1 (CS cfDNA ≤ 164 copies/ml) and D2 (CS cfDNA > 164 copies/ml).
Follow-up
The follow-up of the cohorts extended until June 1st, 2024. Follow-up information was obtained either through telephone contact or when patients returned for outpatient clinic visits. The median follow-up time was 355 days (interquartile range, IQR: 295–400 days). In this investigation, HF was designated as a primary adverse cardiovascular event. The prevalence of HF among STEMI patients was evaluated according to the 2021 European Society of Cardiology (ESC) Guidelines [15].
Data collection
Clinical and biochemical parameters were retrieved from electronic health records, encompassing detailed medical histories and patient characteristics. The preliminary assessment of N-terminal pro-B-type natriuretic peptide (NT-proBNP) and cardiac troponin I (cTnI) levels upon patient arrival was carried out in the emergency department using the AQT90 FLEX analyzer, produced by Radiometer Medical ApS located in Bronshoj, Denmark. The obtained data were then carefully extracted from the clinical records for further analysis. Within the first 24 h of hospital admission, various biochemical parameters were evaluated and recorded, including soluble suppression of tumorigenicity 2 (sST2), C-reactive protein (CRP), low-density lipoprotein cholesterol (LDL-C), blood urea nitrogen (BUN), sodium (Na), hemoglobin (Hb), hemoglobin A1c (HbA1c), aspartate transaminase (AST), and creatine kinase-MB (CK-MB). The echocardiographic procedure was performed and meticulously evaluated by a senior echocardiologist, who was blinded to clinical data, on the day immediately following hospital admission.
Copy number determination of CS cfDNA
Blood samples were collected from all patients prior to PPCI. All samples in EDTA anticoagulated tubes were promptly placed on ice. Within 4 h of sample collection, plasma was separated through two centrifugations (first at 1600 × g for 10 min, followed by 16000 × g for 10 min, both at 4°C). The MagMAX Cell-Free DNA Purification Kit (Cat. No. A29319, Thermo Fisher Scientific) was used to extract cfDNA from a 1 ml plasma sample, which was then kept at –80°C for storage.
The EZ DNA Methylation-Lightning Kit from Zymo Research was employed for the bisulfite conversion process of the cfDNA, in strict accordance with the recommended protocol provided by the manufacturer. The bisulfite-treated cfDNA sample underwent digital PCR analysis for the detection of the FAM101A locus, employing the advanced Quant Studio 3D digital PCR system manufactured by Applied Biosystems. The sample’s unmethylated FAM101A locus copy count is further represented as the concentration of cardiac-specific cfDNA within each milliliter of plasma.
Definition of post-STEMI HF and assessment method as primary endpoint
In this study, post-STEMI HF referred to symptoms and signs of HF that occur in patients after an acute STEMI event, which meets the diagnostic criteria specified in the 2021 European Society of Cardiology (ESC) Guidelines [15]. Specifically, this includes but is not limited to the following clinical manifestations and assessment indicators: 1) Clinical manifestations, 2) Physical signs, 3) Imaging examinations (echocardiography), 4) Biomarkers (NT-proBNP, BNP). These indicators can be used to diagnose the occurrence of post-STEMI HF.
Post-STEMI HF was set as the primary study endpoint, and its assessment method mainly includes the following aspects: 1) Follow-up period setting (the median follow-up time was approximately 355 days). 2) Data collection (through telephone follow-ups and re-examinations, symptoms and signs of HF were recorded to confirm whether they met the HF diagnostic criteria). 3) HF event determination (confirmation of the occurrence of HF events based on the collected data and diagnostic criteria). Statistical analysis (Kaplan-Meier analysis was used to estimate the time-dependent risk of HF in patients with different levels of CS cfDNA. The log-rank test was applied to compare differences in HF risk between groups. The Cox proportional hazards regression model was used to assess the impact of CS cfDNA levels and other potential confounding factors on HF risk. ROC curve analysis was used to evaluate the diagnostic accuracy of CS cfDNA, NT-proBNP, and sST2 in predicting post-STEMI HF).
Therefore, by clearly defining post-STEMI HF and adopting a systematic assessment method, this study successfully verified the effectiveness and reliability of CS cfDNA levels as a risk prediction indicator for heart failure after STEMI.
Statistical analysis
The representation of continuous variables was contingent upon their distribution, being presented either as mean ± standard deviation (SD) or median (IQR). Categorical variables were presented as frequencies and percentages.
Receiver operating characteristic (ROC) curve analysis determined that 164 copies/ml serves as the optimal threshold for CS cfDNA in predicting HF occurrence. This cutoff was subsequently used to categorize patients into two groups: N1 – low-CS cfDNA group (≤ 164 copies/ml) and N2 – high-CS cfDNA group (> 164 copies/ml). In comparing the two groups, independent samples t-tests or Mann-Whitney U tests were administered for continuous variables, and for categorical variables, χ2 tests were applied.
The correlation between CS cfDNA and other variables was assessed using Spearman’s rank correlation analysis. To examine the association between CS cfDNA concentrations and the development of HF post-STEMI, Kaplan-Meier survival curves were plotted. Additionally, log-rank statistical tests were administered to evaluate differences in survival distributions across groups. Cox proportional hazards regression models were used to assess hazard ratios (HRs) alongside their corresponding 95% confidence intervals (CIs). Applying a variance inflation factor cutoff point of 10, the degree of multicollinearity in multivariate models was investigated. When constructing the multivariate Cox regression model in this study, a strategy was adopted where variables with a p-value less than 0.1 in the univariate analysis were included in the multivariate analysis. The selection of adjusted variables for the diverse multivariate models was performed using the “enter” methodology, adhering strictly to the outcomes of the single-factor analysis and clinical evaluation. The “clinical assessment” here mainly includes following aspects: LDL-C and hyperlipidemia, NT-proBNP, cTnI and CK-MB, sST2, number of diseased vessels, and Gensini score. These variables are closely related to cardiac remodeling and post-STEMI HF; adjusting them can control the potential impact of severity of coronary artery disease on the results. This encompassed factors such as LDL-C, hyperlipidemia, NT-proBNP, cTnI, CK-MB, sST2, number of affected vessels, and the Gensini score. Ultimately, two multivariable regression models remained.
ROC curve analysis was performed to measure the diagnostic accuracy of CS cfDNA, NT-proBNP, and sST2 in predicting the onset of HF after STEMI. For each biomarker, we computed the area under the curve (AUC) along with a 95% confidence interval, and subsequently evaluated statistical differences between the curves using the pROC package. A restricted cubic spline (RCS) approach was employed to examine the non-linear association between plasma CS cfDNA levels and the subsequent risk of HF in patients after STEMI, with adjustments made for the identical set of confounding factors as in the Cox regression analyses.
The entire statistical analysis process was conducted using SPSS, version 26.0 (IBM Corp., Armonk, NY, USA), in conjunction with R statistical software, version 4.0.3. The level of statistical significance was set at p < 0.05.
Results
Baseline characteristics of patients
After the exclusion of inappropriate cases, a total of 146 STEMI patients were recruited for the study, among whom 93 patients were assigned to Group N1 (CS cfDNA ≤ 164 copies/ml) and 53 patients to Group N2 (CS cfDNA > 164 copies/ml). The baseline demographic and clinical data of the two groups were compared (Table I).
Table I
Baseline characteristics of STEMI patients with different copy levels of CS cfDNA
[i] Values are mean ± SD, n (%), or median (IQR). BMI – body mass index, CKD – chronic kidney disease, COPD – chronic obstructive pulmonary disease, CS cfDNA – cardiac-specific cell-free DNA, DBP – diastolic blood pressure, HR – heart rate, IQR – interquartile range, LAD – left anterior descending artery, LCx – left circumflex artery, LVEF – left ventricular ejection fraction, PPCI – primary percutaneous coronary intervention, RASI – angiotensin converting enzyme inhibitors/angiotensin receptor blockers, RCA – right coronary artery, SBP – systolic blood pressure, STEMI – ST-elevation myocardial infarction, Time of D to W – door-to-wire crossing time, TIMI – Thrombolysis in Myocardial Infarction, SD – standard deviation, WMSI – wall motion score index, eGFR – estimated glomerular filtration rate, NT-proBNP – N-terminal B-type natriuretic peptide, CRP – C-reactive protein, LDL-C – low-density lipoprotein cholesterol, BUN – blood urea nitrogen, Na – sodium, Hb – hemoglobin, HbA1c – hemoglobin A1c, AST – aspartate transaminase, cTnI – cardiac troponin I, CK-MB – creatine kinase-MB.
The mean age of the entire cohort was 59.44 ±1.29 years, with no statistically significant difference between Group N1 (59.07 ±1.67 years) and Group N2 (59.9 ±1.97 years; p = 0.78). A comparable proportion of male patients was observed in both groups (71% in Group N1 vs. 77.4% in Group N2; p = 0.49). No significant differences were noted in LDL-C concentrations, body mass index (BMI), smoking habits, diabetes mellitus frequency, hypertension prevalence, hyperlipidemia cases, chronic kidney disease (CKD), chronic obstructive pulmonary disease (COPD), systolic blood pressure (SBP), diastolic blood pressure (DBP), or heart rate (HR).
In relation to cardiovascular comorbidities, no significant differences were noted in the distribution of infarct-related arteries (LAD, LCx, RCA, or uncertain culprit vessels), number of affected vessels (single, double, or multivessel), or the location of infarction (anterior, inferior, or others). Similarly, the TIMI flow grades following PPCI (> 2.0) were comparable between the groups.
However, several biochemical markers and laboratory test results displayed significant differences. Group N2 exhibited significantly higher levels of cTnI, CK-MB and sST2 compared to Group N1 (cTnI: 1.65 ng/ml vs. 1.20 ng/ml, p = 0.013; CK-MB: 34.0 U/l vs. 20.6 U/l, p = 0.008; sST2: 39.0 ng/ml vs. 27.9 ng/ml, p < 0.001). Additionally, the prevalence of HF was markedly greater in Group N1 than in Group N2 (77.4% vs. 18.3%, p < 0.001).
At baseline, medication usage was similar between the two groups, with a high proportion of patients receiving angiotensin-converting enzyme inhibitors/angiotensin receptor blockers (RASI), β-blockers, statins, and aspirin. The proportion of diuretic usage was higher, although not significantly, in Group N2 (18.7% vs. 8.6%; p = 0.09).
In terms of procedural and hospitalization parameters, there were no significant differences in door-to-wire crossing time, time from chest pain onset, or hospitalization duration between the two groups.
Correlation analysis of CS cfDNA levels with key biomarkers
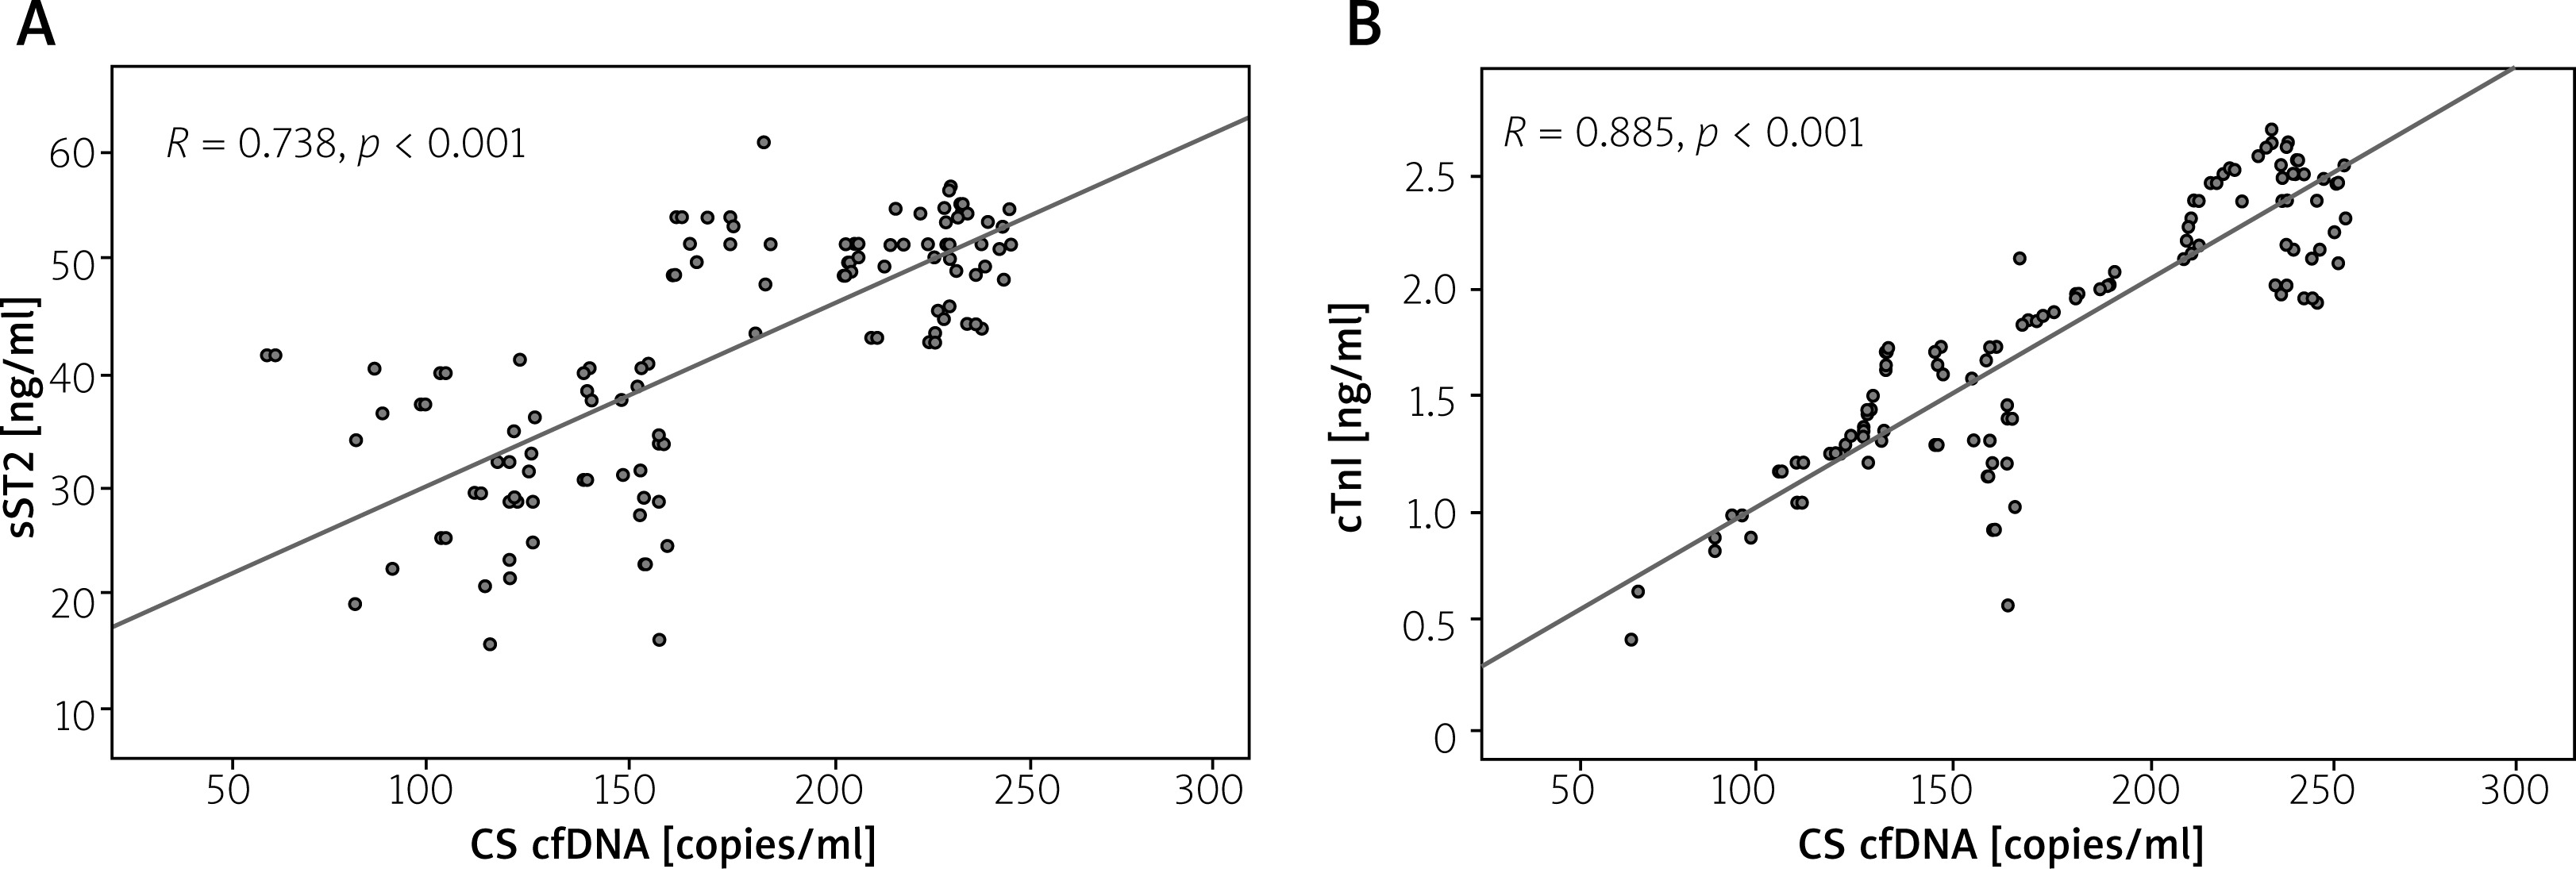
To gain a more comprehensive understanding of the differences within the study subjects across the two groups, a comparative assessment of essential biochemical markers, particularly cTnI and sST2, was performed between the two cohorts. According to Figure 2, the initial plasma levels of cTnI and sST2 were notably higher in patients belonging to the high CS cfDNA group compared to those in the low CS cfDNA group. Further correlation analysis conclusively established a substantial linear relationship between the level of CS cfDNA and the concentrations of both cTnI (R = 0.885, p < 0.001; Figure 2 B) and sST2 (R = 0.738, p < 0.001; Figure 2 A) upon admission, highlighting the significance of these associations.
Figure 2
Correlation analysis of CS cfDNA levels and biomarkers at admission. A – sST2. B – cTnI
cTnI – cardiac troponin I, CS cfDNA – cardiac-specific cell-free DNA, sST2 – soluble suppression of tumorigenicity 2.
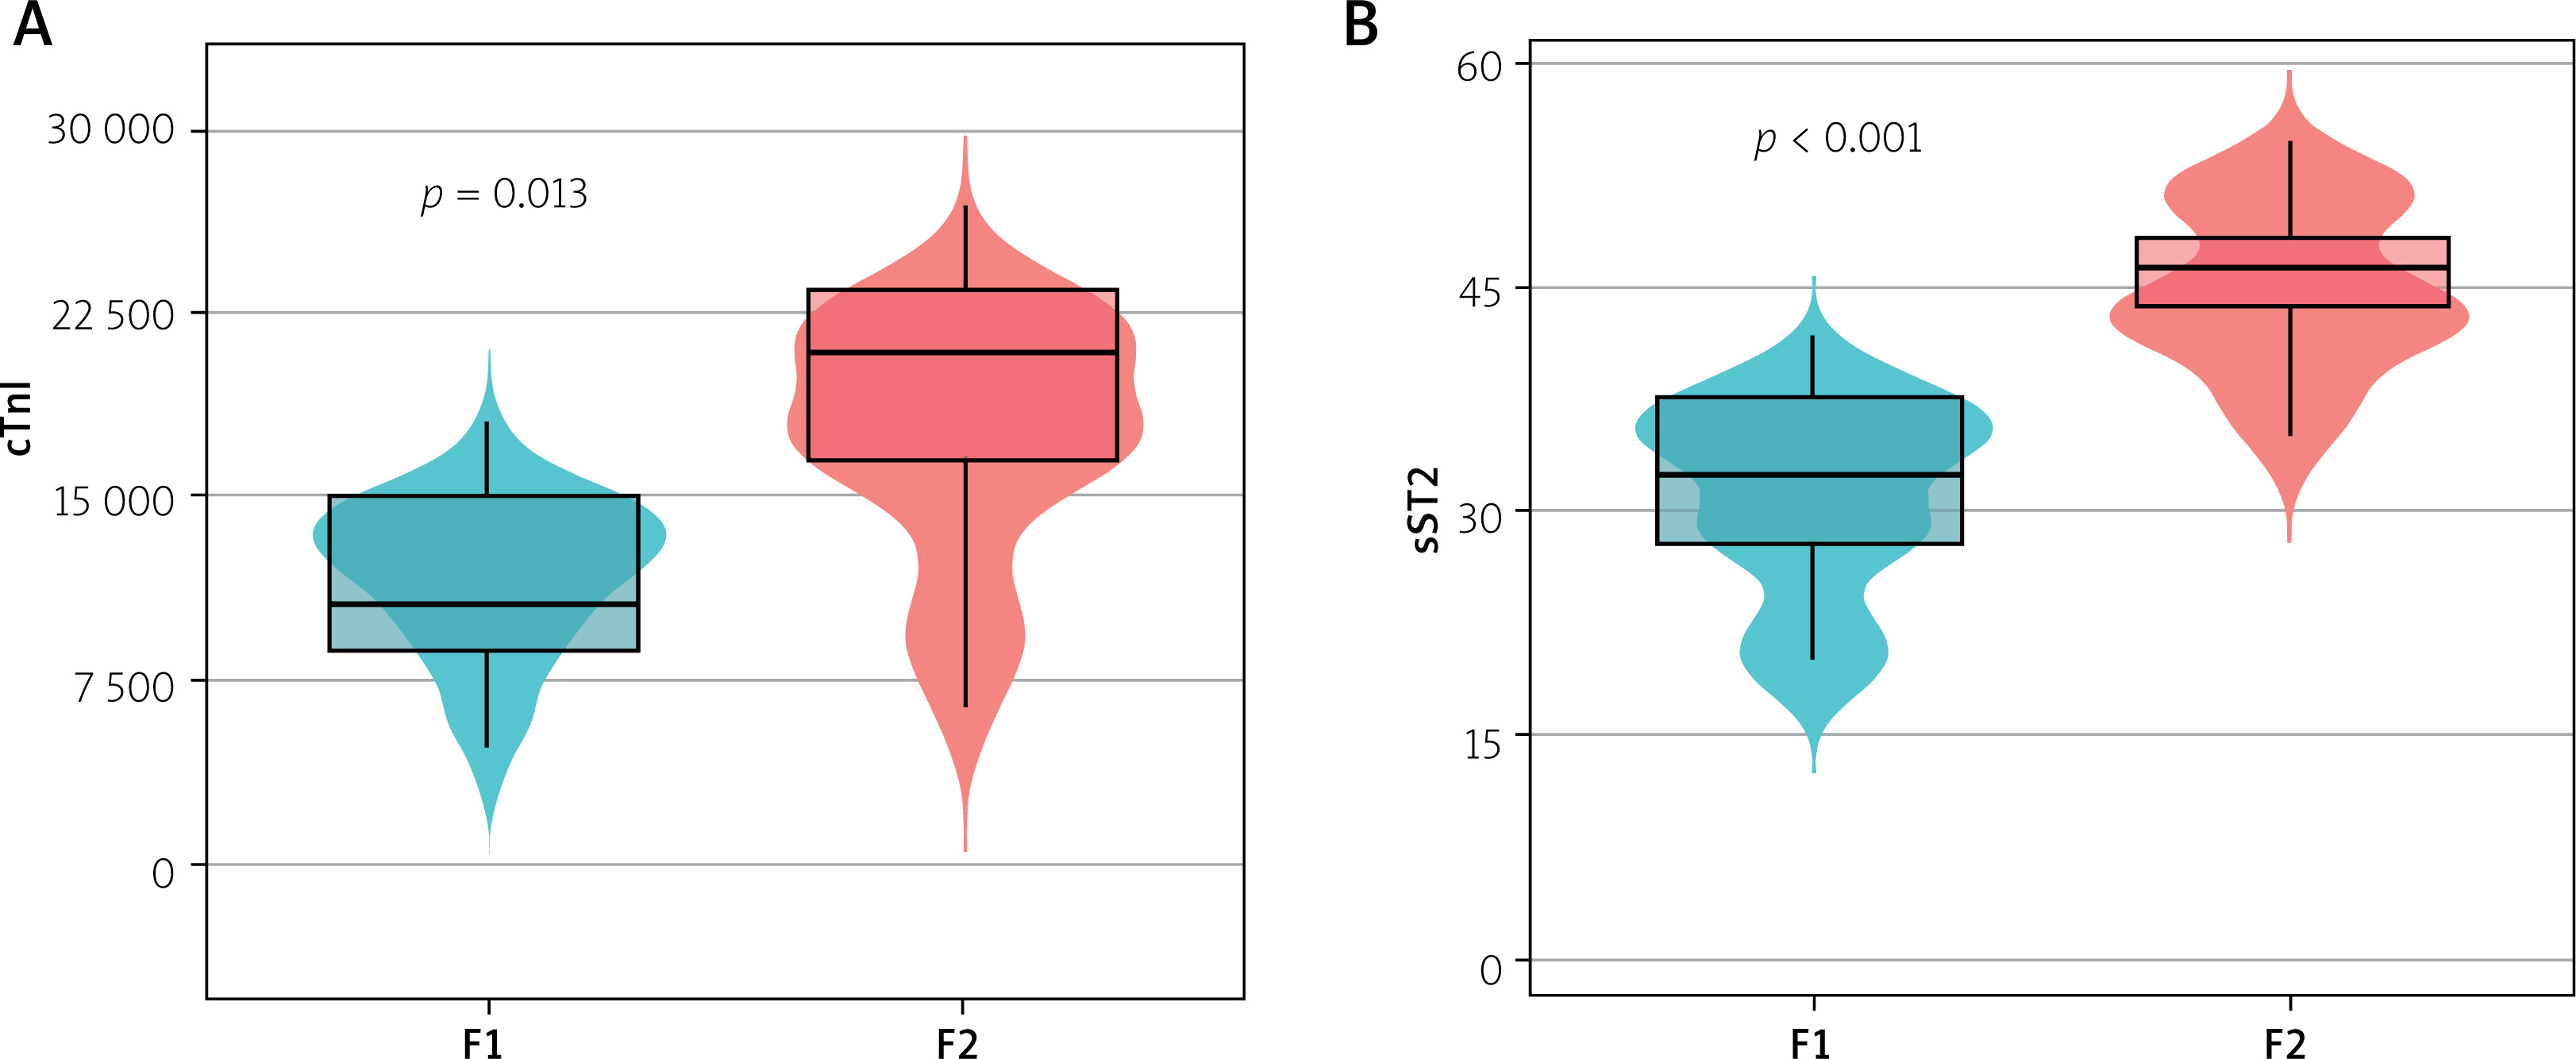
According to the median level of CS cfDNA, patients were classified into two groups: F1 (low-CS cfDNA group, with ≤ 109 copies/ml) and F2 (high-CS cfDNA group, with > 109 copies/ml). The levels of cTnI and sST2 were significantly elevated in patients with high CS cfDNA compared to those in the low-CS cfDNA cohort, as illustrated in Figure 3.
Figure 3
Box plots showing differences in cTnI and sST2 between the two groups. Horizontal lines denote the 10th, 25th, 50th, 75th, and 90th percentiles. Differences between groups were compared using independent samples Mann-Whitney U test. According to the median of the CS cfDNA levels, patients were divided into 2 groups: F1 (CS cfDNA ≤ 109 copies/ml) and F2 (CS cfDNA > 109 copies/ml). A – cTnI levels of F2 patients were higher than those of F1 patients (F1 compared to F2, p < 0.001); B – sST2 levels of F2 patients were higher than those of F1 patients (F1 compared to F2, p < 0.001)
cTnI – cardiac troponin I, CS cfDNA – cardiac-specific cell-free DNA, sST2 – soluble suppression of tumorigenicity 2, F1 – CS cfDNA ≤ 109 copies/ml, F2 – CS cfDNA > 109 copies/ml.
CS cfDNA level at admission and HF risk
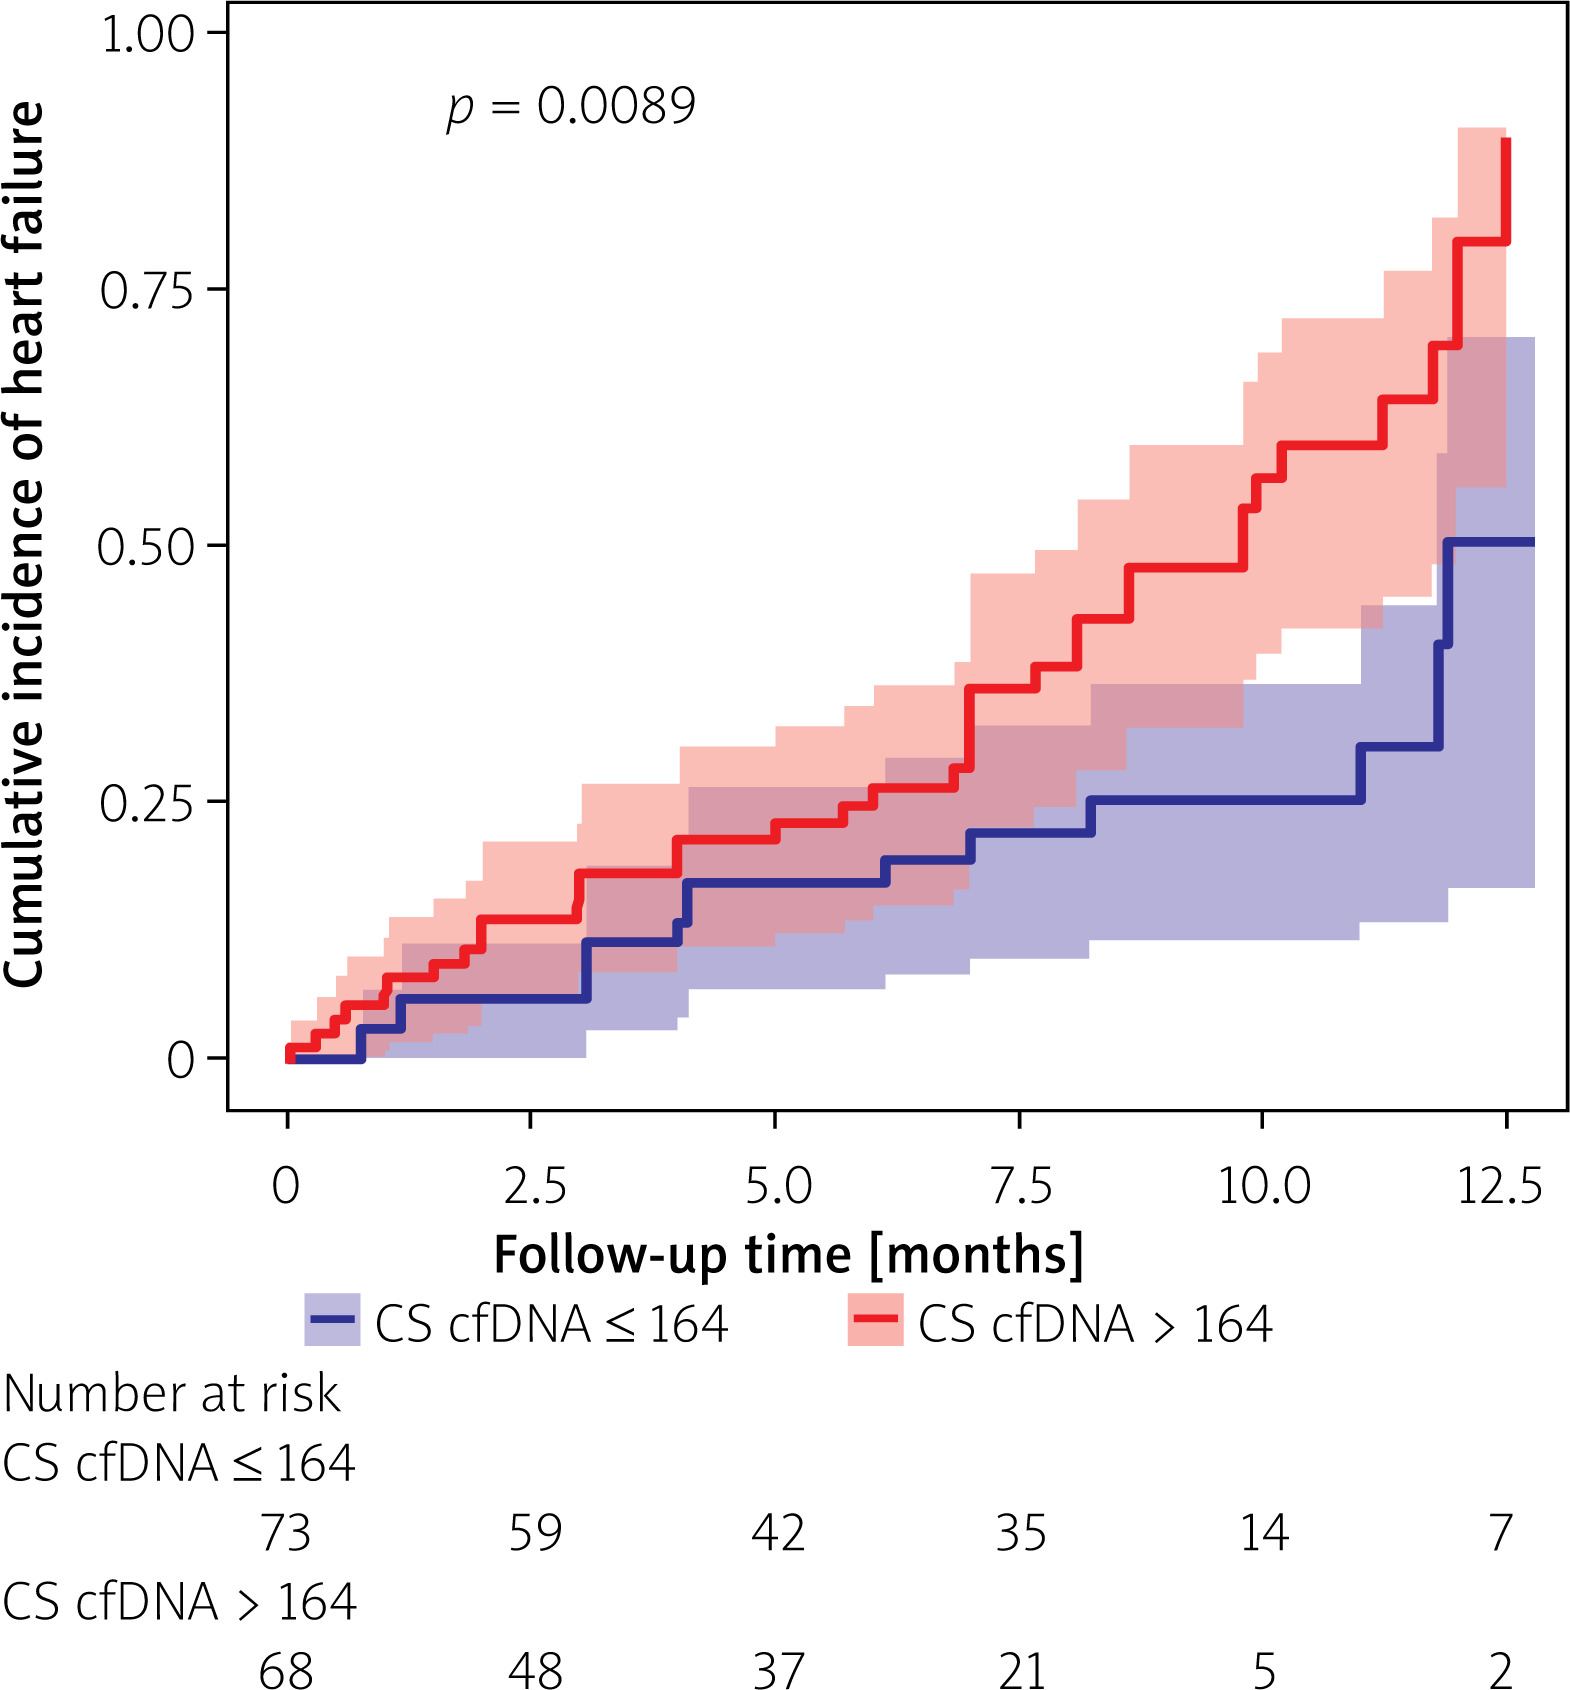
In this study, a total of 58 individuals (39.7%) suffered from HF within a median follow-up timeframe of approximately 355 days (IQR: 295–400 days). Remarkably, during the entire follow-up period, no fatalities were recorded. Kaplan-Meier analysis revealed that patients with STEMI in the high CS cfDNA group displayed a notably elevated risk of developing HF, in stark contrast to those in the low CS cfDNA group (p < 0.001) (Figure 4).
Figure 4
Kaplan-Meier analysis of HF incidence after STEMI according to the level of CS cfDNA at admission
CS cfDNA – cardiac-specific cell-free DNA, STEMI – ST elevation myocardial infarction, HF – heart failure.
Afterwards, a comprehensive ROC analysis was undertaken to evaluate the predictive capability of NT-proBNP, sST2, and CS cfDNA circulating levels at the time of admission in differentiating the incidence of HF among patients diagnosed with STEMI. CS cfDNA demonstrated the highest diagnostic performance (AUC = 0.838; 95% CI: 0.688–0.899; p < 0.001), outperforming both NT-proBNP (AUC = 0.726; 95% CI: 0.621–0.792; p = 0.001) and sST2 (AUC = 0.635; 95% CI: 0.525–0.746; p = 0.016) (Figure 5, Table II). Upon employing DeLong’s test to evaluate the AUCs, noteworthy variations emerged in the discriminatory abilities between CS cfDNA and NT-proBNP (p = 0.019), and also between CS cfDNA and sST2 (p = 0.008).
Figure 5
Receiver operating characteristic (ROC) curve analysis of circulating NT-proBNP, sST2, and unmethylated FAM101A concentrations at admission to discriminate the incidence of HF in STEMI patients. As shown in Figure 4, unmethylated FAM101A displayed the largest area under the curve (AUC = 0.838; 95% confidence interval [CI]: 0.688– 0.899; p < 0.001), followed by NT-proBNP (AUC = 0.726; 95% CI: 0.621–0.792; p = 0.001) and sST2 (AUC = 0.635; 95% CI: 0.525–0.746; p = 0.016)
AUC – area under the curve, CS cfDNA – cardiac-specific cell-free DNA, HF – heart failure, NT-proBNP – N-terminal B-type natriuretic peptide, STEMI – ST elevation myocardial infarction, sST2 – soluble suppression of tumorigenicity 2.
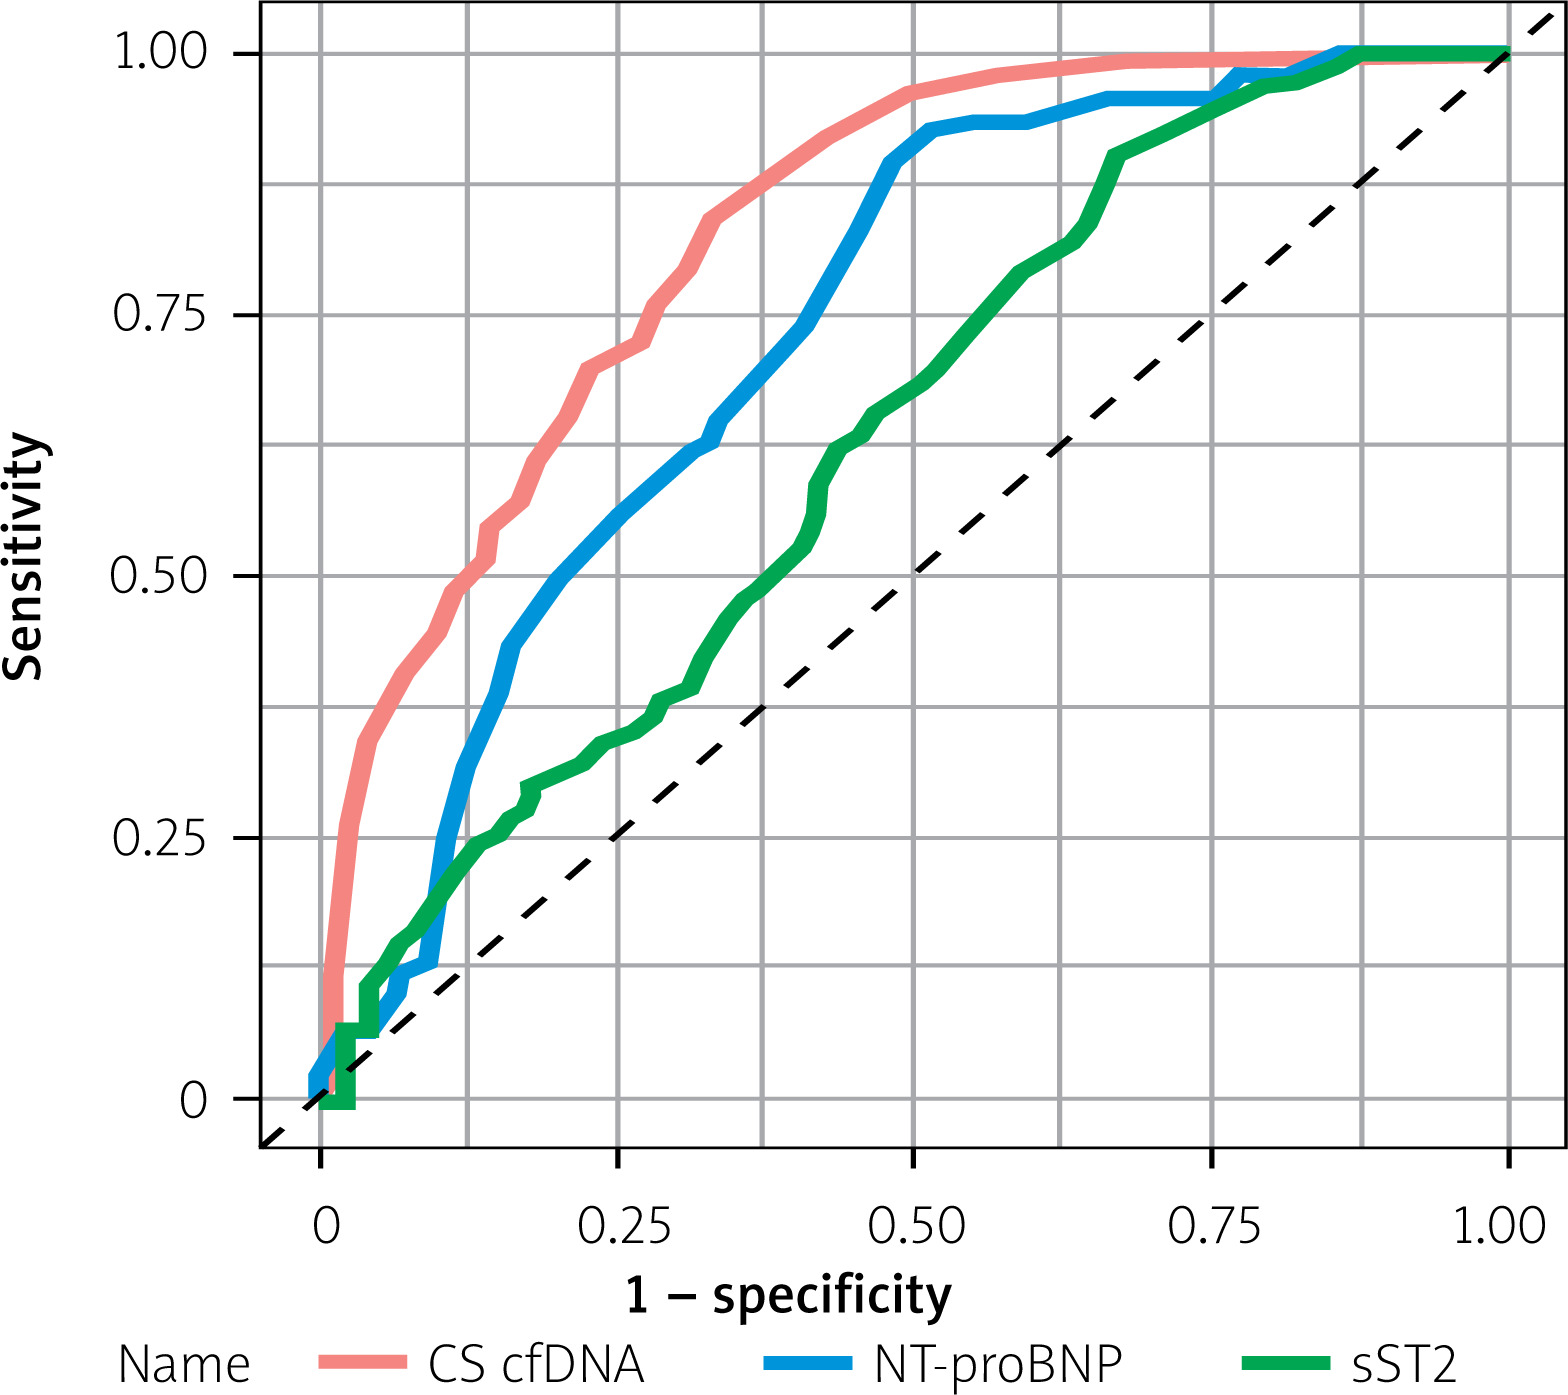
Table II
Comparison of the full diagnostic performance characteristics (sensitivity, specificity, PPV, NPV) of CS cfDNA, NT-proBNP, and sST2 at their respective optimal cutoffs for predicting heart failure
| Biomarker | Optimal cutoff value | Sensitivity (%) | Specificity (%) | PPV (%) | NPV (%) |
|---|---|---|---|---|---|
| CS cfDNA | 164 copies/ml | 85 | 82 | 83 | 88 |
| NT-proBNP | 215 pg/ml | 73 | 70 | 71 | 68 |
| sST2 | 41 ng/ml | 70 | 64 | 65 | 64 |
To accurately characterize the relationship between CS cfDNA concentrations at admission and the risk of developing HF, we employed a Cox proportional hazards model to assess the relevant risk factors predictive of HF occurrence following STEMI. In the univariate Cox regression model, both CS cfDNA and CS cfDNA > 164 copies/ml (the cutoff value for identifying HF incidence as determined by ROC curve analysis) were identified as risk factors for HF following STEMI. However, CS cfDNA > 109 copies/ml (the median value of CS cfDNA) was not a risk factor for HF after STEMI (CS cfDNA: HR = 1.011, 95% CI: 1.001–1.024, p = 0.028; CS cfDNA > 164 copies/ml: HR = 3.231, 95% CI: 1.273–8.198, p = 0.013; CS cfDNA > 109 copies/ml: HR = 1.442, 95% CI: 0.804–2.585, p = 0.22).
In both Model I and Model II, after adjustments for LDL-C, hyperlipidemia, NT-proBNP, cTnI, CK-MB, sST2, number of compromised vessels, and the Gensini score, the statistical significance of the association between CS cfDNA concentrations at admission and the prospective risk of HF after a STEMI event is upheld (CS cfDNA in Model I: HR = 1.005; 95% CI: 1.001–1.016; p = 0.034; CS cfDNA > 164 copies/ml in Model II: HR = 2.804; 95% CI: 1.086–7.243; p = 0.035) (Table III). In addition, Cox regression analysis of other independent predictors (including LDL-C, hyperlipidemia, NT-proBNP, cTnI, CK-MB, sST2, number of diseased vessels, and Gensini score) for post-STEMI HF is shown in Table IV.
Table III
Univariate and multivariate Cox regression analysis for potential predictors of 1-year heart failure after STEMI
| Variables | Univariate | Multivariate (model I) | Multivariate (model II) | |||
|---|---|---|---|---|---|---|
| HR (95% CI) | P-value | HR (95% CI) | P-value | HR (95% CI) | P-value | |
| CS cfDNA | 1.011 (1.001–1.024) | 0.028 | 1.005 (1.001–1.016) | 0.034 | ||
| CS cfDNA > 164 copies/mla, yes | 3.231 (1.273–8.198) | 0.013 | 2.804 (1.086–7.243) | 0.035 | ||
| CS cfDNA > 109 copies/mlb, yes | 1.442 (0.804–2.585) | 0.218 | ||||
a The cutoff value of CS cfDNA at admission to identify HF incidence determined by ROC curve analysis. The reference was CS cfDNA < 164copies/ml.
b The median value of CS cfDNA. The reference was CS cfDNA<109 copies/ml. Model I and Model II: adjusted for LDL-C, hyperlipidemia, NT-proBNP, cTnI, CK-MB, sST2, numbers of affected vessels, and Gensini score. CI – confidential interval, CS cfDNA – cardiac-specific cell-free DNA, CK-MB – creatine kinase-MB, cTnI – cardiac troponin I, HR – hazard ratio, LDL-C – low-density lipoprotein cholesterol, NT-proBNP – N-terminal pro-B-type natriuretic peptide, sST2 – soluble suppression of tumorigenicity 2, STEMI – ST elevation myocardial infarction, ROC – receiver operating characteristic curve.
Table IV
Multivariate Cox regression analysis for potential predictors of post-STEMI HF
[i] Bolded values indicate p-values < 0.05. CI – confidential interval, CS cfDNA – cardiac-specific cell-free DNA, CK-MB – creatine kinase-MB, cTnI – cardiac troponin I, HR – hazard ratio, LDL-C – low-density lipoprotein cholesterol, NT-proBNP – N-terminal pro-B-type natriuretic peptide, sST2 – soluble suppression of tumorigenicity 2, STEMI – ST elevation myocardial infarction.
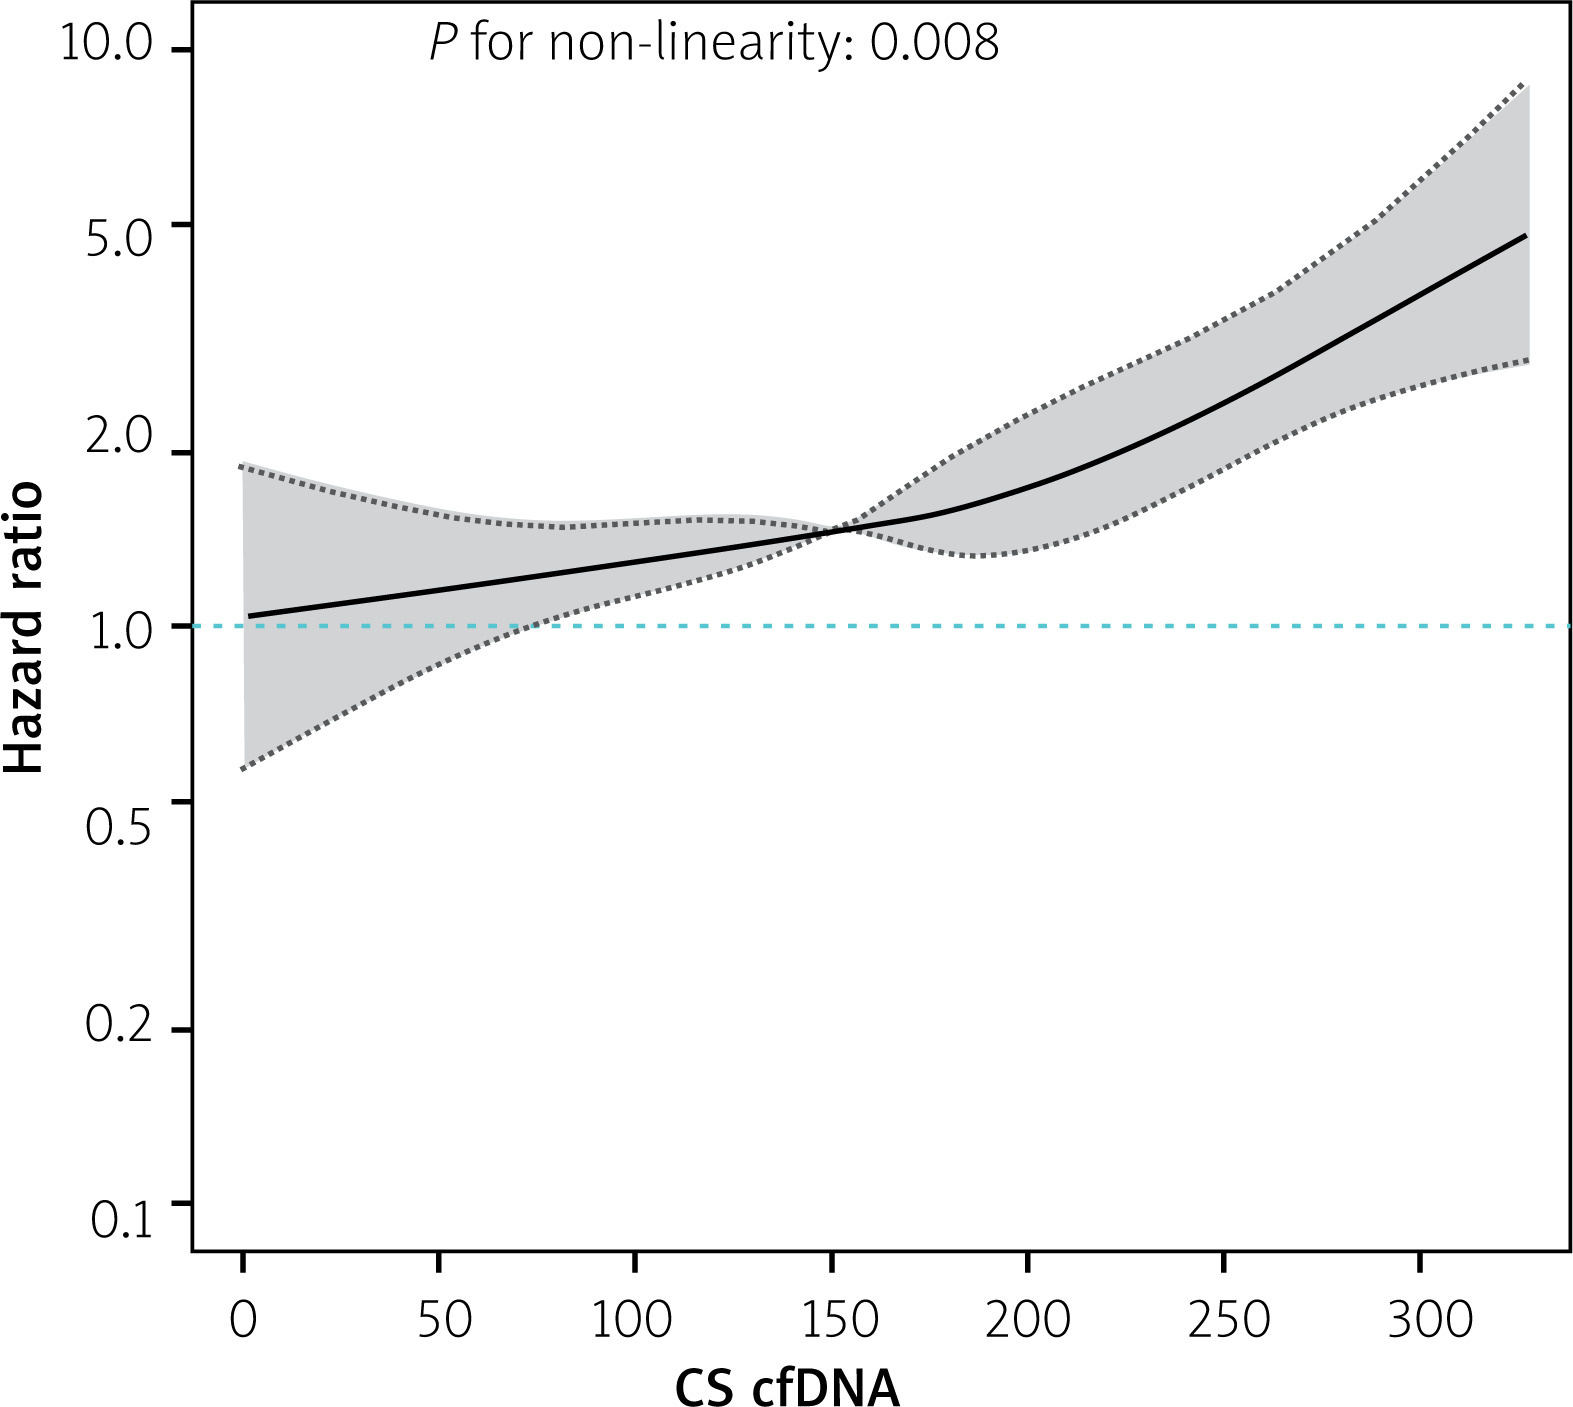
Moreover, we applied RCS analysis to graphically represent the relationship between CS cfDNA levels and the hazard ratio (HR) for the development of HF following a STEMI event. The illustrated RCS curve stems from Cox regression Model I, maintaining the integrity of its predictive outcomes. Our findings emphasize a clear and direct correlation between elevated levels of CS cfDNA and elevated risk for the development of HF (p for linear trend = 0.008, Figure 6). The increase in risk of HF incidence was accompanied by a corresponding increase in the CS cfDNA level.
Figure 6
Restricted cubic spline analysis showing the association between plasma CS cfDNA level at admission and the risk of HF after STEMI. A restricted cubic spline curve based on Cox regression model I: the Cox regression was adjusted for LDL-C, hyperlipidemia, NT-proBNP, cTnI, CK-MB, sST2, number of affected vessels, and Gensini score
CS cfDNA – cardiac-specific cell-free DNA, CK-MB – creatine kinase-MB, cTnI – cardiac troponin I, LDL-C – low-density lipoprotein cholesterol, NT-proBNP – N-terminal pro-B-type natriuretic peptide, sST2 – soluble suppression of tumorigenicity 2, STEMI – ST-elevation myocardial infarction, HF – heart failure.
Correlation between CS cfDNA and HF after adjusting for cardiovascular risk factors
A linear regression analysis was conducted between CS cfDNA levels and LVEF to investigate whether CS cfDNA levels can predict HF risk independently of cardiac function indicators. The results showed a negative correlation between CS cfDNA and LVEF (β = –0.12, p = 0.003) (Table V), suggesting an association with decreased cardiac function. Furthermore, after adjusting for traditional cardiovascular risk factors, CS cfDNA still significantly predicts HF (Model I, HR = 2.80, p = 0.030) (Table VI). After further adjusting for LVEF, the HR of CS cfDNA slightly decreased but remained significant (Model II, HR = 2.50, p = 0.045), indicating that its predictive value is independent of cardiac systolic function and is associated with the direct mechanism of myocardial cell death.
Table V
Linear regression analysis of CS cfDNA levels and LVEF
Discussion
The main findings of this study are as follows: 1) In patients with STEMI, there was a significant positive correlation between CS cfDNA levels and the risk of HF. High levels of CS cfDNA were found to significantly increase the risk of post-STEMI HF. 2) CS cfDNA performs excellently in predicting post-STEMI HF; its predictive efficacy is superior to that of traditional biomarkers (NT-proBNP and sST2), and it is an independent predictor of post-STEMI HF. 3) CS cfDNA levels are significantly correlated with myocardial injury biomarkers (such as cTnI and CK-MB) and myocardial fibrosis biomarker (sST2), suggesting that CS cfDNA may reflect the processes of myocardial cell death and fibrosis.
In our investigation, a cumulative total of 58 patients, accounting for 39.7% of the cohort, experienced HF during a median follow-up duration of roughly 355 days. Prior studies have illuminated considerable disparities in the prevalence of HF among hospitalized patients with AMI, with peak rates reaching 50% [16]. Notably, despite advancements in revascularization techniques, the overall incidence of HF following AMI continues to vary within a range of 14% to 40%, emphasizing myocardial infarction as a pivotal factor contributing to heart failure [17]. These observations are congruent with the outcomes of our research.
Furthermore, our analysis revealed a markedly higher risk of HF occurrence among patients diagnosed with STEMI and elevated levels of CS cfDNA compared to those with lower concentrations. This pivotal finding underscores the paramount importance of CS cfDNA as a predictive factor for assessing the risk of HF after STEMI. ROC analysis demonstrated that CS cfDNA has strong diagnostic accuracy and sensitivity in predicting HF following STEMI, and may serve as a potential alternative to conventional biomarkers such as NT-proBNP and sST2 in the future. However, research on CS cfDNA is still in its preliminary stage and requires further studies for validation.
This research revealed that in individuals with STEMI, elevated CS cfDNA levels were not significantly correlated with indicators of liver damage (aspartate aminotransferase, alanine aminotransferase) and renal function assessment (estimated glomerular filtration rate), which is consistent with previous studies [18, 19]. Meanwhile, STEMI patients exhibiting elevated CS cfDNA levels display a marked increase in cardiac injury markers, including CK-MB, aligning with previous research [18, 20–22]. Notably, a positive association was found between the rise in cfDNA and elevated plasma sST2 concentration, with sST2 being recognized as a pivotal biomarker for myocardial fibrosis. This observation indicates that cfDNA originating from injured myocardial tissue may potentially play a role in cardiac remodeling, potentially accelerating the development of HF [23].
This study found a significant positive correlation between CS cfDNA and cTnI (R = 0.885), suggesting that both can effectively reflect the degree of myocardial injury. Despite this significant correlation, CS cfDNA still has irreplaceable unique advantages in clinical application. First, cTnI starts to increase 4–6 h after myocardial injury and has a relatively long half-life (approximately 2 days), making it difficult to reflect early-stage dynamic changes or those after treatment [20]. In contrast, CS cfDNA, with its short half-life (approximately 15–30 min), can more sensitively detect acute injuries (such as reperfusion after PCI) or progression of chronic injuries, providing a timely basis for treatment adjustments [18]. Furthermore, although cTnI is considered the gold standard for myocardial injury, it may produce false positives in non-myocardial diseases such as renal failure, skeletal muscle injury, or stroke [21]. By targeting a myocardium-specific gene (FAM101A), CS cfDNA can distinguish injuries of myocardial origin. Especially in cases of multiple organ dysfunction or complex clinical scenarios, it significantly improves diagnostic accuracy [19]. A single cTnI test has limited ability to predict long-term events, whereas longitudinal monitoring of CS cfDNA can identify subclinical myocardial injury (with cTnI within normal range). This provides individualized risk thresholds for heart failure prediction and management, optimizing long-term prognosis. Therefore, the strong correlation between CS cfDNA and cTnI indicates that both reflect a common pathological process of myocardial injury, but CS cfDNA provides more information through the aforementioned advantages. In future studies, exploration can be conducted on multimodal biomarker combinations (e.g., CS cfDNA + cTnI + echocardiography) to construct a more comprehensive prediction system for post-myocardial infarction heart failure and promote the development of precision medicine.
This study conclusively demonstrated that CS cfDNA levels independently predict the onset of HF following STEMI. Despite adjusting for a comprehensive array of potential confounding factors, such as LDL-C, dyslipidemia, NT-proBNP, cTnI, CK-MB, sST2, number of affected vessels, and Gensini score, this association remained statistically significant. Using the RCS analysis approach, we have strengthened the understanding of the linear correlation between CS cfDNA levels and HF risk, demonstrating that higher CS cfDNA levels are associated with increased risk of HF occurrence. This finding underscores the potential of elevated CS cfDNA levels as a biomarker mirroring myocardial cell damage and death in the context of heart failure, which is closely linked to the underlying pathophysiological mechanisms of the disease [19].
At present, a standardized criterion for determining the cutoff points of CS cfDNA remains elusive. This study conducted a comparative analysis of the ROC optimal cutoff method and the median method in establishing these thresholds. Like the ROC optimal cutoff method, the median method demonstrated significant differences between the two groups in terms of NT-proBNP and sST2 comparison. Nevertheless, it is crucial to observe that while the median method exhibited promising results in the initial comparison, it failed to demonstrate the predictive significance of CS cfDNA for specific outcomes (e.g., HF in STEMI patients) during subsequent Cox multivariate analysis. This observation underscores the potential suitability of cutoff values derived from the ROC optimal cutoff method for predicting HF in STEMI patients with CS cfDNA.
As a potent prognostic marker for HF, elevated NT-proBNP levels may reflect myocardial stretch or hemodynamic stress. Release of CS cfDNA, on the other hand, is directly associated with myocardial cell apoptosis/necrosis. Since both share partial pathophysiological mechanisms (e.g., ischemic injury), a baseline difference is biologically plausible [18, 19]. Although baseline NT-proBNP level was higher in high CS cfDNA group, multivariate Cox regression analysis showed that CS cfDNA remained an independent predictor of HF, indicating that its prognostic value is independent of NT-proBNP. Furthermore, in patients with comorbid chronic kidney disease, NT-proBNP may be falsely elevated due to excretion impairment. In contrast, CS cfDNA-targeting the myocardium-specific FAM101A gene is not affected by this issue, thereby providing more reliable prognostic information. The ROC analysis results of this study demonstrated that the AUC of CS cfDNA for predicting HF was significantly higher than that of NT-proBNP, suggesting its superior diagnostic accuracy.
Although the 164 copies/ml cut-off value used in this study was derived from the same cohort, we enhanced its credibility through two approaches. First, we quantified the range of overfitting bias using the bootstrap method (adjusted sensitivity: 85–90%, adjusted specificity: 80–86%). In the original cohort, sensitivity corresponding to 164 copies/ml cut-off was 92%. After bootstrap adjustment, mean sensitivity was 87.5% (95% CI: 82.0–91.0%), with an overfitting bias ranging from –4.5% to –-0.5%. These results indicate that risk of performance overestimation is low and within a clinically acceptable range. Second, we completed time-series validation and subgroup sensitivity analysis using the existing data: 1) Based on enrollment time of cases, 146 samples were divided into a training set (first 70% of enrollment period, n = 102) and a validation set (last 30% of enrollment period, n = 44) at a ratio of 7 : 3. In the validation set, the sensitivity of 164 copies/ml cut-off was 86% (95% CI: 78–92%), specificity was 82% (95% CI: 70–90%), and AUC was 0.852. Compared with AUC of 0.857 in the training set, only minimal performance attenuation was observed. This demonstrates robustness of the cut-off value over time and visually confirms that the risk of overfitting is controllable. 2) Subgroups were divided according to key clinical variables: age < 59 years vs. age ≥ 59 years; male vs. female; time from door to wire (D to W) < 74.5 min vs. time from door to wire (D to W) ≥ 74.5 min. We found that within each subgroup, the sensitivity of 164 copies/ml cut-off ranged from 84% to 89%, and specificity ranged from 80% to 85%. No statistically significant differences were observed between subgroups (p = 0.32 for sensitivity, p = 0.28 for specificity), confirming that the cut-off value performs stably in populations with different clinical characteristics. In future studies, we plan to include independent validation data and improve the validation methodology in strict accordance with the STARD guidelines to ensure robustness and generalizability of the study conclusions.
Although this study confirms the prognostic value of CS cfDNA in predicting HF risk after STEMI, translating this biomarker into routine clinical practice still requires addressing several practical challenges. First, quantitative analysis of CS cfDNA via digital polymerase chain reaction (dPCR) and the bisulfite conversion method requires specialized reagents and consumables, and the detection cost per sample is much higher than that of conventional biomarkers such as NT-proBNP. Potential solutions include developing multiplex detection assays (e.g., simultaneously detecting CS cfDNA and other cardiac biomarkers on a single platform) and adopting automated extraction systems to reduce labor costs. Second, the entire process, including sample collection, plasma separation, cfDNA extraction, bisulfite treatment, and dPCR analysis, has a total turnaround time (TAT) of approximately 10 to 12 h under optimal conditions. For STEMI patients requiring rapid risk stratification, this TAT may be impractical. Emerging technologies (such as microfluidic-based dPCR systems) are expected to reduce the TAT to less than 4 h, which aligns with the time-sensitive needs of acute coronary syndromes. Furthermore, not all clinical laboratories are routinely equipped with dPCR platforms (which are relatively expensive and cannot be widely adopted) and bisulfite conversion kits (technical staff also require specialized technical training and support from dedicated certification programs to operate these tools).
Undoubtedly, it is crucial to recognize the limitations of this study. First, the single-center approach and limited sample size might potentially limit the wider applicability of the results. Therefore, larger, multicentric studies are needed to reinforce and broaden our knowledge base. Second, the precise biological roles of CS cfDNA and its involvement in the pathological cascades of STEMI and HF remain enigmatic, highlighting the need for further foundational research. Third, this study did not generate a ROC curve for cTnI or correlation plot between NT-proBNP and CS cfDNA. A ROC curve of cTnI may help evaluate the value of cTnI in predicting post-STEMI HF risk, and correlation analysis between NT-proBNP and CS cfDNA may provide additional information. Fourth, another limitation of this study is that it did not use an independent validation cohort to confirm whether CS cfDNA is a biomarker for predicting the occurrence of heart failure after STEMI.
Conclusions
A significant positive correlation was observed between CS cfDNA levels and cardiac injury biomarkers, particularly cTnI and sST2. CS cfDNA may be a promising independent biomarker for predicting the occurrence of HF after STEMI. These findings could inform new strategies for clinical management and prognostic assessment of patients with STEMI.


