
Introduction
Alcohol-related liver disease (ARLD) refers to liver damage caused by excessive alcohol intake, i.e., consuming five or more drinks on occasion for men and four or more for women (https://www.cdc.gov/chronicdisease/resources/publications/factsheets/alcohol.htm). The duration of excessive alcohol consumption that results in ARLD is highly variable [1, 2]. However, a typical male patient with ARLD consumes an average of 80 g of ethanol daily for more than 5 years [3].
The most widely recognized forms of alcoholic liver disease are alcoholic fatty liver (steatosis), acute alcoholic hepatitis (AAH), and alcoholic cirrhosis (AC). The reference ranges for alanine transaminase (ALT) and aspartate transferase (AST) in AAH are 100-200 U/l and 50-150 U/l, respectively [4], whereas AC is defined by an AST/ALT ratio > 2 [5]. Blood tests in male patients with AAH can show an increase in AST levels. However, ALT levels are usually in the normal range. There are also several clinical presentations of AAH, such as jaundice, anorexia, and fever [6]. The volume of the liver can also increase as a result of the ballooning of hepatocytes caused by an increased accumulation of intracellular water.
Cirrhosis is the late stage of alcoholic liver injury defined by a distorted hepatic structure. In the late stages, it is considered irreversible. The characteristics of cirrhosis are spider angioma [7], palmar erythema, ascites, and variceal bleeding [8].
ARLD influences serum levels of vitamins and apoptotic cytokines. For example, there is a correlation between serum vitamin D levels as a function of liver disease [9–12]. However, the exact role of vitamin D in alcoholic liver disease is not well established. Most studies have focused on vitamin D deficiency in liver cirrhosis [13], and only a few have reported vitamin D levels in other stages of alcoholic liver damage [14]. The altered vitamin D metabolism observed in liver cirrhosis is mainly attributed to impaired hydroxylation of 25 (OH) vitamin D due to impaired liver function [15]. Some studies have also reported the prevalence of hypovitaminosis D in chronic liver disease and cirrhosis [16].
From a molecular point of view, reduced levels of 25(OH)D3 result in insufficient production of the active hormone 1,25-dihydroxyvitamin D3 [1,25(OH)2D3], which interacts with the vitamin D receptor (VDR), a nuclear receptor expressed in multiple tissues including hepatocytes, immune cells, and hepatic stellate cells [17]. VDR signaling usually suppresses fibrogenic and inflammatory pathways by inhibiting nuclear factor-kappa B (NF-κB) and transforming growth factor β (TGF-β) signaling while also promoting anti-inflammatory cytokines such as interleukin (IL)-10 [18, 19]. In the setting of cirrhosis, vitamin D deficiency leads to impaired VDR activation, resulting in upregulated hepatic inflammation and fibrosis through increased expression of pro-inflammatory cytokines (e.g., IL-6, TNF-α) and fibrogenic mediators (e.g., collagen I, α-smooth muscle actin) [20, 21].
An increase in tumor necrosis factor α (TNF-α) levels was also observed as a function of ARLD in animal models [20–22] and human models [22]. Furthermore, TNF-α levels have been shown to reflect liver injury despite normal levels of liver enzymes [23]. ARLD is also defined by elevated serum levels of pro-inflammatory IL-1, IL-6, and IL-8 whose expression is tightly controlled by IL-1 and TNF-α [24]. Serum levels of IL-12 have also been reported to be a function of alcoholic liver disease [25], and serum adiponectin levels are reduced after alcohol consumption. All the described changes share a common mechanism. It should be emphasized that at the molecular level, adiponectin exerts anti-fibrotic, anti-inflammatory, and insulin-sensitizing effects by activating AMP-activated protein kinase (AMPK) and peroxisome proliferator-activated receptor α (PPAR-α) signaling pathways. These pathways inhibit hepatic stellate cell activation, reduce oxidative stress, and suppress NF-κB-mediated inflammatory responses [26]. In cirrhosis, however, chronic oxidative stress, lipotoxicity, and cytokine dysregulation impair the expression and functionality of AdipoR1/2, potentially diminishing the biological efficacy of adiponectin despite its elevated levels [27]. Additionally, hepatic insulin resistance and mitochondrial dysfunction further attenuate adiponectin signaling, contributing to persistent inflammation and fibrosis [28].
The key objective of this study was to address the lack of information on the differences between acute alcoholic hepatitis (AAH) and alcoholic cirrhosis (AC) through the differential analysis of serum levels of vitamin D3, TNF-α, IL-1β, IL-6, IL-8, IL-12, and adiponectin.
Material and methods
The study was conducted according to the Declaration of Helsinki of the World Medical Association (WMA) (World Medical, 2001).
Institutional Ethics Clearance (IEC) KB/18/2022, granted by the Regional Ethics Committee of the Gdansk Medical Chamber in Gdansk, Poland, was obtained for this study. Each male patient provided a signed informed consent form.
The study consisted of two groups of men, stratified according to the level of alcohol-related liver disease diagnosed by complete blood count, analysis of the liver panel (transaminases, bilirubin, alkaline phosphatase, albumin), and gamma-glutamyl transferase, and ultrasound examination that included liver size, bluntness of the liver edge, coarseness of the liver parenchyma, and nodularity of the liver surface.
The data used in this study included blood tests of male patients admitted to Bródnowski Hospital in Warsaw, Poland, between March and May 2022. Furthermore, the personal records of the male patients are archived in the hospital. The acute alcoholic hepatitis (AAH) group consisted of N = 42 subjects (age = 51.48 ±10.33 years), and the compensated alcohol cirrhosis group (AC) consisted of N = 50 subjects (age = 53.32 ±8.03 years). For all the subjects, the mean body mass index (BMI) was 20, with a standard deviation of 1.23. For all the subjects, it was the first incidence of medical diagnosis of ARLD. The diagnosis was made by combining laboratory tests, i.e., analysis of levels of the liver enzymes AST and ALT, their ratio, and levels of γ-glutamyl transferase (GGT). Laboratory tests were supported by liver biopsy and ultrasound (US) or CT/MRI scans. Patients with ARLD comorbidities, such as pancreatitis and type 2 diabetes, were excluded from the study. The flow chart of sample selection is shown in Figure 1. An outline of the patients’ treatment course is shown in Table 1.
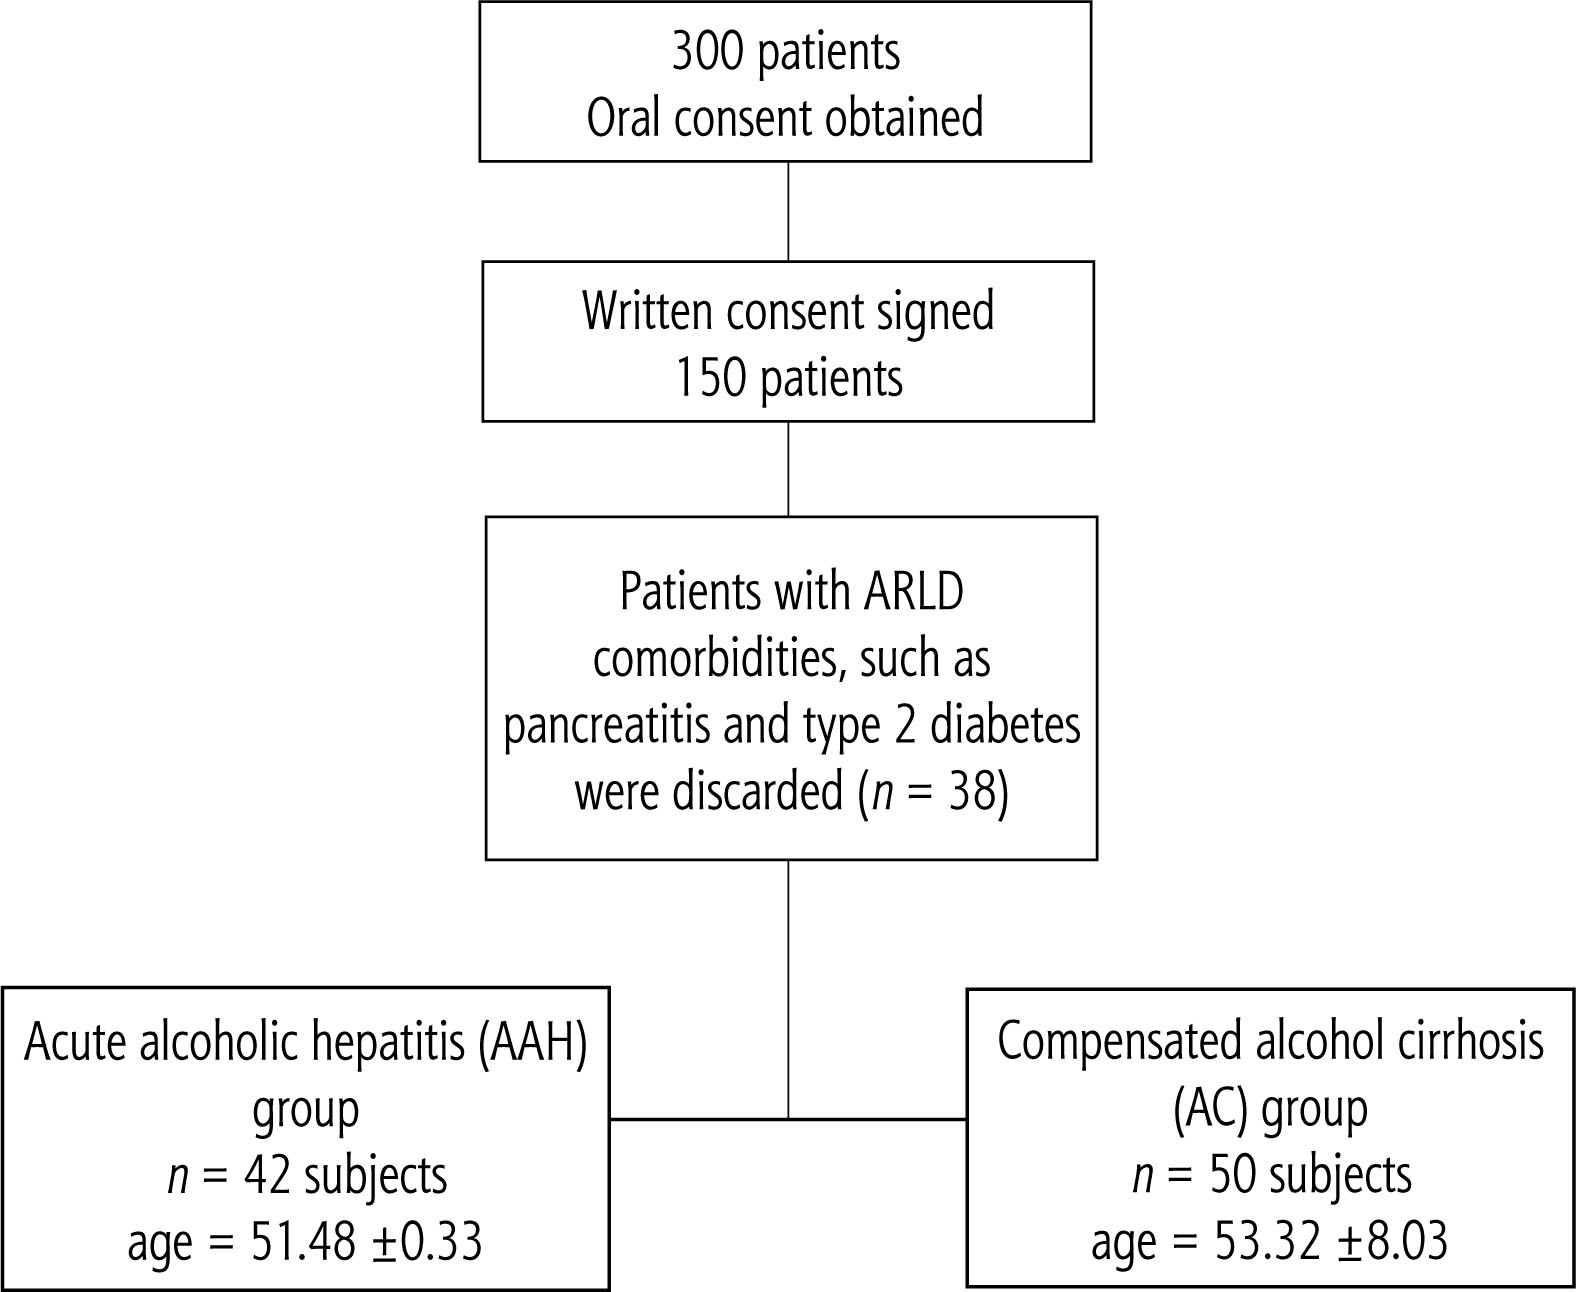
Table 1
Selected pharmacologic management in chronic liver disease and cirrhosis
Blood samples obtained from each male patient were allowed to clot at room temperature for 30 minutes and centrifuged for 10 minutes at 3000 rpm. The serum samples were then separated and measured immediately after centrifugation to avoid cytokine production of cytokines by blood cells. Serum cytokine levels were evaluated using Luminex xMap technology. In summary, beads were incubated with a sample, washed, and incubated with a mixture of biotinylated antibodies against all the targets studied. A wash and incubation step with the reporter streptavidin-PE followed this step. The required reagents are provided in Luminex Sheath Fluid kits (EMD Millipore Catalog #SHEATHFLUID) or Luminex Drive Fluid kits (EMD Millipore Catalog # MPXDF-4PK). The concentration of a specific cytokine was assessed as a sandwich composed of a bead with attached cytokine-specific antibody + cytokine + biotinylated cytokine-specific antibody + streptavidin reporter. The beads were excited by a laser to determine the bead region and the corresponding assigned analyte. Another laser was used to determine the magnitude of the PE-derived signal, which is proportional to the amount of analyte bound. The experimental procedures followed the HPTP1-MAG-66K instructions from EMD Millipore.
The ARCHITECT platform was used to assess serum 25-OH vitamin D levels using chemiluminescent immunoassay technology. The assay is a 1-step delayed chemiluminescent microparticle immunoassay (CMIA) with an automated online pretreatment step designed to allow vitamin D assays in the routine laboratory testing workflow [29].
All statistical calculations were performed using the R programming environment. The normality of the sample distribution was verified using the Shapiro-Wilk test. Hypothesis testing was performed at a significance level of 0.05. The distribution of means and differences in means between the samples were tested using a bootstrap test consisting of 10,000 repeats with replacement [30]. Correlations between samples were analyzed using the Spearman correlation procedure [31].
Results
The differences between the cohort parameters collected in Poland studied stratified by medical condition are collected in Table 2. The respective graphical representations are shown in Figure 2A-G.
Table 2
Bootstrap mean and 95% confidence intervals for vitamin D3, TNF-α, IL-1β, IL-6, IL-8, IL-12, and adiponectin stratified by alcoholic-related liver disease that is acute alcoholic hepatitis (AAH) (n = 42) and alcohol cirrhosis (AC) (n = 50). Statistically significant differences at p < 0.05 between the markers are denoted by X
Fig. 2
Density plots of studied parameters: A) Density plots of distributions of vitamin D3 levels stratified by alcohol-related liver disease: compensated alcohol cirrhosis (AC) and acute alcohol hepatitis (AAH). Inset: bootstrapped difference in means between the sample. Red dotted lines – 95% confidence interval, blue dotted line – zero. Statistically significant difference corresponds to zero beyond the area encompassed by red dotted lines. Normal range is given after [34]. B) Density plots of distributions of TNF-α levels stratified by alcohol-related liver disease: compensated AC and AAH. Inset: bootstrapped difference in means between the sample. Red dotted lines – 95% confidence interval, blue dotted line – zero. Statistically significant difference corresponds to zero beyond the area encompassed by red dotted lines. Normal range is given after [32]. C) Density plots of distributions of IL-1β levels stratified by alcohol-related liver disease: compensated AC and AAH. Inset: bootstrapped difference in means between the sample. Red dotted lines – 95% confidence interval, blue dotted line – zero. Statistically significant difference corresponds to zero beyond the area encompassed by red dotted lines. Normal range is given after [35]. D) Density plots of distributions of IL-6 levels stratified by alcohol-related liver disease: compensated AC and AAH. Inset: bootstrapped difference in means between the sample. Red dotted lines – 95% confidence interval, blue dotted line – zero. Statistically significant difference corresponds to zero beyond the area encompassed by red dotted lines. Normal range is given after [36]. E) Density plots of distributions of IL-8 levels stratified by alcohol-related liver disease: compensated AC and AAH. Inset: bootstrapped difference in means between the sample. Red dotted lines – 95% confidence interval, blue dotted line – zero. Statistically significant difference corresponds to zero beyond the area encompassed by red dotted lines. Normal range is given after [33]. F) Density plots of distributions of IL-12 levels stratified by alcohol-related liver disease: compensated AC and AAH. Inset: bootstrapped difference in means between the sample. Red dotted lines – 95% confidence interval, blue dotted line – zero. Statistically significant difference corresponds to zero beyond the area encompassed by red dotted lines. Normal range is given after [37]. G) Density plots of distributions of adiponectin levels stratified by alcohol-related liver disease: compensated AC and AAH. Inset: bootstrapped difference in means between the sample. Red dotted lines – 95% confidence interval, blue dotted line – zero. Statistically significant difference corresponds to zero beyond the area encompassed by red dotted lines. Normal range is given after [38]
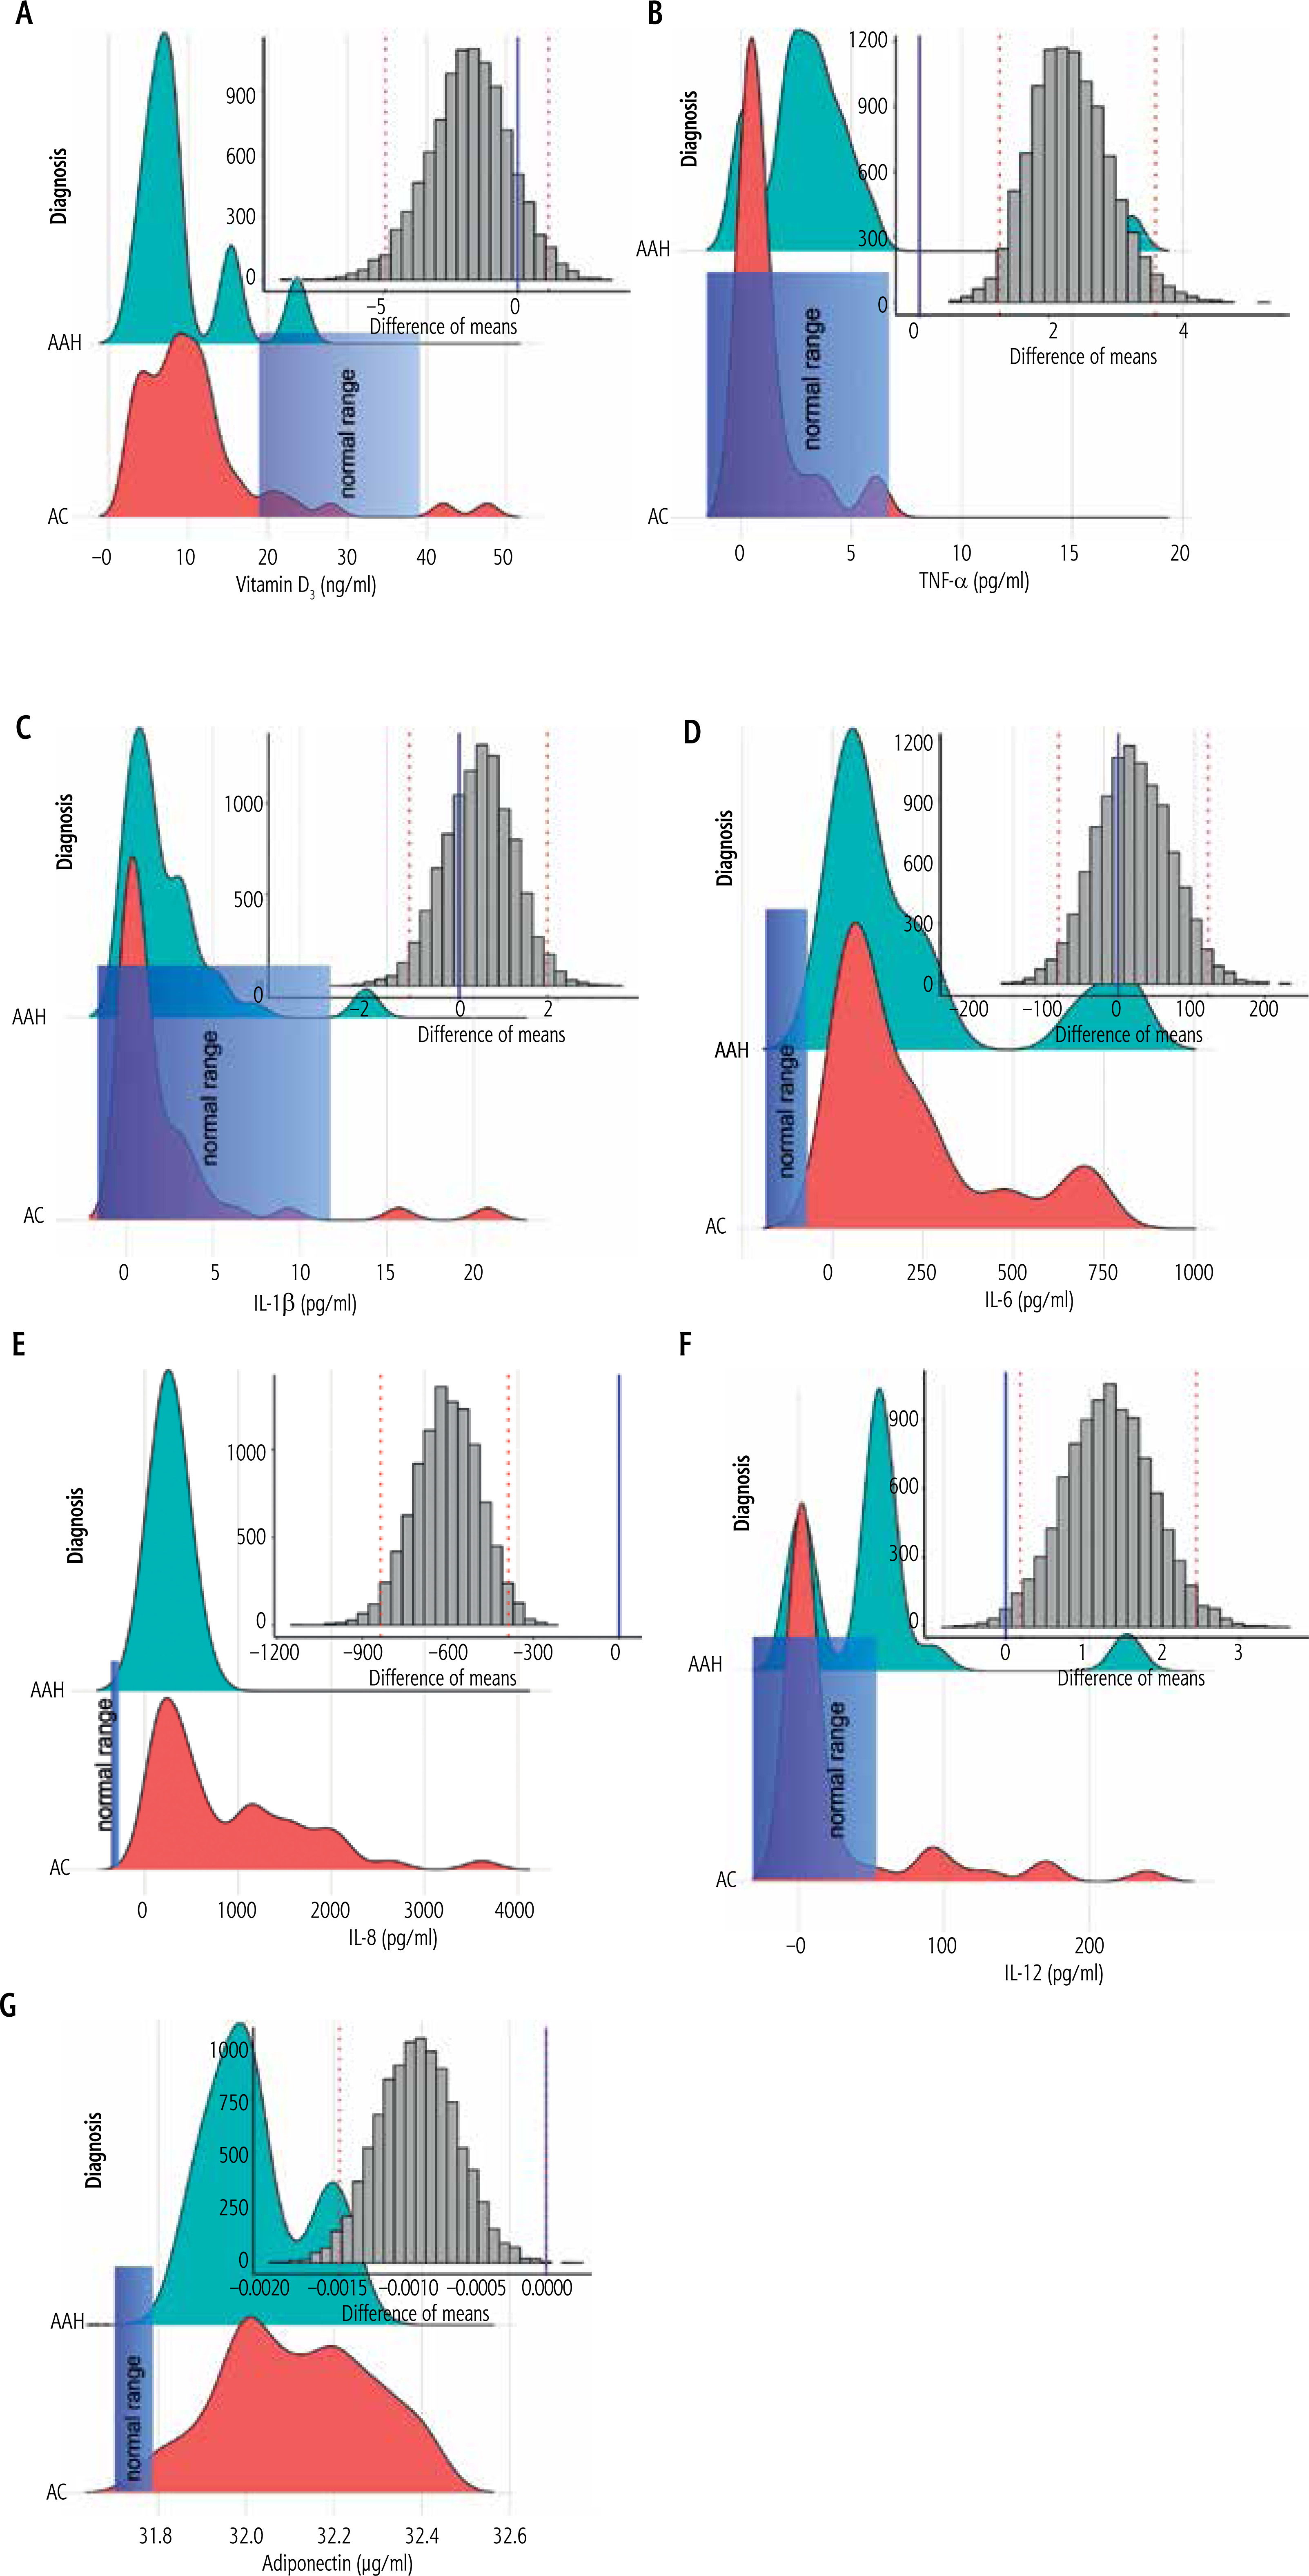
Analysis of the results obtained revealed nonsignificantly lower serum vitamin D3 levels (Table 2, Fig. 2A) and nonsignificantly higher IL-1β levels (Table 2, Fig. 2C) and IL-6 levels (Table 2, Fig. 2D) in sub-jects with AAH compared to AC. Serum adiponectin levels (Table 2, Fig. 2G) were similar between study groups. There was also a statistically significantly higher TNF-α level (Table 2, Fig. 2B), a statistically significantly lower IL-8 level (Table 2, Fig. 2E), and a statistically significantly higher IL-12p70 level (Table 2, Fig. 2F) in male patients with AAH compared to AC.
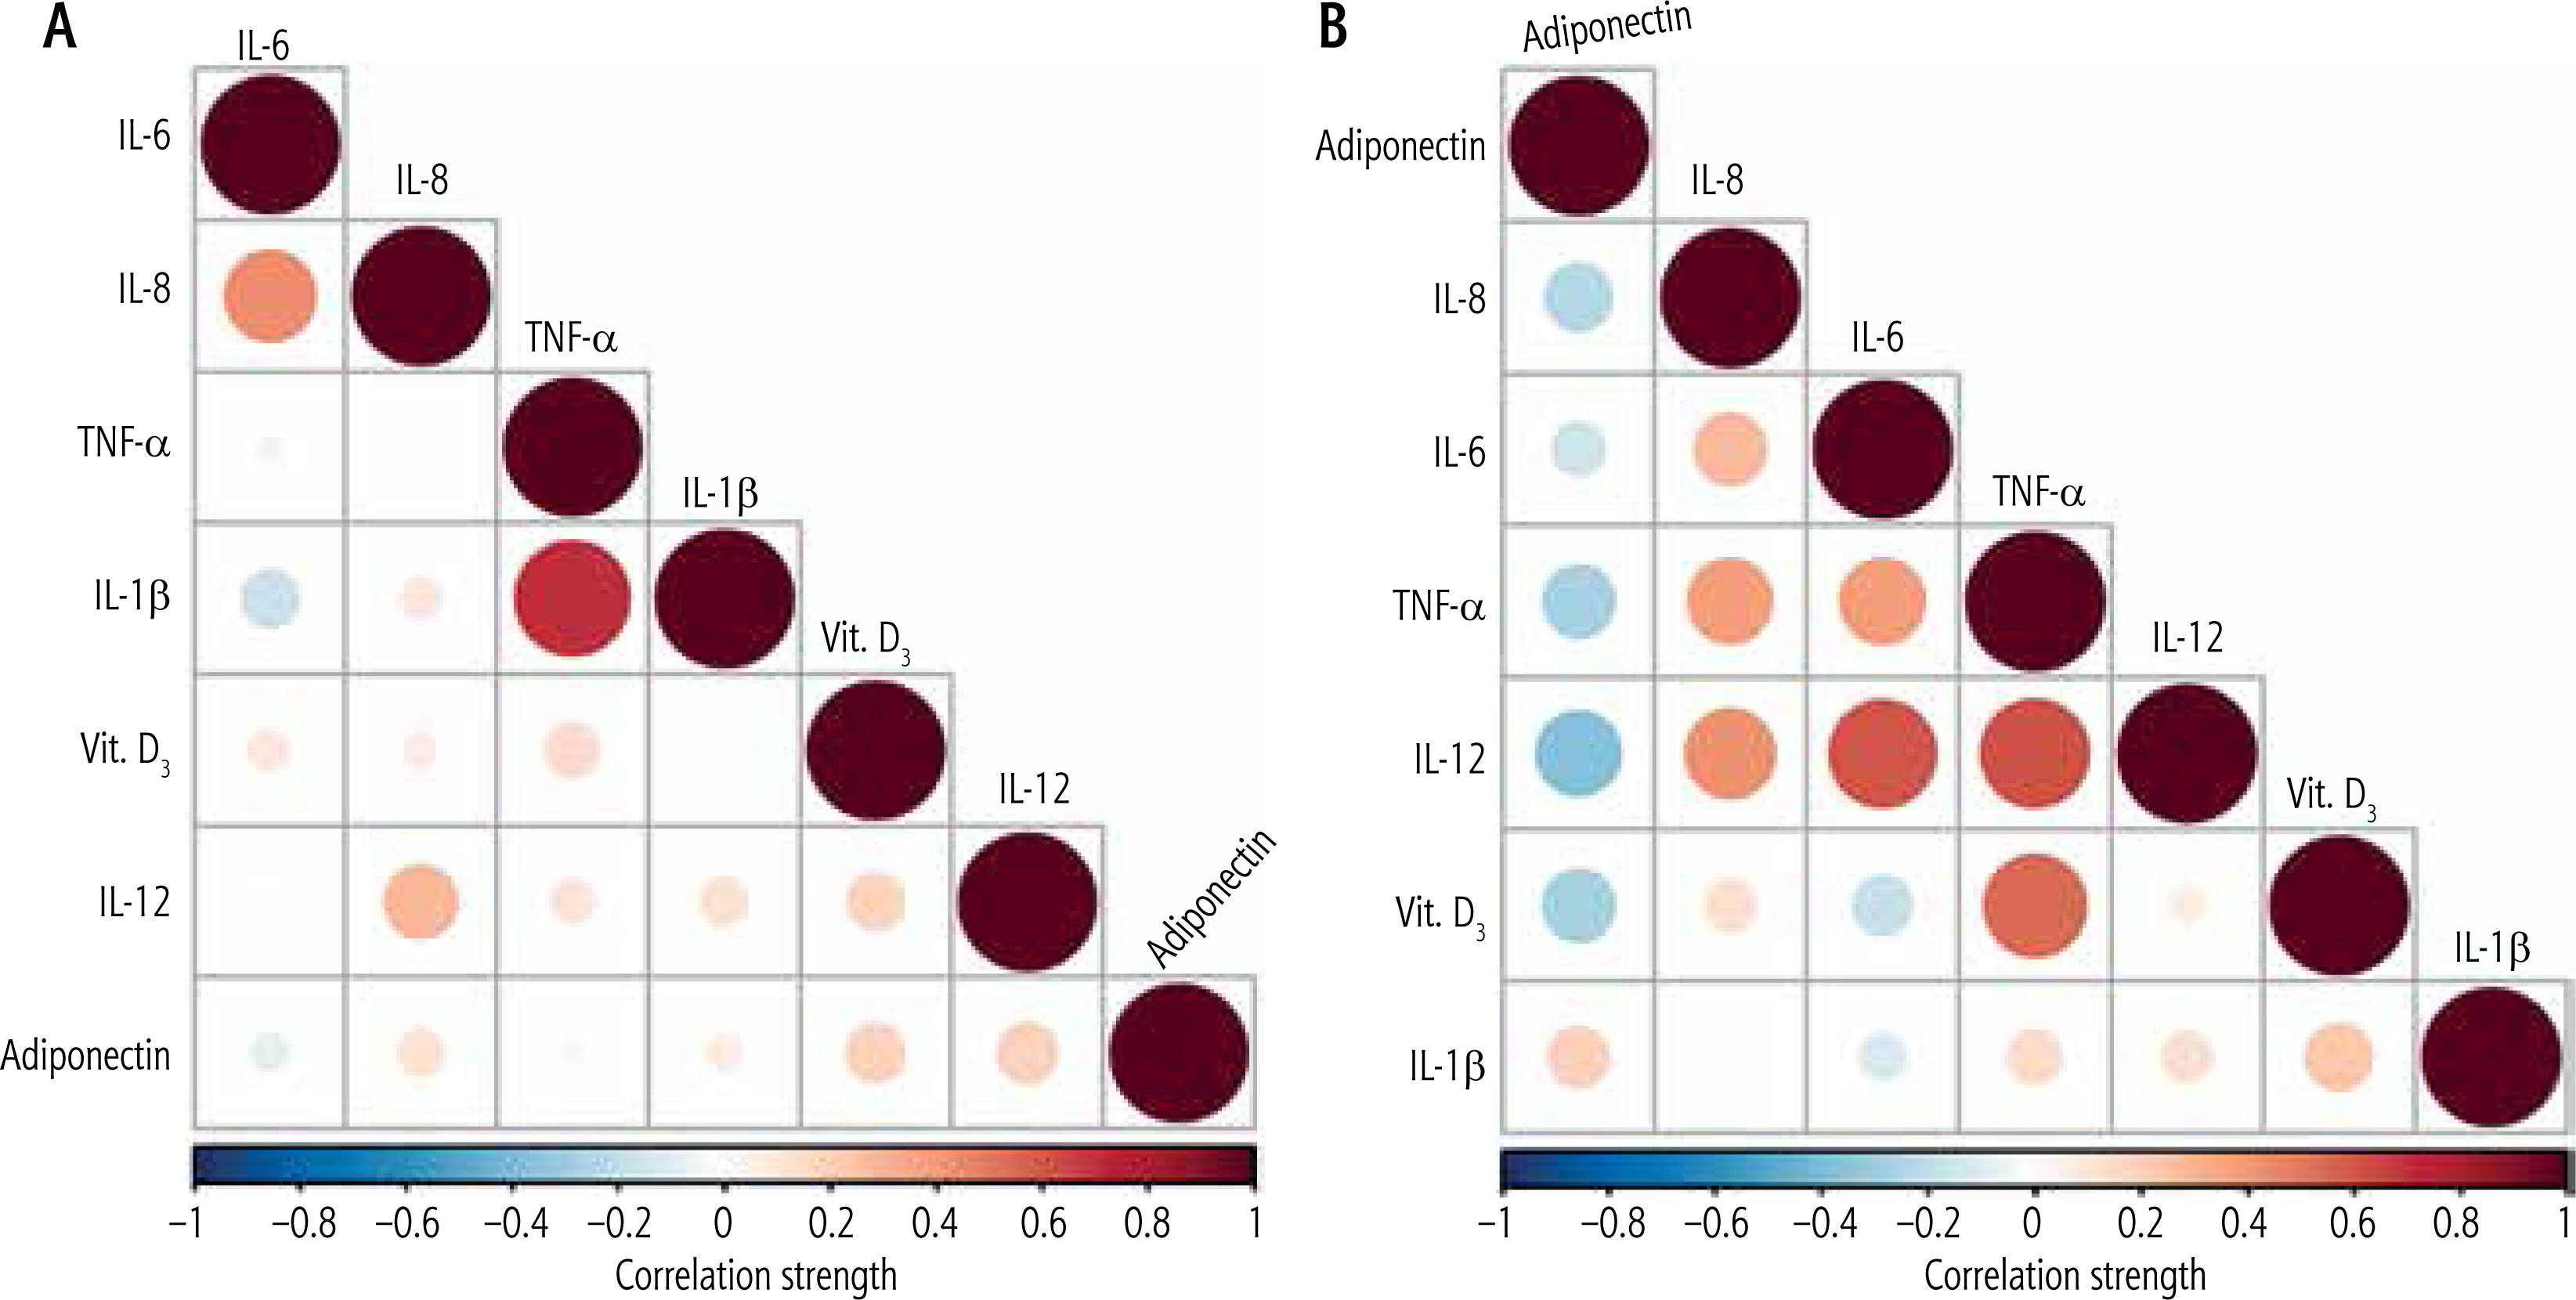
A graphic representation of the correlations between the parameters studied is shown in Figure 3A, B. Figure 3A reveals the presence of strong positive correlations between IL-8 and IL-6 and IL-1β and TNF-α in male patients with acute alcoholic hepatitis. Figure 3B reveals the presence of strong and very strong positive correlations between IL-6 and IL-8, TNF-α and IL-8 and IL-6, IL-12p70 and IL-8, IL-6 and TNF-α, and vitamin D3 and TNF-α in male patients with alcoholic cirrhosis [32–38]. Furthermore, a set of strong negative correlations was observed between adiponectin and vitamin D3, IL-12p70, and TNF-α.
Fig. 3
A) A matrix of correlations between the studied parameters: vitamin D3, TNF-α, IL-1β, IL-6, IL-8, IL-12, and adiponectin at p < 0.05 observed in male patients with acute alcohol hepatitis (AAH). B) A matrix of correlations between the studied parameters: vitamin D3, TNF-α, IL-1β, IL-6, IL-8, IL-12, and adiponectin at p < 0.05 observed in male patients with compensated alcohol cirrhosis (AC)
Discussion
The diagnosis of ARLD is a multifactorial process that includes an analysis of the patient’s medical history, clinical and laboratory tests, imaging, and liver biopsy results. In recent years, various molecular markers for assessment of liver health and the diagnosis of ARLD have also been proposed. Unfortunately, they have limited diagnostic power [39]. Therefore, this report focuses on the differential analysis of serum levels of seven diagnostic markers: vitamin D3, TNF-α, IL-1B, IL-6, IL-8, IL-12p70, and adiponectin. Analysis of cross-correlations between medical conditions and serum levels should allow differentiation between and diagnosis of acute alcoholic hepatitis and alcoholic cirrhosis. Analysis of the Child-Pugh score as a function of alcoholic disease severity produced results contradicting the study by Rey and Effendi-YS [40].
This study did not find statistically significant differences in levels of vitamin D3 in subjects with AAH and AC: 9.21 (22.98 nmol/l) and 11.17 ng/ml (27.88 nmol/l), respectively. A comparison of these results with the revised reference range for serum vitamin D levels (76.33-199.36 nmol/l) [41] shows a three-fold decrease in serum vitamin D3 levels in both study groups, confirming previously reported findings on vitamin D hypovitaminosis as a function of alcoholicrelated liver disease [42].
Recent reports of serum levels of TNF-α in healthy subjects revealed significant discrepancies that made it difficult to compare our results to the previous finding. For example, Li et al. [32] reported a TNF-α range between 5.11 and 7.23 pg/ml, Damas et al. [43] reported levels of TNF-α equal to 75 ±15 pg/ml, and El Menyawi et al. [44] 5.08 ±3.19 pg/ml, while Mourtzikou et al. [45] reported a mean level of TNF-α equal to 1.323 pg/ml. A comparison of the results of this study with the healthy reference ranges presented by others leads us to use the ‘healthy’ mean level proposed by Mourtzikou et al. [45]. Therefore, an analysis of changes in TNF-α as a function of ARLD revealed that subjects with AAH are characterized by higher levels of TNF-α than normal healthy subjects. The levels of TNF-α in AC male patients are analogous to the levels that characterize healthy subjects and lower than the levels observed in male patients with AAH. The first observation confirms previously presented results on cross-correlations between TNF-α levels and AAH [46]. However, no scientific report confirms or disproves our findings on the latter. Analysis of correlations between TNF-α levels and alcohol-related liver disease revealed that among male AC patients there was a strong correlation between serum vitamin D3 and TNF-α, a phenomenon that is not observed in male AAH patients. As a result of the lack of reference data, it is impossible to explain the observed phenomenon.
The results presented in this study revealed statistically nonsignificant differences in levels of IL-1β of 2.95 (2.1-3.96) and 2.1 (1.07-3.18) in male patients with AAH and AC, respectively. The levels observed in both study groups are also higher than those observed in the normal population, revealing an increase in IL-1β levels as a function of alcoholic liver disease, confirming the role of IL-1 in the inflammatory response caused by alcohol-related liver disease [47]. This study also confirmed the control of TNF-α in the expression of IL-1 [24] through a strong positive correlation between IL-1β and TNF-α observed in male patients with AAH. The lack of such a correlation in male patients with AC may be due to advanced liver apoptosis.
A previous study on cross-correlations between alcoholic hepatitis [48] and serum IL-6 levels revealed a directly proportional correlation between IL-6 levels and disease progression. An elevation in IL-6 levels has also been shown to be caused by its protective function against alcohol-induced hepatocyte apoptosis [49]. A comparison of the results of this study with a study that reported healthy levels of IL-6 (0.744 pg/ml) [45] revealed an approximately 300-fold increase in IL-6 levels as a function of ARLD. Furthermore, the observed increase in IL-6 levels in male patients with AAH is five times higher than that reported in a previous study (49.8 ±8.5 pg/ml) [50]. The observed changes confirmed the results previously presented on the cross-correlations between IL-6 concentration and the stage of alcoholic liver cirrhosis [51], for which strong correlations were observed between IL-6 and TNF-α and IL-6 and IL-12p70. Although no analogous correlations were observed in male patients with AAH, a strong positive correlation was observed between IL-6 and IL-8 – a phenomenon previously observed in pancreatic cancer [52].
A previous study on cross-correlations between alcoholic liver disease and serum IL-8 levels [53] showed an increase in IL-8 levels (337.04-536.93 pg/ml) in male patients with AAH compared to normal levels (6.8-39.65) [33]. The results obtained in this study confirm previous observations [53]. However, they do not confirm the results of Kawaratani et al. [22], who found that IL-8 levels were moderately elevated as a function of ARLD progression, with a significant increase in serum IL-8 levels from AAH to AC. The studied medical conditions, AAH and AC, were clearly differentiated by the pattern of correlations between IL-8 and vitamin D3, TNF-α, IL-1β, IL-6, IL-12, and adiponectin. Therefore, AAH is defined by moderate-strength positive correlations between IL-8 and IL-6 and IL-8 and IL-12, while a negative correlation between IL-8 and adiponectin and positive correlations between IL-6, TNF-α, and IL-12 defines AC. The observed negative correlation between IL-8 and adiponectin in AC corroborated a previous study that supported an inhibitory role of adiponectin in the expression of IL-8 [54].
A previous study on the relations between serum IL-12 levels as a function of ARLD revealed mean levels of IL-12 equal to 163.1 ±57.8 pg/ml and 74.4 ±26.2 pg/ml for AAH and AC, respectively [25]. Although serum levels of IL-12 observed in this study were significantly lower than previously reported [23], both studies revealed a similar direction of changes as a function of an advance in ARLD. A comparison of this study with a previous one on cross-correlations between serum levels of IL-12 and ARLD levels (Fig. 2) [55] revealed comparable levels of IL-12 in men with AC and men with alcoholic liver cirrhosis with at least one year of withdrawal from alcohol withdrawal. Furthermore, analysis of the correlation pattern between the studied groups showed a distinct difference between AAH and AC. Therefore, in male patients with AAH, a moderate correlation was observed between IL-12 and IL-8. In male AC patients, a strong positive correlation was observed between IL-12 and IL-8, IL-6, and TNF-α, and a strong negative correlation between IL-12 and adiponectin. The observed negative cross-correlation is analogous to the cross-correlations reported in obese male patients, for whom an increase in adiponectin expression and a decrease in IL-12 expression were reported [56, 57].
Elevated serum adiponectin levels were present in male patients with AC [58] and correlated with AC severity [59]. The results obtained in this study corroborated previous reports and revealed higher serum adiponectin levels in male patients with AAH and AC compared to normal serum adiponectin levels [60]. However, AAH and AC are defined by a different cross-correlation pattern between the molecular markers. In AAH, the correlations between adiponectin and vitamin D3, TNF-α, IL-1B, IL-6, IL-8, and IL-12 were of negligible strength, while in male patients with AC, adiponectin was strongly and negatively correlated with IL-12, vitamin D3, and TNF-α. Therefore, the correlations observed in AC male patients reflect an interplay of anti-inflammatory cytokines and the production of pro-inflammatory cytokines reported in obese male patients [61].
Conclusions
The study extends current knowledge on molecular differentiation between acute alcoholic hepatitis and alcoholic cirrhosis. Since alcoholic cirrhosis is a later stage of ARLD resulting in permanent scarring of the liver, whereas alcoholic hepatitis may be curable, this study was performed to test the hypothesis that the set of specific molecular markers should distinguish between these two stages of ARLD, with the null hypothesis stating that no distinction exists. The results obtained revealed significantly higher levels of IL-12, IL-8, and TNF-α in AAH than in AC patients, which may be indicative of apoptosis occurring in AC patients. However, due to the limitations of this study caused by the sample size, more clinical studies should be performed to evaluate the clinical potential of the studied markers.


